
11.20% p.a. Multi Barrier Reverse Convertible on SAP & Siemens — Simulation Analysis
Headline Results (simulated, base case)
| Metric | Value |
|---|---|
| Expected annualised return | 9.24% |
| Expected total return over holding period (18 months) | 14.40% |
| Probability of negative total return | 4.58% |
| 99% confidence VaR (1 year) | −30.17% |
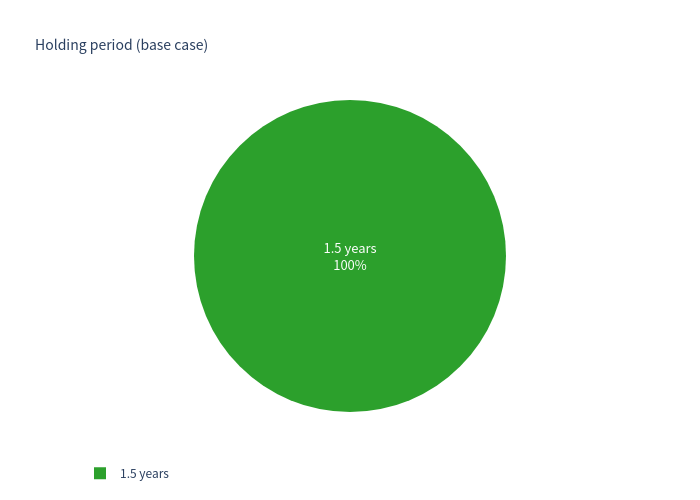
| Expected holding period | 18 months (1.50 years) |
Under the base-case assumption (product held to its 18-month maturity because the early-redemption call is at the issuer's discretion), the structured product offers a high, mostly-coupon-driven expected return with a low probability of loss but a heavy left tail if the barrier is breached.
Basic Product Information
Product: 11.20% p.a. Multi Barrier Reverse Convertible on SAP SE and Siemens AG (SSPA Type 1230), issued in EUR, listed on SIX Swiss Exchange (ISIN CH1593777993).
How it works (layman's explanation)
- The investor receives a fixed quarterly coupon of 2.80% (11.20% p.a. total) regardless of how SAP or Siemens perform — the coupon is paid even in loss scenarios.
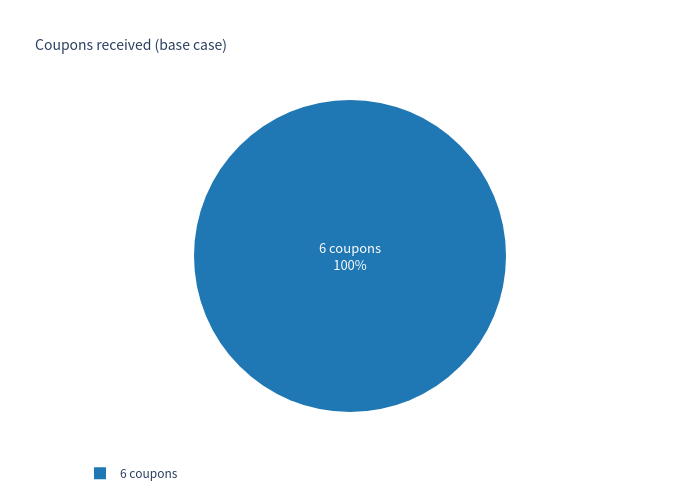
- Over the 18-month term, six coupons of EUR 28.00 per EUR 1,000 are scheduled, i.e. 16.80 index points of coupons on a 100 notional.
- At maturity the investor normally receives 100% of the notional back (par).
- The capital-protection feature is conditional: if, at any point during the term, at least one of the two stocks falls to or below 49% of its starting level (a "barrier event"), and that worst-performing stock is still below its starting level at maturity, then the investor receives that stock's shares instead of cash — a redemption worth less than par (a principal loss). The coupons already collected still cushion the overall outcome.
- If the barrier is never breached (or the worst stock recovers to its start by maturity), the investor gets par + all coupons.
- The issuer may call (redeem) the product early at its discretion on quarterly dates from month 6 onward; if called, the investor receives par + the coupon due on that date, and no further coupons.
Key product parameters: Coupon 11.20% p.a. (quarterly, 30/360) · Barrier 49% of initial level, continuous observation, on either underlying · Strike 100% · Upside capped at par + coupons · Worst-of structure at maturity.
Key Statistics — Structured Product vs Underlying
Simulated over the 18-month product term (10,000 paths). Underlying = equal-weighted SAP/Siemens basket; underlying "total return" includes an estimated dividend yield of ~1.67% p.a.
| Metric | Structured product | Underlying (total return) |
|---|---|---|
| Expected annualised return | 9.24% | 8.36% |
| Expected annualised volatility | 7.76% | 19.28% |
| Probability of negative total return | 4.58% | 34.14% |
| 99% confidence VaR (1 year) | −30.17% | −33.38% |
| Best annualised outcome | +10.91% (base-case max) | +109.42% |
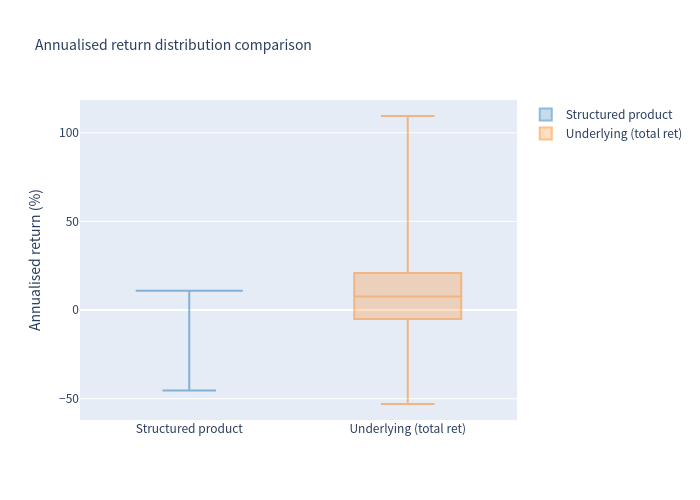
| Worst annualised outcome | −45.36% | −52.98% |
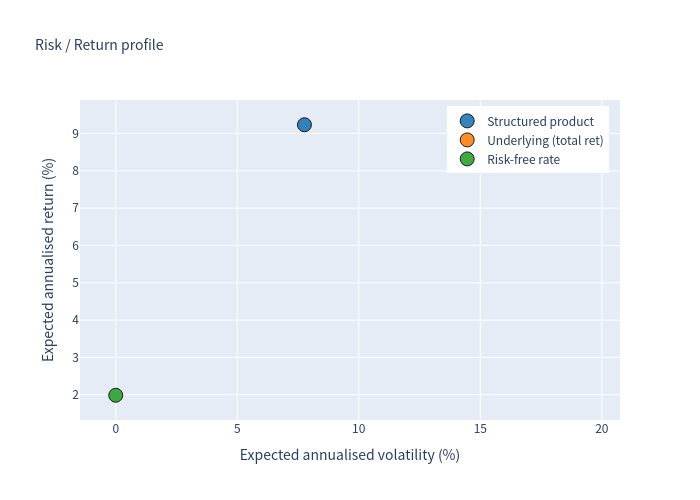
The product delivers a higher expected return than the underlying basket while exhibiting roughly one-third of the volatility — because coupons are paid regardless of performance and losses only occur in the tail scenario (barrier breach + weak maturity). However, the upside is capped at +16.80% total (+10.91% annualised in the no-call base case), so the product underperforms the basket in strong bull markets.
Charts
Simulation outcomes (product vs underlying final return)
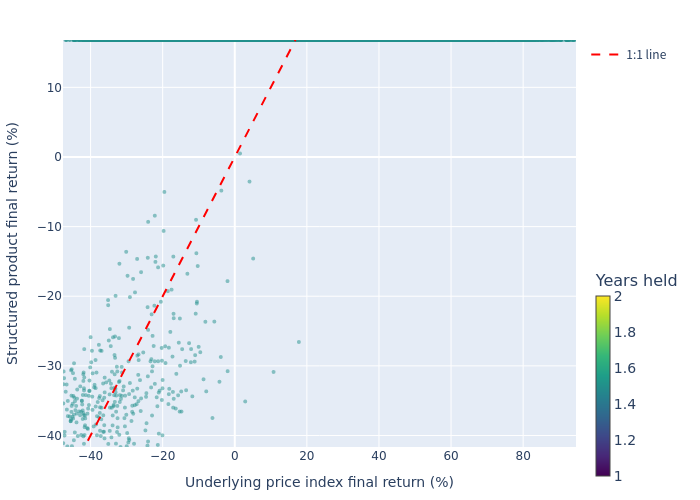
Each dot is one simulated path. Points on the dashed 1:1 line mean the product matched the underlying. In most paths the product sits well above the line (coupon income with par returned); the vertical cluster at the top shows the capped upside, while the diagonal cluster below the line shows barrier-breach loss scenarios (share delivery).
Annualised return histograms
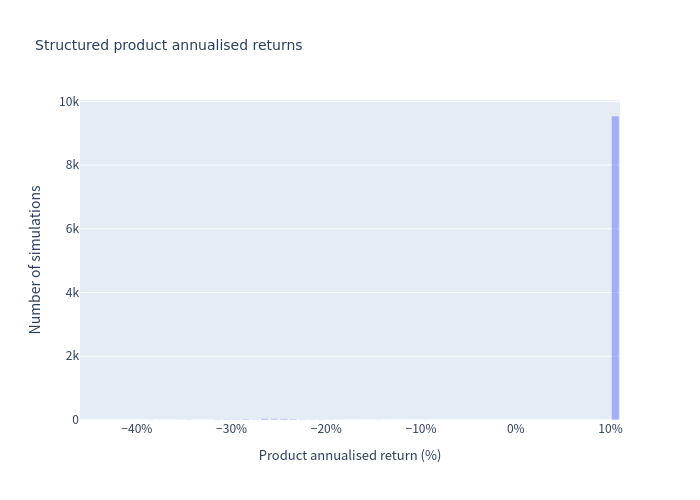
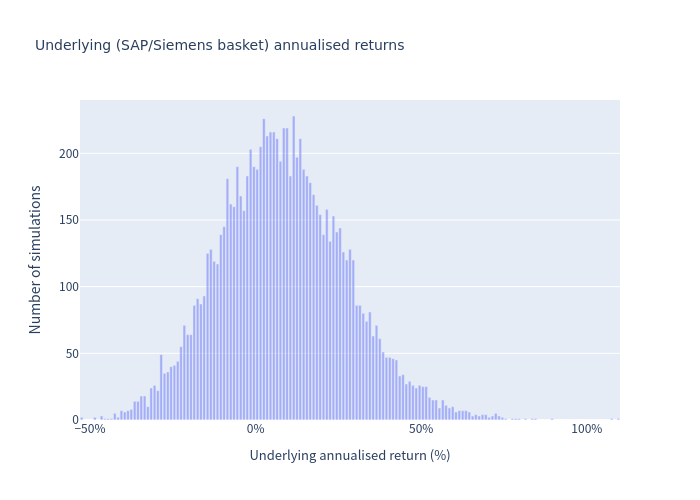
The product's return distribution is heavily concentrated near the maximum (+10.91% annualised) with a small loss tail — the classic reverse-convertible profile. The underlying basket has a broad, roughly symmetric distribution.
Scenario probabilities
Risk / return profile
Return distribution comparison
Holding period & coupon outcomes (base case)
Investment Commentary
Attractive features
- High fixed coupon regardless of underlying performance: 11.20% p.a. paid quarterly, with the full coupon stream (16.80 index points) received in every path that is not called early — even in barrier-breach scenarios.
- Conditional downside protection: a redemption/principal loss requires a combination of a very deep intra-term decline (≥51% below start for at least one stock) and a weak maturity level for the worst performer. The coupons provide a meaningful buffer: because 16.80 points of coupons are collected, the total return only turns negative once the worst stock finishes below roughly 83 index points (≈ −17%).
- Low probability of total-return loss (4.58%) versus 34.14% for direct equity investment, with a comparable 1-year 99% VaR to the underlying basket (−30.17% vs −33.38%).
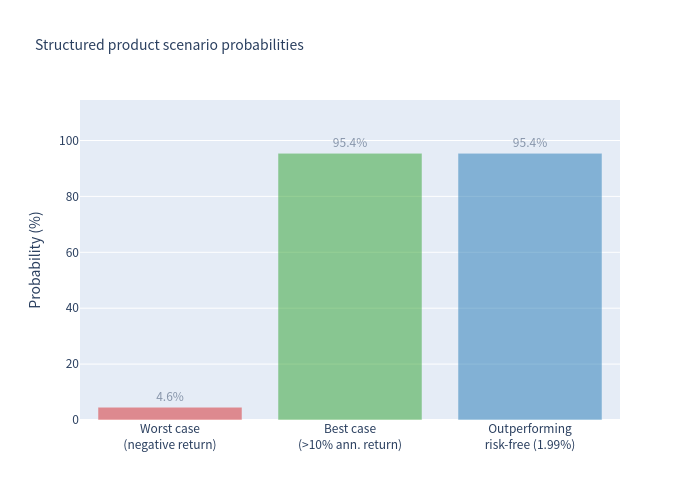
- Expected return above the risk-free rate: 9.24% annualised vs ~1.99% for the EUR risk-free rate, outperforming in ~95% of scenarios.
Considerations
- Upside is capped: the investor forgoes participation in strong SAP/Siemens rallies; the maximum total return in the no-call base case is +16.80%.
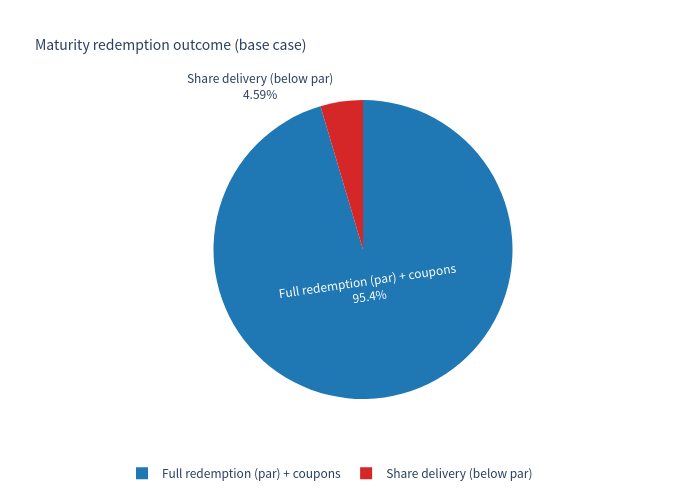
- Worst-of / multi-barrier exposure: only one stock needs to fall below 49% to remove the protection, and the maturity loss is driven by the worst performer. In this simulation a barrier breach almost always coincides with a negative total return (4.59% of paths breached the barrier and 4.58% ended with a total-return loss) — a stock that falls 51%+ intra-term typically still sits well below ~83 index points at maturity. The deep simulated tail (down to −59.61% total return) reflects a severe equity drawdown with share delivery.
- Issuer call feature: because the issuer can redeem early, the full 18-month coupon stream is not guaranteed. If the issuer called at the earliest opportunity (month 6), the outcome would be approximately +5.60% over 6 months (~11.5% annualised) — attractive but shorter-dated; the "+10.91% capped" figure applies to the held-to-maturity base case.
- Credit risk: the investor is exposed to the issuer (Leonteq Securities AG, BBB−), and the product is a debt instrument with derivative character.
Note: figures shown are simulation-based estimates for the base case (no early redemption). Actual results depend on the issuer's early-redemption decision, market conditions at issuance and the terms of the final documentation. This document is for information only and does not constitute investment advice or a suitability assessment.