
MSAMP5 Step-Up Jump Notes with Auto-Callable Feature — Simulation Report
Headline Results
Basic Product Information
How it works (in plain terms)
- The note is linked to the Morgan Stanley Amplitude Index™ (MSAMP5) — a proprietary rules-based multi-asset momentum index (equities, bonds, commodities and currencies via futures, with volatility targeting and embedded costs).
- The note pays no coupons / no periodic interest.
- Auto-call feature: Once a year, if the index closes at or above a step-up threshold (101% → 106% of its initial level), the note is automatically redeemed early and pays a fixed step-up return of 14.75% per annum (simple): e.g., $1,147.50 after 1 year, $1,295.00 after 2 years, up to $1,885.00 after 6 years per $1,000 note.
- If never auto-called, at maturity (7 years): the note pays principal plus 100% of any index appreciation (e.g., +40% index → $1,400 per note), and principal only if the index is flat or lower. There is no downside barrier — full principal protection at maturity.
- Key feature: returns are floored at 14.75% p.a. whenever the note is called, with 1:1 upside at maturity and zero downside — producing a very high expected return with minimal dispersion.
Key Statistics (annualized, simulated)
| Metric | Structured product | Underlying (total return) | Risk-free rate |
|---|---|---|---|
| Expected annualized return | 14.00% | 12.27% | 3.71% |
| Expected annualized volatility | 2.54% | 6.91% | 0.00% |
| Probability of loss | 0.00% | 1.14% | 0.00% |
| 99% VaR (1 year) | 0.00% | −0.42% | 3.71% |
- The structured product delivers a higher expected return (14.00%) with far lower outcome dispersion (2.54%) than the underlying proxy (6.91%).
- Because the note is fully principal-protected at maturity and auto-calls pay at least 14.75% p.a., its worst simulated annualized outcome is 0%, versus −13.4% for the underlying.
- Interpretation: most paths (77%) end at the year-1 auto-call, earning 14.75% over 12 months. The expected total return of 19.72% should be read together with the expected holding period of 1.55 years — short holding periods amplify the annualized figure.
Charts
Simulation Outcomes — Product Return vs Underlying Return
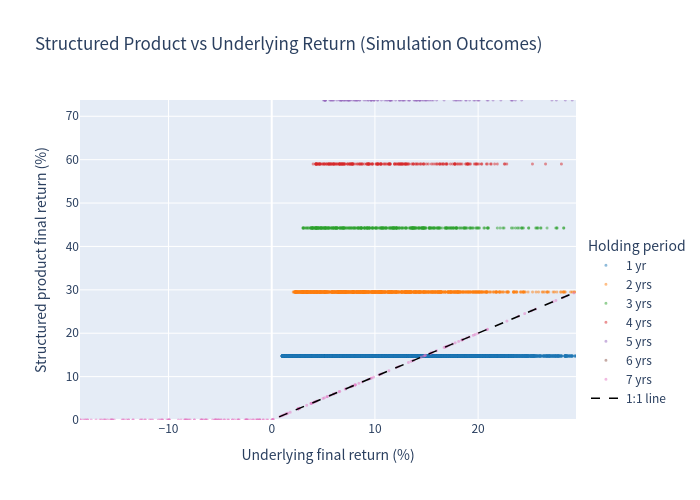
Each dot is one simulated path, colored by holding period. The dashed line is the 1:1 line. The product return clusters at the step-up call returns (14.75%, 29.50%, …) with no outcomes below 0%.
Annualized Return Distributions
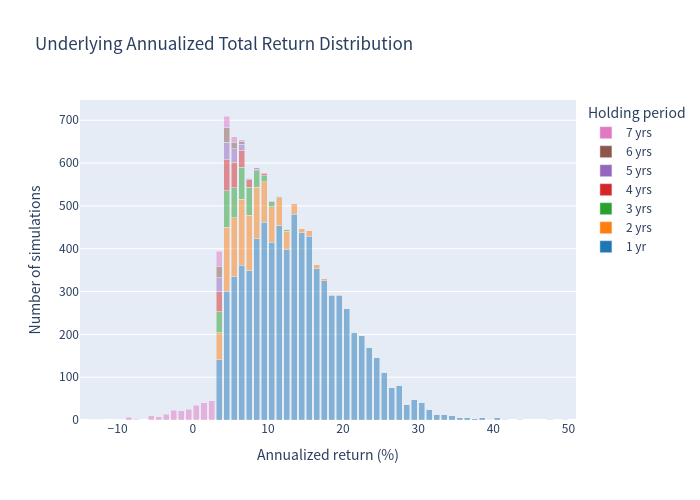
Distribution of the underlying proxy's annualized total returns (price + dividends), 1% bins, stacked by holding period.
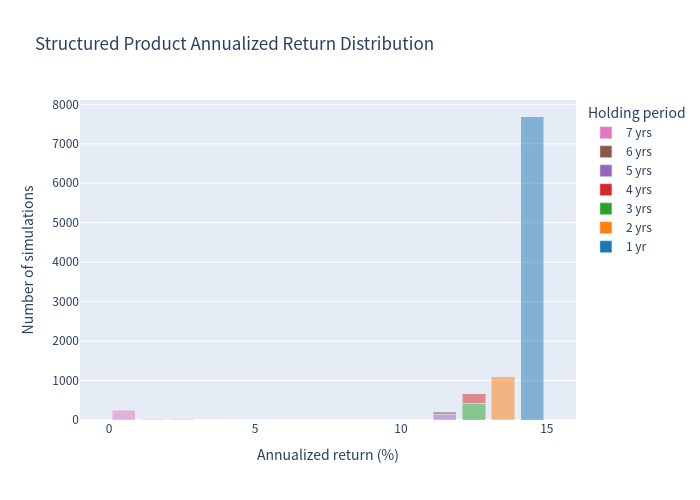
Distribution of the structured product's annualized returns, 1% bins, stacked by holding period. Mass concentrates at the 14.75% year-1 call return; the 0% bin reflects paths held to maturity with a flat/negative index.
Scenario Probabilities
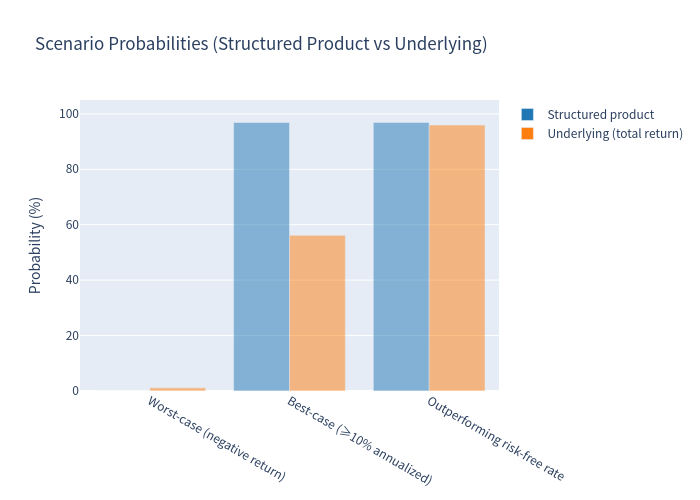
Probability of a negative return, a ≥10% annualized return, and outperforming the risk-free rate — product vs underlying.
Risk / Return Profile
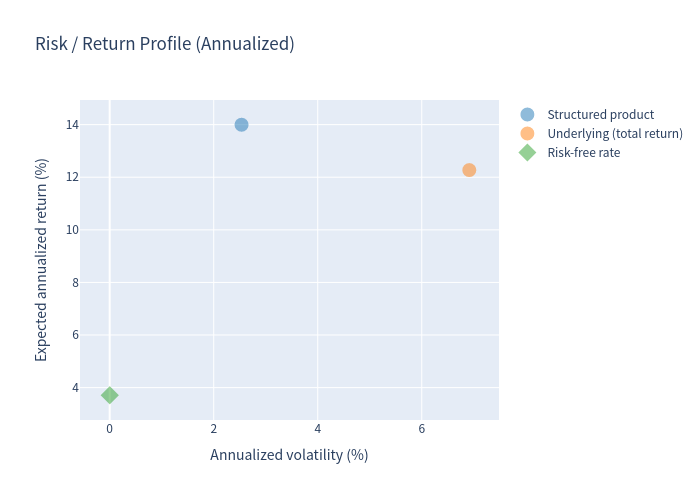
Expected annualized return vs volatility: the product sits far above the risk-free rate with only 2.54% volatility.
Annualized Return Box Plots
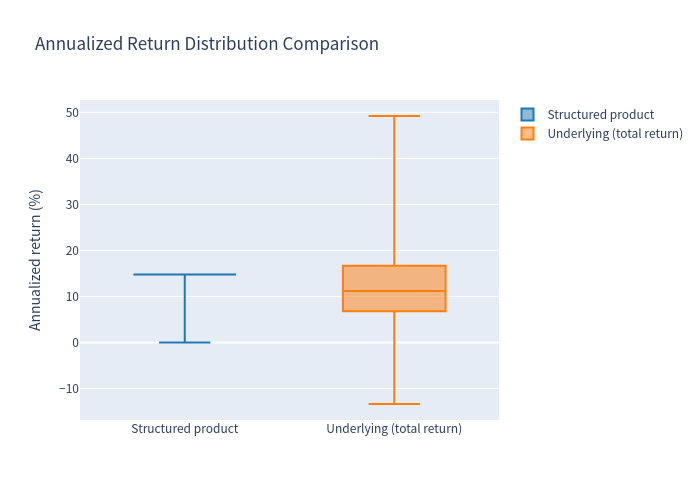
The product's annualized returns are tightly clustered at 14.75% with a 0% floor; the underlying is far more dispersed.
Holding Period Distribution
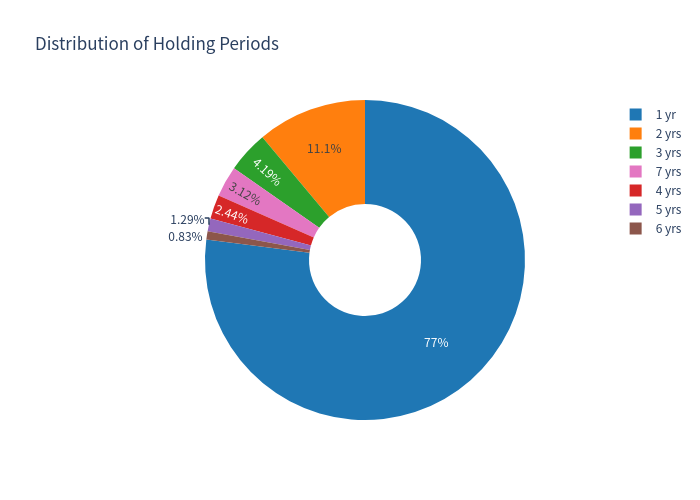
77% of simulations are auto-called after 1 year; 11% after 2 years; only 3% run to full 7-year maturity.
Investment Commentary
Pros
- Built-in principal protection: the note repays 100% of principal at maturity in every simulated index scenario, with no barrier condition.
- Attractive step-up call returns: 14.75% p.a. (simple) whenever the note is auto-called — a high floor relative to the 3.71% risk-free rate.
- Very low risk profile: 0% probability of loss, 2.54% outcome dispersion, and a 0% worst-case annualized outcome.
- Uncapped 1:1 upside at maturity if the note is not called and the index appreciates.
- High expected return per unit of risk relative to both the underlying proxy and the risk-free rate.
Considerations (not investment advice)
- All payments are subject to Morgan Stanley credit risk; the note is not principal-protected against issuer default.
- The proprietary Amplitude index embeds management costs and volatility-targeting overlays, which may lower its realized performance relative to a plain 60/40 portfolio.
- Returns are concentrated in short holding periods (77% called in year 1); if the note is never called, the maturity payoff depends entirely on the final index level at year 7.
- The upside is earned via the step-up call schedule; there is no periodic coupon income.