
Structured Product Analysis — 26.20% p.a. Multi Barrier Reverse Convertible (Leonteq)
Headline Simulation Results
Using 10,000 Monte-Carlo simulations over the product's life (to 23 Dec 2027):
The product pays a large, fixed 26.20% p.a. coupon and only suffers a loss if one of the three shares trades at or below 49% of its starting level at any time during the life of the note. In ~87% of simulations no loss materialises and the investor collects coupons plus par.
Basic Product Information
- Issuer / structure: Leonteq Securities AG (Guernsey Branch) — a Multi Barrier Reverse Convertible, worst-of style, callable by the issuer, Quanto CHF.
- ISIN: CH1593789493 | Denomination CHF 5,000 | Issue price 100%.
- Underlyings (equally weighted, worst-of): Broadcom Inc. (AVGO), CoreWeave Inc. (CRWV), SanDisk Corp. (SNDK).
- Coupon: 26.20% p.a., paid as five fixed quarterly coupons of CHF 327.50 (6.55 points on a 100 index) through 30 Dec 2027.
- Barrier: 49% of the initial level, observed continuously from 25 Sep 2026 to 23 Dec 2027.
- Final fixing / maturity: 23 Dec 2027 / 30 Dec 2027.
- Early redemption: the issuer may call the note on any of 23 Mar / 23 Jun / 23 Sep 2027, returning par plus the coupon due on that date.
How It Works (Layman's Explanation)
The investor is, in effect, lending CHF 5,000 to the issuer for a very high rate of interest, while quietly selling downside insurance on the worst of three technology stocks. As long as none of the three shares ever falls to half its starting price, the investor simply receives the coupons and gets the CHF 5,000 back. If any share does fall to 49% or below (the barrier), protection is lost and — if the worst-performing share finishes below its starting level — the investor receives that worst share (or its cash value) instead of par, and participates in its losses. The heavy coupon is the compensation for taking that risk. Upside on the shares is fully capped: the best the investor can do is the coupon plus par. The issuer additionally has the right to redeem early, which caps how long the very high coupon can run.
Key Statistics — Structured Product vs. Underlying Basket
Comparison is against an equal-weight basket of the three underlyings (total return, i.e. including dividends), measured over each simulation's actual holding period.
| Metric | Structured Product | Underlying Basket (total return) |
|---|---|---|
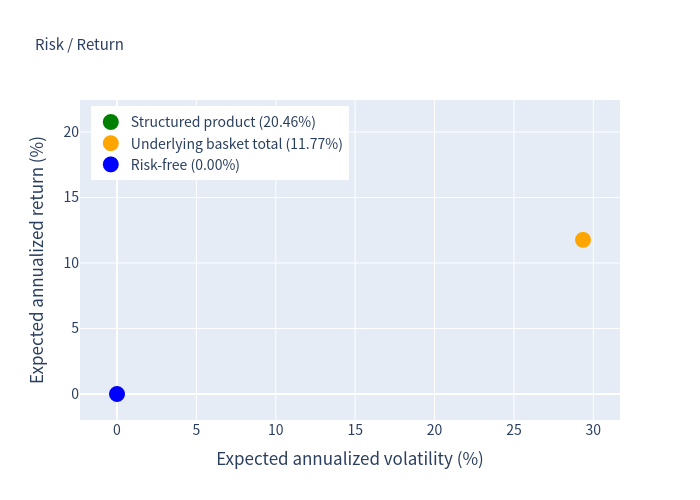
| Expected annualized return | 20.46% | 11.77% |
| Expected annualized volatility | 13.93% | 29.35% |
| Probability of loss | 12.36% | 40.12% |
| 99% VaR (1 year) | -25.44% | -35.40% |
The strategy converts the basket's high, symmetric equity volatility (29%) into a lower-volatility (14%) skewed profile: a very high chance of earning roughly 26% p.a., exchanged for a modest (≈12%) chance of a meaningful capital loss if the barrier is breached.
Simulation Outcomes
Product return vs. underlying return (each dot = one simulation)
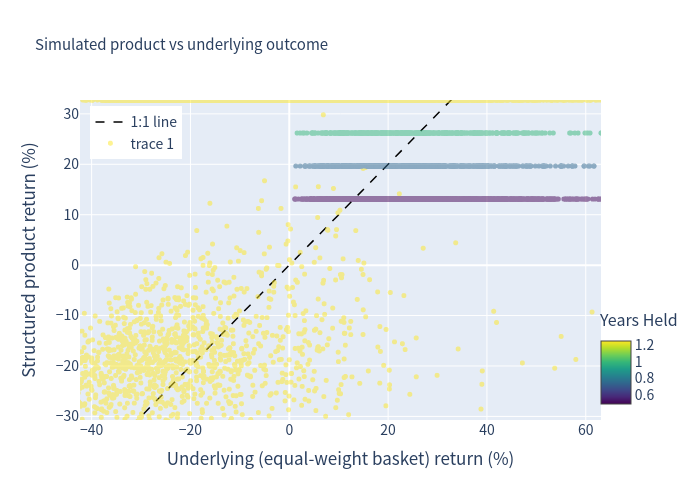
Dots near the top of the chart (return ≈ +26% p.a.) are simulations that were redeemed early or matured with no barrier breach. The lower cluster captures the barrier-breach cases, whose returns track the decline of the worst-performing share (offset by the coupons already received).
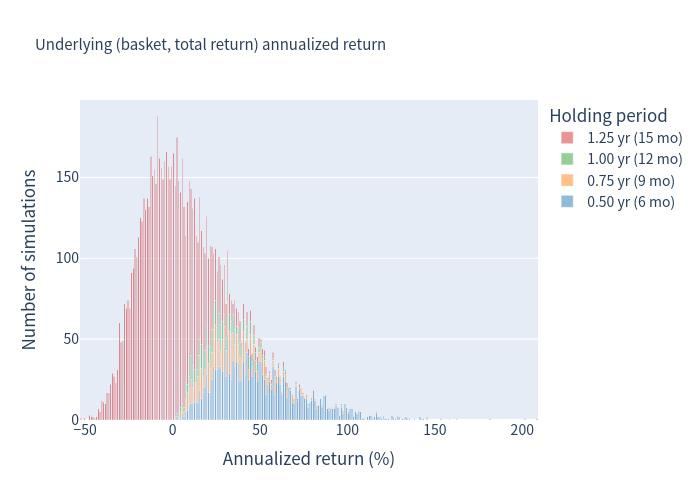
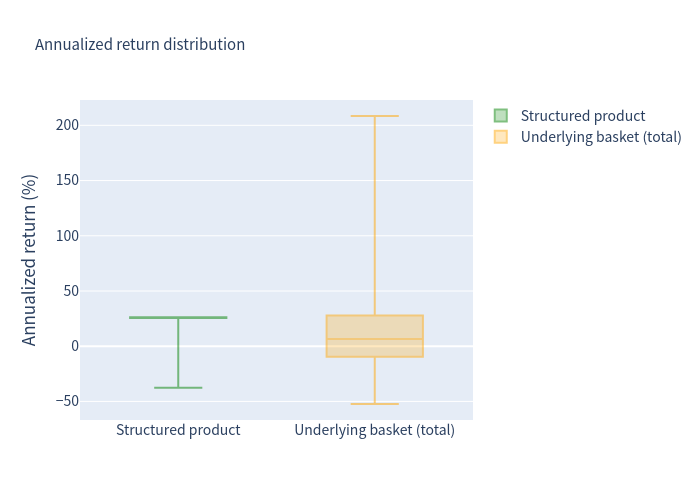
Distribution of annualized returns
Underlying basket (total return), coloured by holding period:
Structured product, coloured by holding period:
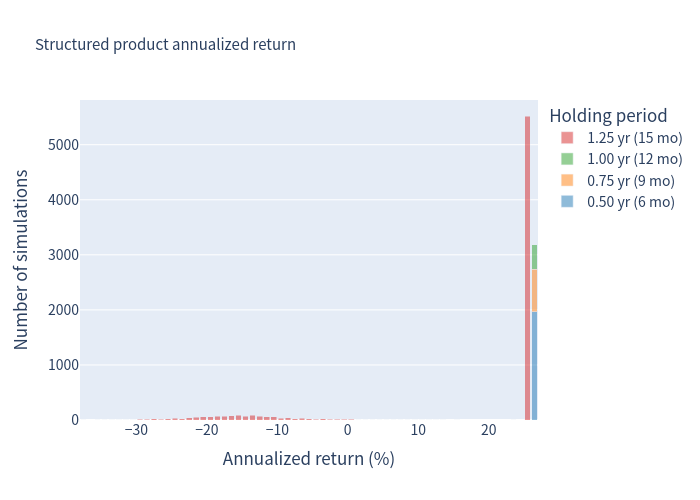
The basket is wide and roughly symmetric with a heavy left tail, while the product is tightly clustered at a positive outcome with a distinct loss tail created by the barrier.
Risk / return
Early Redemption and Coupon Outcomes
Because the issuer may call the note, the holding period is not fixed. In the simulation the note is called early in roughly 32% of paths (at month 6: 19.7%; month 9: 7.7%; month 12: 4.5%) and runs to maturity in the remaining ~68%.
| Holding period | Probability |
|---|---|
| 6 months | 19.70% |
| 9 months | 7.65% |
| 12 months | 4.51% |
| 15 months (maturity) | 68.14% |
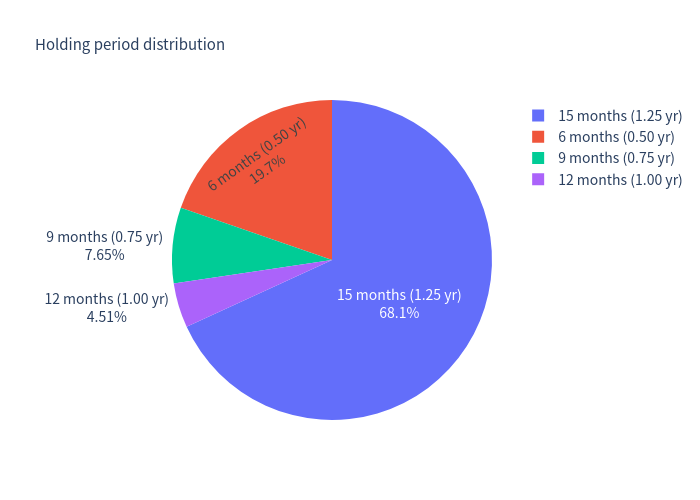
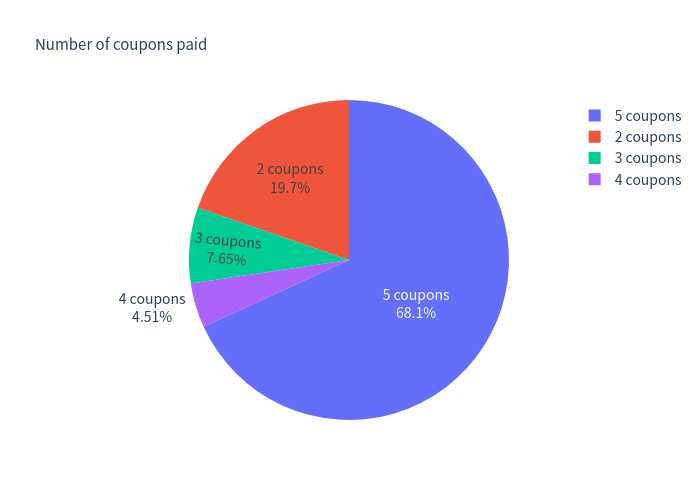
Investors receive the full five coupons in about 68% of paths, three or more coupons in about 80% of paths, and the average number of coupons paid is 4.2.
Scenario Probabilities
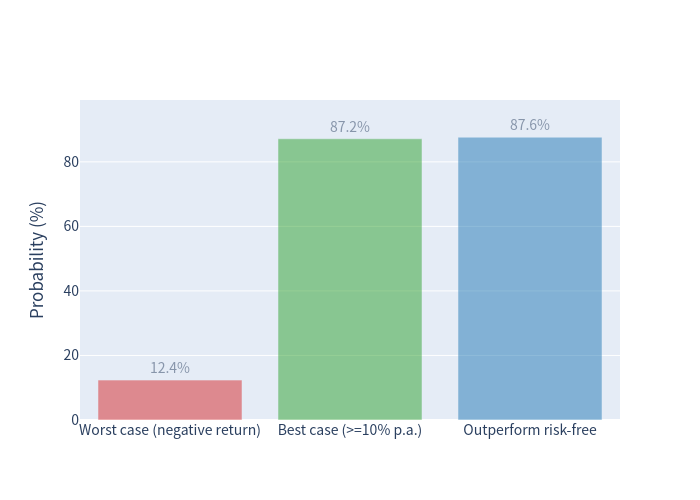
| Scenario | Probability |
|---|---|
| Worst case — negative return | 12.36% |
| Best case — ≥ 10% p.a. | 87.16% |
| Outperform the risk-free rate | 87.64% |
Investment Commentary
Potential Merits
- Very high headline coupon (26.20% p.a.) for a product with a 51% cushion to the barrier — most of the return is delivered as a fixed, unconditional stream of coupons while the barrier remains intact.
- Historically low loss probability with a modest loss rate: in ~88% of simulated paths the investor earns the full coupon stream or close to it; the loss is realised only when a share halves.
- Broad diversification across three large-cap technology names rather than a single stock, which makes it less likely that any single blow-up alone triggers the barrier (the barrier only binds if at least one share breaches 49%).
- Quanto CHF removes the USD/CHF currency risk for a Swiss-franc investor.
- Compared with the raw basket, the simulated risk/return profile is favourable: a materially higher expected return with roughly half the volatility and a shallower 99% VaR.
Risks to Keep in Mind
- Worst-of exposure: the payoff is driven by the single weakest of the three shares. Diversification between the underlyings is fully lost the moment one name underperforms.
- Capped upside: the investor never participates in share appreciation; the maximum outcome is coupon + par.
- Issuer credit risk: repayment depends on Leonteq (rated BBB-); the coupon is compensation for this credit exposure as well as for the embedded put.
- Concentrated sector/liquidity risk: all three underlyings are high-beta technology names, and two (CoreWeave, SanDisk) have a very short listed history — market-model estimates of their volatility can be unreliable, so the modelled barrier-breach probability may be understated and the loss tail under-modelled.
- Physical delivery: in the loss scenario the investor can end up holding the worst-performing stock, with further market risk until it is sold.
- Callable: the issuer's early-redemption right truncates the period over which the very high coupon is earned.
* This analysis is for information purposes only and does not constitute investment advice.