
tokenengine.ai
info@tokenengine.ai
Structured Product Evaluator
8.00% p.a. Multi Barrier Reverse Convertible (Callable) — Simulation Analysis
Headline Results
Based on 10,000 Monte Carlo simulations of the four underlying Swiss bank stocks over the product's 24-month term:
The product pays a fixed 8.00% p.a. coupon (2.00% quarterly) and returns principal at par unless a barrier event occurs and the worst-performing underlying finishes below its strike at maturity. The expected annualized return of 4.44% is below the 8% coupon rate because a meaningful left tail of simulations (≈16%) experiences principal losses when one or more underlyings fall through the 65% barrier.
Basic Product Information
How It Works (layman explanation)
- The investor receives a fixed 8% p.a. coupon every quarter for as long as the product runs, regardless of how the underlying bank stocks perform.
- The issuer (Leonteq) can "call" the product early on four dates. When called, the investor receives back the full CHF 1,000 per product plus the coupon then due, and the product ends.
- At maturity (if not called early), the investor gets back the full principal unless a "barrier event" has occurred — i.e. at any point during the product's life at least one of the four banks' shares traded at or below 65% of its starting level — and the worst-performing share also finishes below its starting level at maturity.
- If a barrier event occurred and the worst-performing of the four shares finishes below its starting level at maturity, the principal is reduced by the full shortfall of that worst performer (e.g. worst share −40% ⇒ receive 60% of principal).
- Upside is capped: the investor receives only the fixed coupon stream and does not participate in any share-price gains.
Key Statistics
| Metric | Structured Product | Underlying Basket (incl. dividends) |
|---|---|---|
| Expected annualized return | 4.44% | 10.83% |
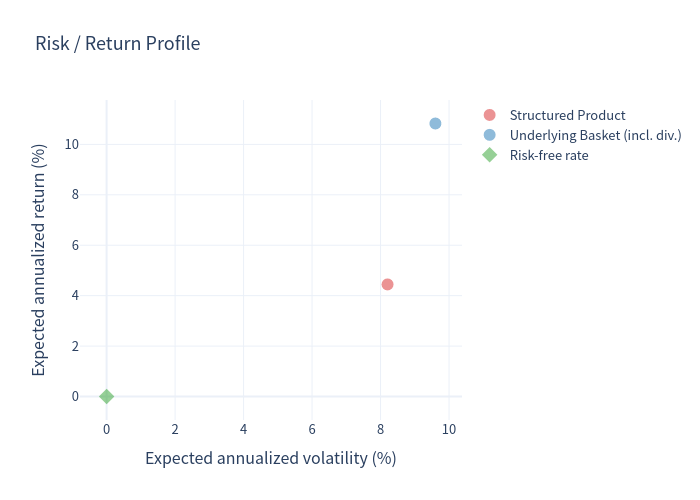
| Expected annualized volatility | 8.20% | 9.60% |
| Probability of loss | 15.94% | 11.82% |
| 99% VaR (1-year, annualized) | -26.52% | -8.79% |
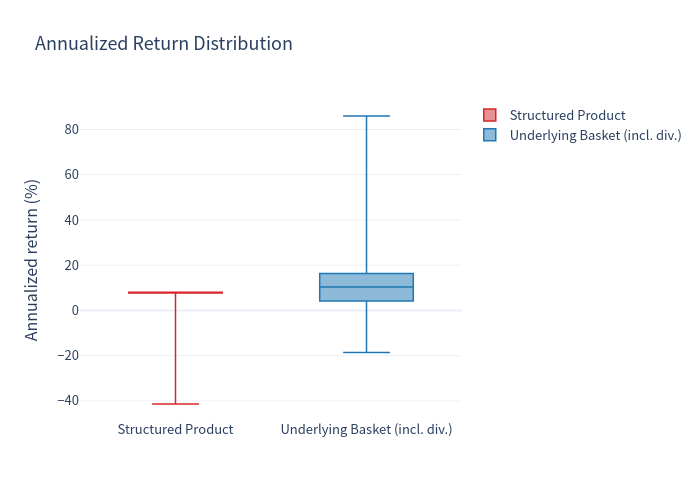
| Min / Max annualized return | -41.35% / 8.00% | -18.58% / 85.96% |
Underlying benchmark = equal-weight basket of the four underlying stocks (price performance + average dividend yield of ≈3.16%).
Outcome profile of the simulation
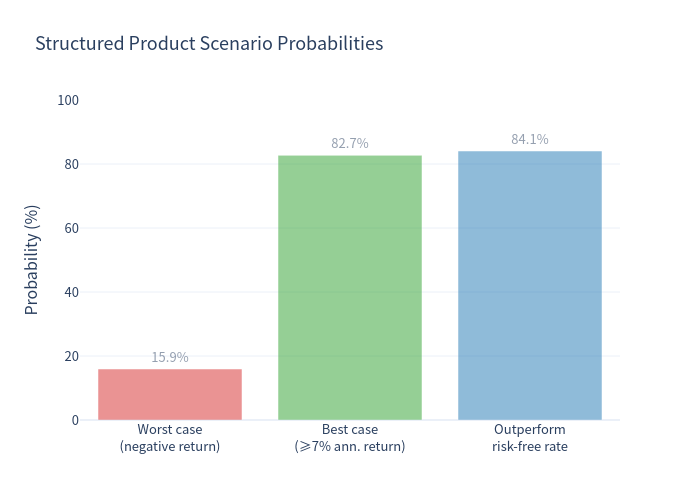
- Principal repaid in full: 82.7% of simulations
- Principal loss (barrier hit + worst performer below strike at maturity): 17.3%
- Barrier event (any underlying ≤ 65% at any month): 18.9%
- Early redemption (issuer call): 48.9% of simulations
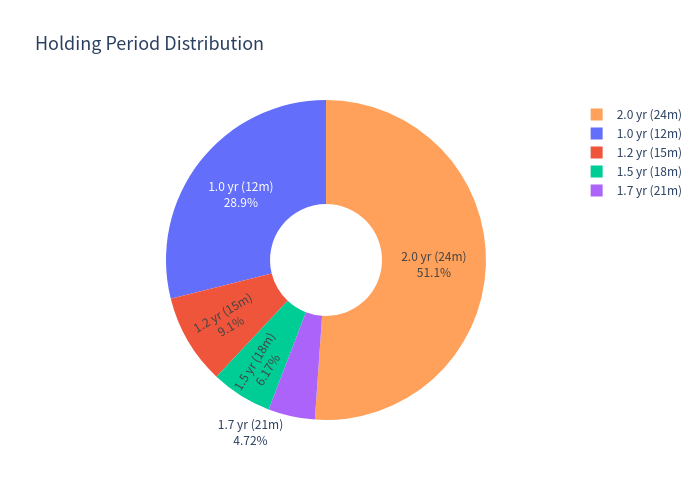
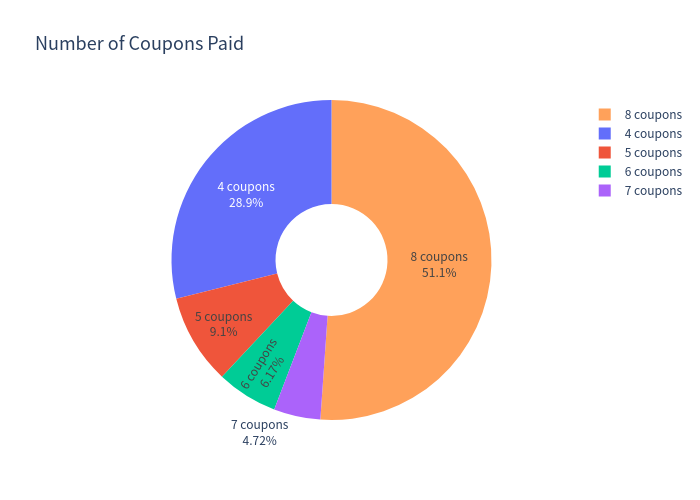
- Coupons received: 4 coupons 28.9% · 5 coupons 9.1% · 6 coupons 6.2% · 7 coupons 4.7% · 8 coupons 51.1%
Charts
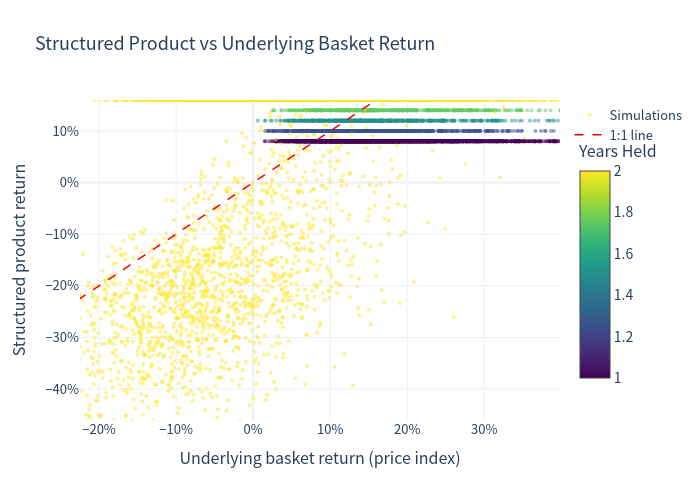
Simulation Outcomes — Product Return vs Underlying Basket Return
Each dot is one simulation; color shows how long the product was held. The dashed red line is the 1:1 line.
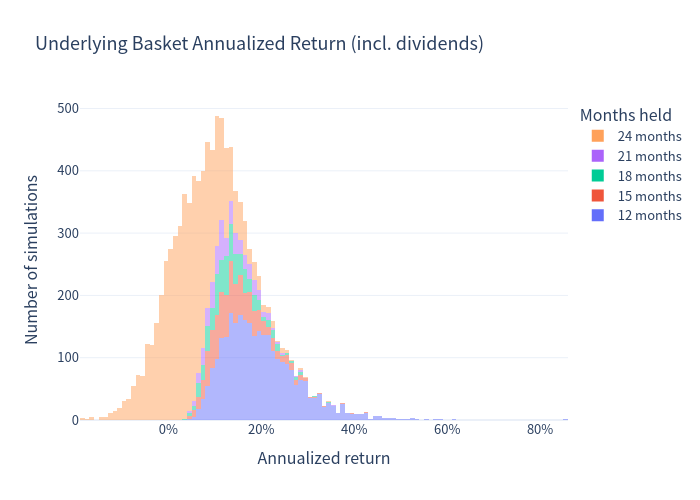
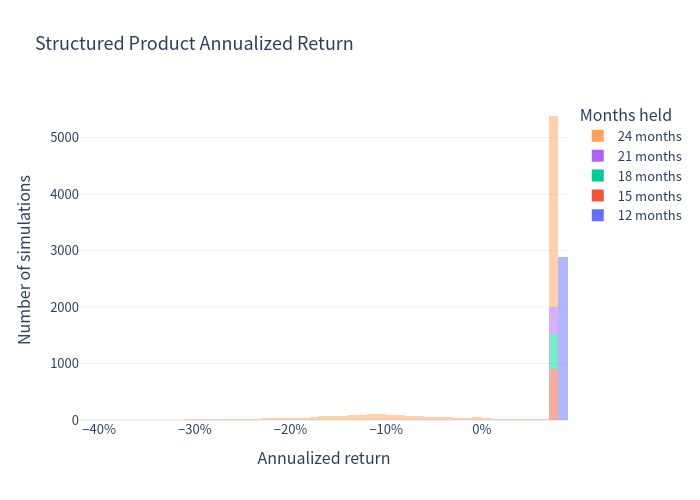
Annualized Return Distributions (1% bins, stacked by holding period)
Distribution of annualized returns for the underlying basket (top) and the structured product (bottom).
Scenario Probabilities
Share of simulations ending in each outcome class (full repayment, principal loss, barrier event, early redemption).
Risk / Return Profile
Annualized return versus annualized volatility for the structured product and the underlying basket.
Return Distribution Comparison
Box plot comparing the distribution of annualized returns between the structured product and the underlying basket.
Holding Period and Coupon Distributions
Distribution of realized holding periods (left) and number of coupons received (right).
Investment Commentary
Strengths
- Attractive, unconditional coupon income: the 8.00% p.a. (2% quarterly) coupon is paid in all scenarios and on all coupon dates, including after a barrier event, and is not conditional on underlying performance.
- Meaningful downside cushion: the 65% barrier provides protection — full principal is returned unless at least one underlying trades at or below 65% of its start level and the worst performer also finishes below its strike at maturity. Barrier-related principal loss occurred in only ~17% of simulations.
- Favourable expected outcome distribution: ~84% of simulations end with a positive return, and in ~51% of cases the product is held to maturity collecting all eight coupons (16 index points total).
- Structured downside participation: in a loss scenario, the investor's loss is capped at the shortfall of the worst performer (no leverage, no additional capital calls); the low-volatility profile (8.2% annualized) is well below that of the underlying basket.
Considerations
- Capped upside: the investor forgoes all upside participation in the underlying shares — the maximum annualized return is capped at the 8% coupon.
- Issuer call risk: the issuer can redeem early (modelled here as exercising the call when all underlyings are at or above their start levels, which occurred in ~49% of simulations), truncating the coupon stream and reducing total coupon income.
- Tail risk: in the worst simulated outcomes (worst performer falling well below the 65% barrier and ending far below strike), the product can lose a large share of principal; the 99% VaR is -26.52% on an annualized basis.