
Morgan Stanley Finance LLC — Callable Jump Notes due February 4, 2031
Worst-of Nasdaq-100® Technology Sector Index, Russell 2000® Index and S&P 500® Index
CUSIP 61780AKK0 · USD 1,000 principal · Fully guaranteed by Morgan Stanley
Headline Simulation Results
Across 10,000 simulated scenarios the notes never lose money — the structural principal protection is respected in every path. The trade-off is a materially lower expected return than simply holding the underlyings, and a long expected holding period.
Basic Product Info — What It Is
- Issuer / Guarantor: Morgan Stanley Finance LLC / Morgan Stanley (unsecured).
- Principal: USD 1,000 per note, 100% principal protected at maturity.
- Underlyings (worst-of): Nasdaq-100 Technology Sector Index, Russell 2000 Index, S&P 500 Index.
- No regular coupon. Income comes only from an early-redemption payment or a maturity upside payment.
- Issuer callable: monthly from February 2027 to January 2031; the redemption payment steps up linearly (~+13.0% per year on the principal, e.g. $1,130 at year 1 rising to $1,639 at year 5).
How It Works (in plain terms)
- You are repaid your USD 1,000 at maturity no matter how the three indices perform — the only thing at risk is upside, never principal.
- If, at maturity, all three indices are above their starting levels, you additionally receive 125% × the return of the worst-performing of the three indices. If any one index ends flat or down, you simply get your USD 1,000 back (a 0% return).
- Morgan Stanley may call (redeem) the notes early on any monthly date if its pricing model says doing so is economical for the issuer — effectively locking you in at the fixed step-up schedule (~13%/yr). This call is what caps the upside: rallies that come early tend to be redeemed at the scheduled amount rather than letting the 125% participation run.
Key Statistics (10,000 simulations)
| Metric | Structured Product | Underlying basket + dividends | Underlying basket (price only) |
|---|---|---|---|
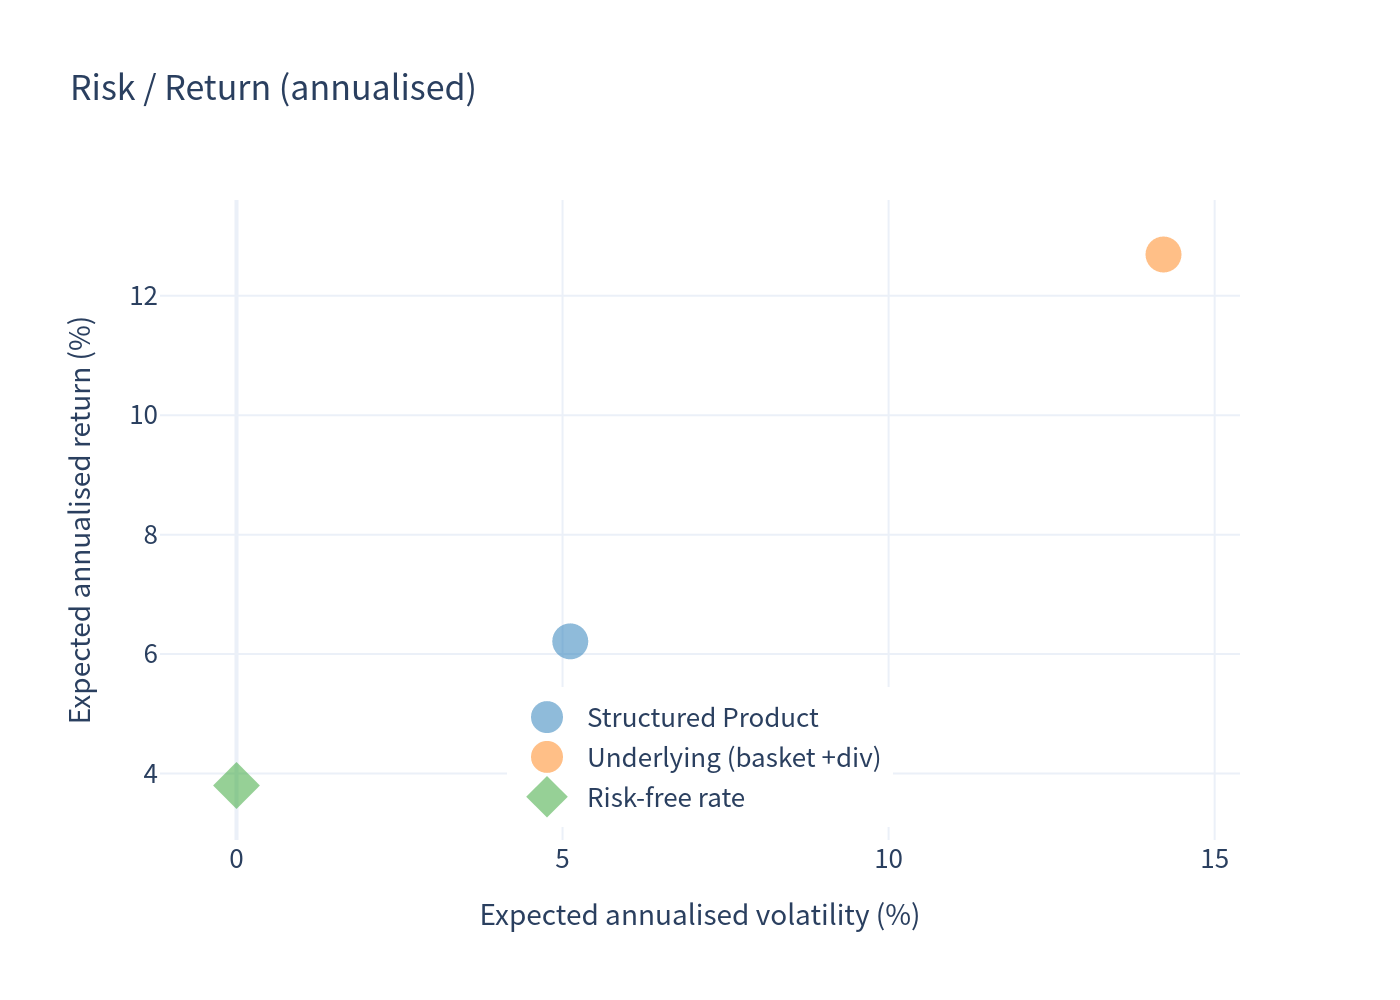
| Expected annualised return | 6.21% | 12.69% | 11.87% |
| Expected annualised volatility | 5.12% | 14.22% | 14.22% |
| Probability of loss | 0.00% | 15.02% | 17.09% |
| 99% confidence VaR (1 year) | 0.00% | −12.88% | −13.70% |
| Risk-free rate (1-year average) | 3.80% | 3.80% | 3.80% |
The benchmark is an equally-weighted basket of the three underlyings. Dividend yields are added to the benchmark (weighted average ≈ 0.82%) for total-return comparison.
Outcome distribution (structured product)
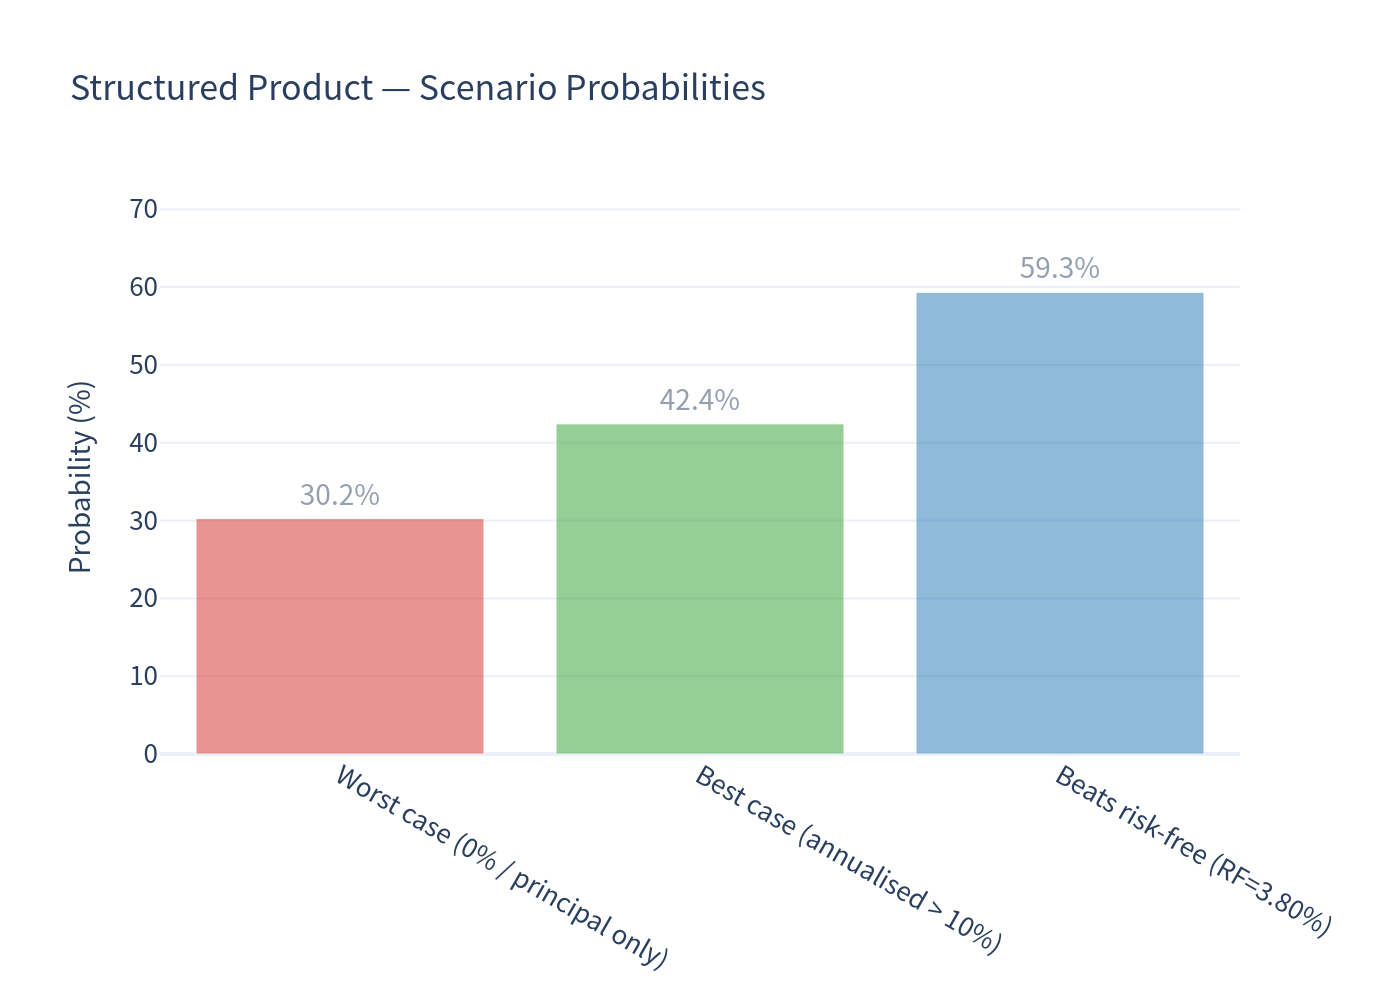
- Principal-only / 0% return: 30.2% of scenarios
- Annualised return above 10%: 42.4% of scenarios
- Beats the risk-free rate: 59.3% of scenarios
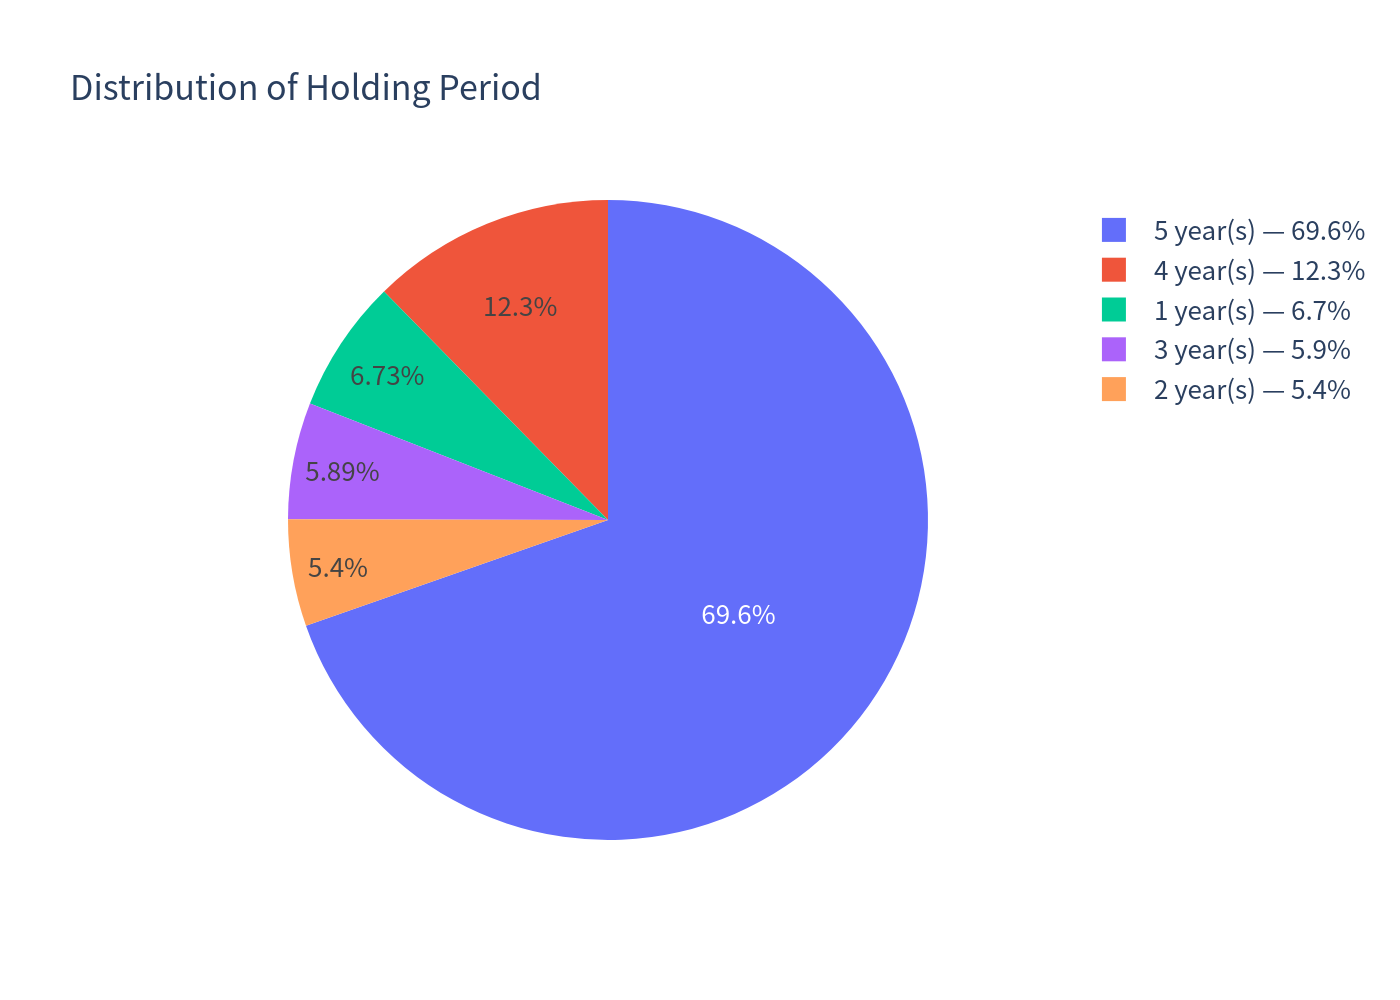
- Called early at some point: 40.2% of paths · Held to full maturity (5 years): 59.8% of paths
- Held ≥ 4.5 years (5-year holding bucket): 69.6% of paths
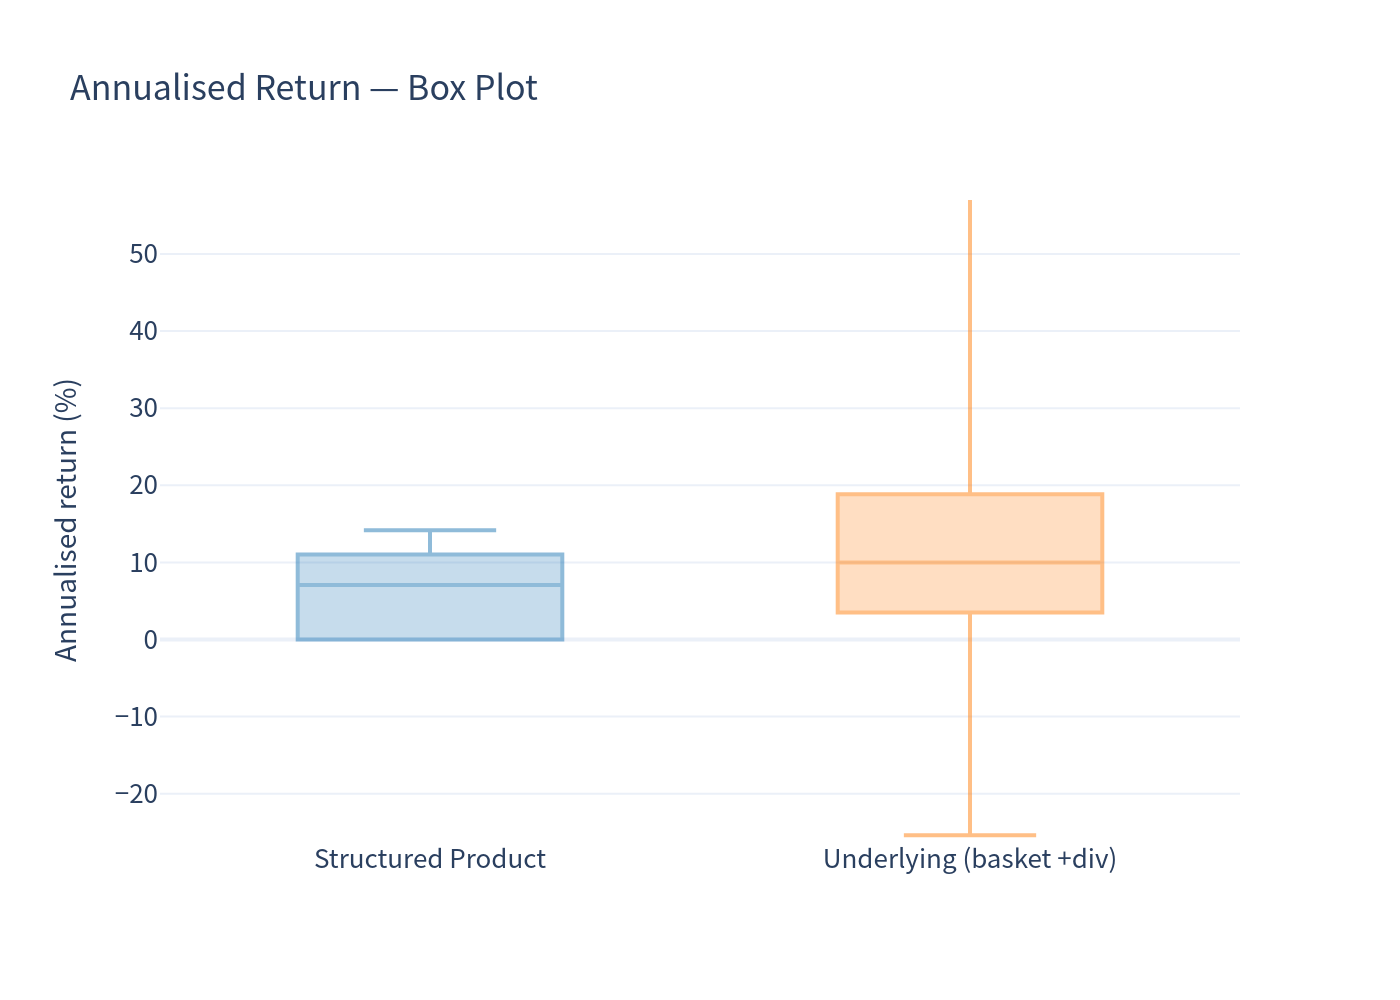
- Median annualised return — all paths: 7.08% · early-called paths only: 11.17%
Charts
Simulation outcomes vs the underlying
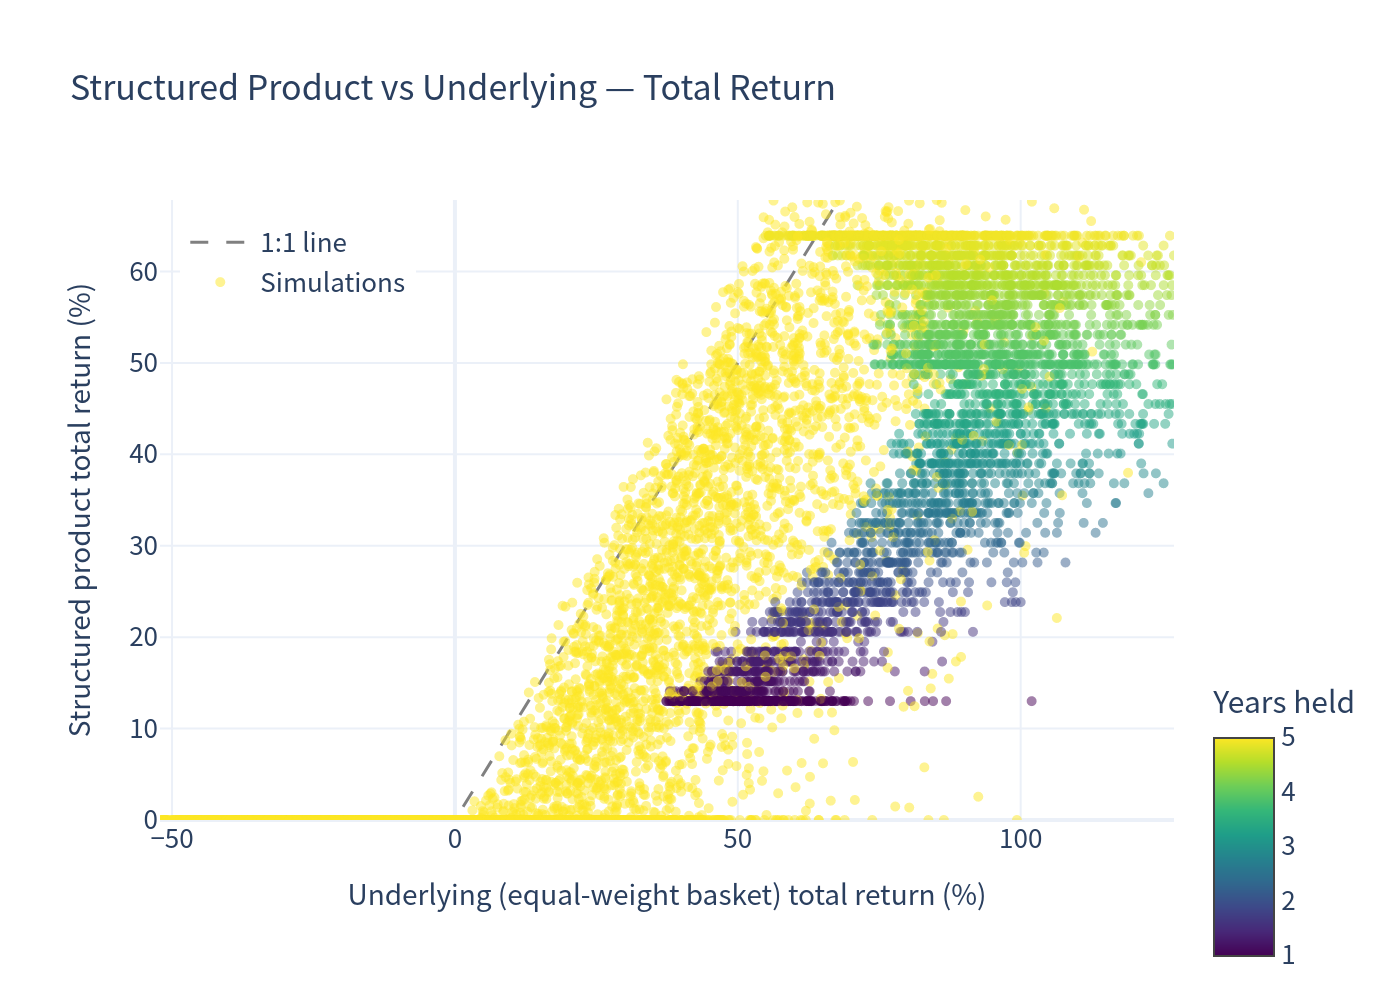
Each point is one simulation: the structured product's total return (y) against the equal-weight basket's total return (x), coloured by holding period. The product is capped on the upside (issuer call) and floored at 0% on the downside, so it sits below the 1:1 line for strong market outcomes and above it for weak ones.
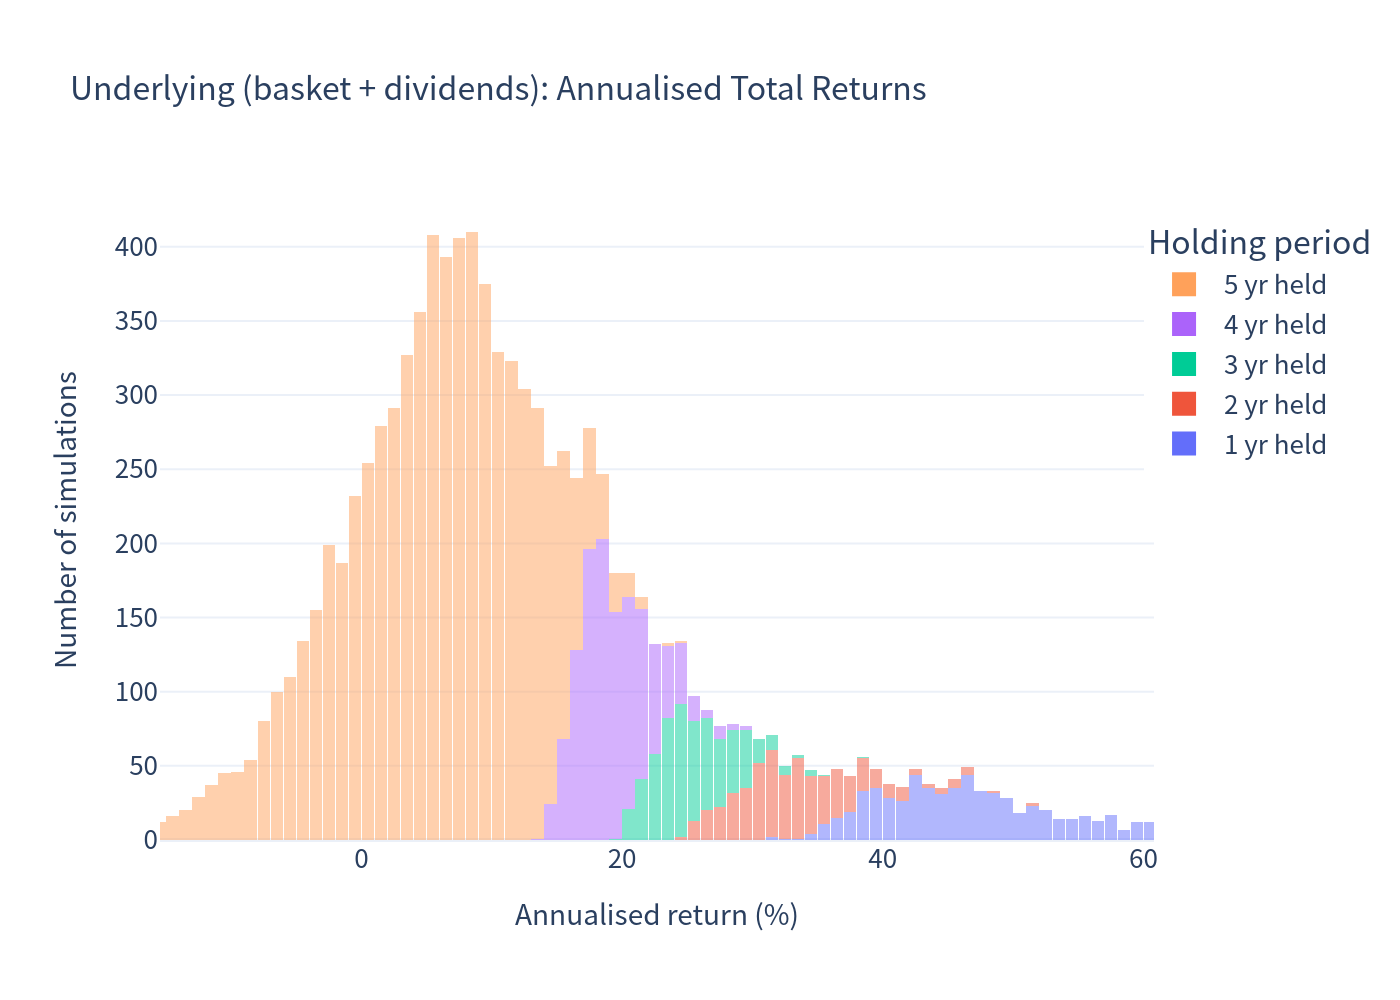
Distribution of underlying annualised total returns
Distribution of structured product annualised returns
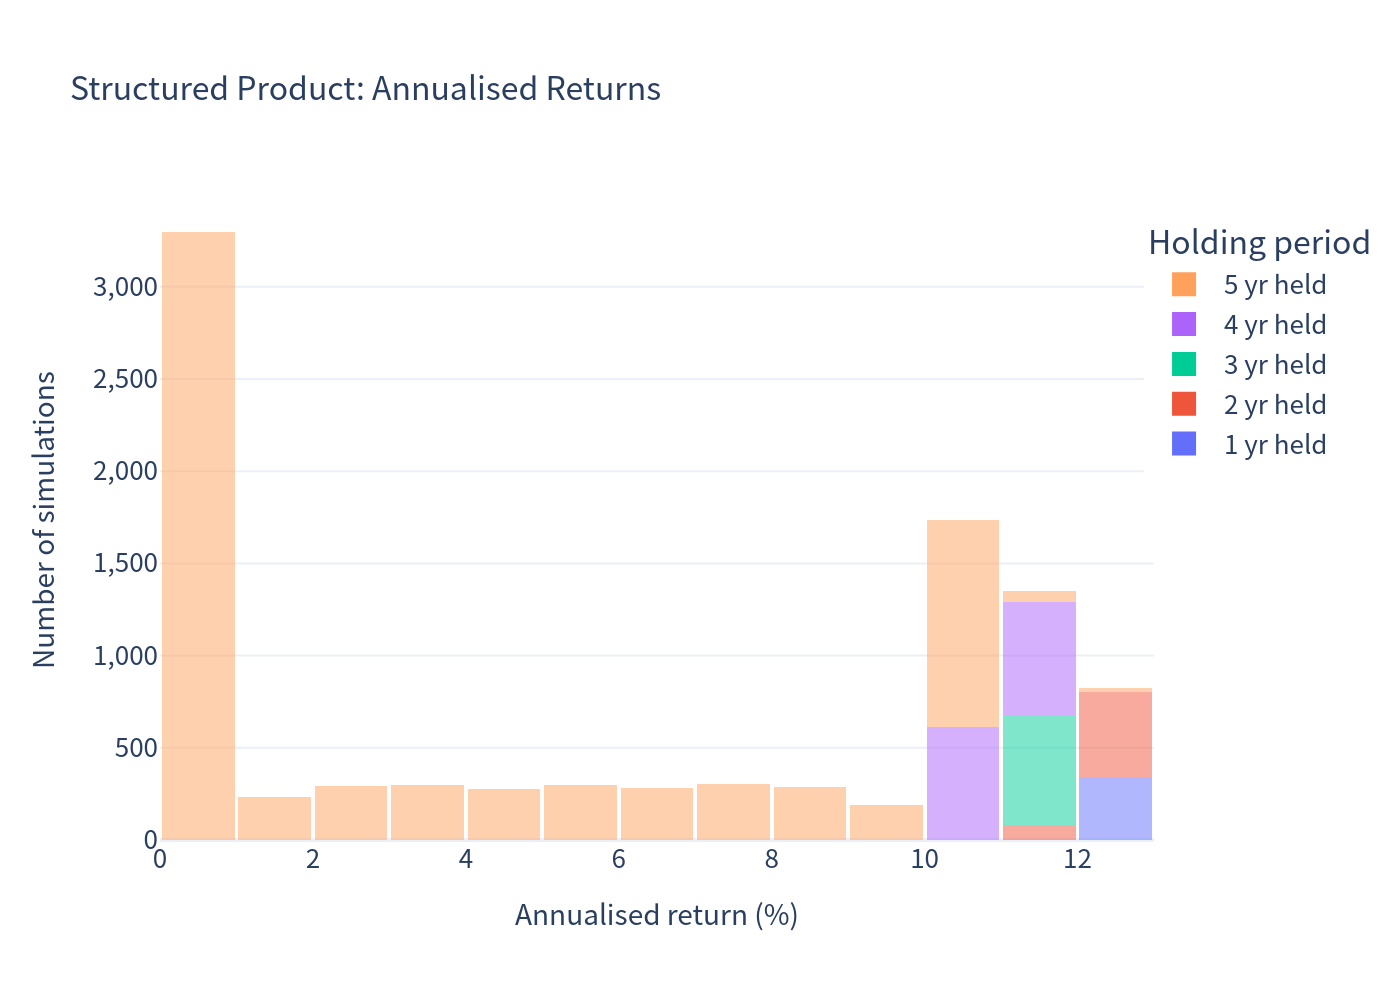
The product's distribution is tightly compressed between 0% and ~13% with a large mass at exactly 0%.
Scenario probabilities
Risk / Return
Annualised return — box plot
Holding-period distribution
Investment Commentary
- Capital protection that actually holds: every simulated path returns at least par — there is no loss scenario in the model, and the probability of loss is 0%.
- Convex, leveraged upside: 125% participation in the worst-of index adds return when all three indices finish higher.
- Low volatility of outcomes (≈5% vs ≈14% for the basket) and a positive spread over cash — beating the risk-free rate in roughly three out of five scenarios.
- Worst-of linkage is priced in: the step-up schedule (~13%/yr if called) provides a meaningful return even when the participation feature does not trigger.
- The protection is expensive: the expected annualised return (6.21%) is roughly half the underlying basket's total return (12.69%). Much of the upside is given up for the floor.
- Large probability of a zero return: ~30% of scenarios end with principal only — a 0% nominal return over as much as five years, i.e. a real (inflation-adjusted) loss and a large opportunity cost.
- Long, uncertain holding period: the notes stay outstanding for the full 5 years in ~60% of scenarios, and at least ~4.5 years in ~70% (expected holding ≈ 4.33 years).
- Upside is capped by the issuer's call: strong early rallies are redeemed at the fixed schedule (~13%/yr) rather than letting the 125% participation compound.
- Worst-of construction: return hinges on the weakest of three indices; a single laggard (e.g. a weak small-cap run) can keep the payout at principal even if the other two rally.
- Issuer credit exposure: payments depend on Morgan Stanley's ability to pay.
All figures are in USD and expressed in annualised terms unless stated otherwise. Results are forward-looking model estimates, not guarantees.