
Structured Product Evaluation Report
30% p.a. Multi Barrier Reverse Convertible on ams-OSRAM, Idorsia, VAT Group
ISIN: CH1571732143 | Issuer: Leonteq Securities AG
Headline Results
Basic Product Information
How It Works
This is a Multi Barrier Reverse Convertible linked to three Swiss stocks (ams-OSRAM AG, Idorsia Ltd, VAT Group AG). It pays a fixed coupon of 30% p.a. (7.5% quarterly) regardless of underlying performance, as long as the product is outstanding.
Key Mechanisms:
- Coupon Payments: The investor receives CHF 75 per CHF 1,000 denomination quarterly (30% p.a. total).
- Issuer Callable: The issuer has the right to call (redeem early) the product on specified observation dates (6 months and 9 months). Based on our simulation model, the issuer calls the product if no barrier event has occurred, which happens in 99.1% of scenarios at the first call date (6 months).
- Barrier Protection: A barrier event occurs if any of the three underlyings trades at or below 49% of its initial level at any time during the 1-year observation period.
- Maturity Redemption:
- If no barrier event: Investor receives 100% of the denomination (par)
- If barrier event occurred AND worst performer < 100% of initial: Investor receives physical shares of the worst-performing underlying (worth less than par)
- If barrier event occurred AND worst performer ≥ 100%: Investor receives par
| Parameter | Value |
|---|---|
| Coupon Rate | 30.00% p.a. (7.5% quarterly) |
| Barrier Level | 49% of Initial |
| Strike Level | 100% of Initial |
| Barrier Observation | Continuous (entire lifetime) |
| Maturity | 12 months |
| Early Redemption | Issuer callable at 6 and 9 months |
Simulation Statistics
Underlyings Overview
| Underlying | Annualized Volatility | Latest Price (CHF) |
|---|---|---|
| ams-OSRAM AG (AMS.SW) | 55.83% | 17.09 |
| Idorsia Ltd (IDIA.SW) | 66.46% | 6.17 |
| VAT Group AG (VACN.SW) | 35.47% | 647.60 |
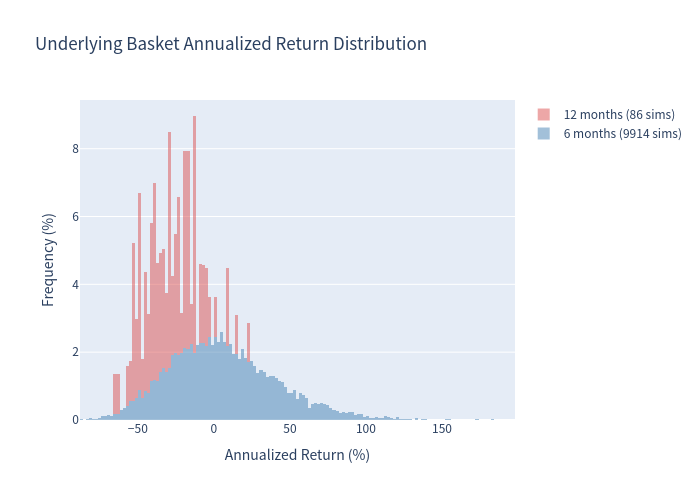
The three underlyings are highly volatile Swiss equities. The benchmark used for comparison is an equal-weight basket of the three underlyings with an estimated dividend yield of 2.41% (based on SMI ETF dividend yield).
Key Statistics Comparison
| Metric | Structured Product | Benchmark Basket (w/ div) |
|---|---|---|
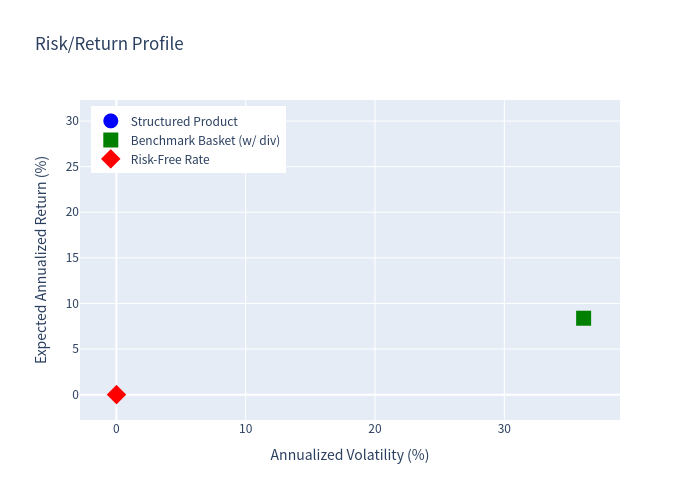
| Expected Annualized Return | 29.53% | 8.38% |
| Annualized Volatility | 5.18% | 36.13% |
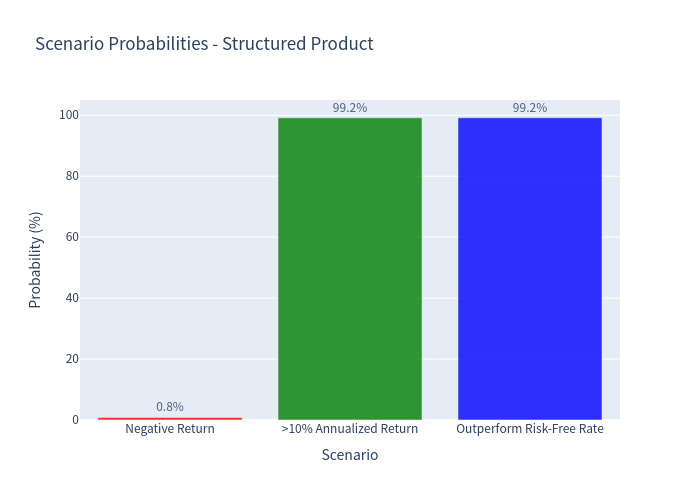
| Probability of Loss | 0.83% | 44.14% |
| 99% VaR (1-year) | 30.00% | -60.53% |
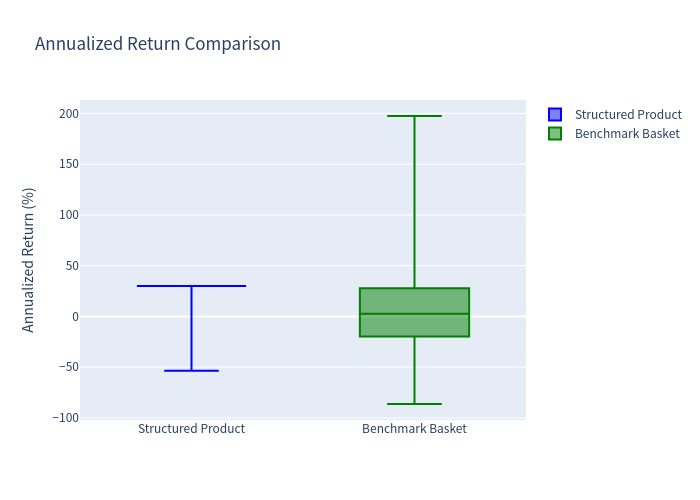
| Worst-Case Return | -53.49% | -86.18% |
Holding Period Distribution
| Holding Period | Probability |
|---|---|
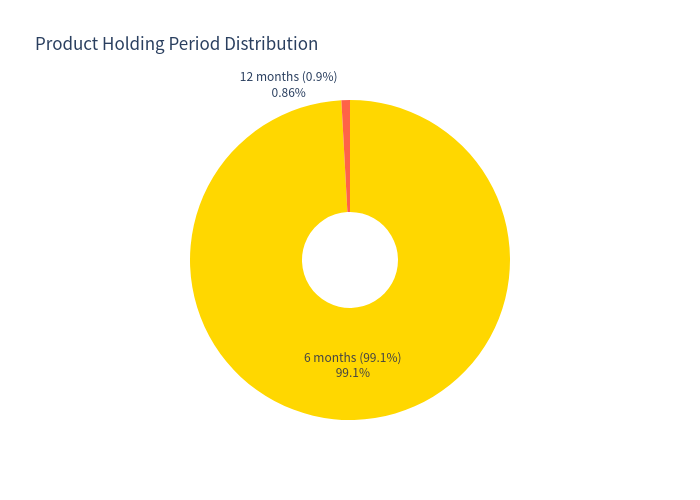
| 6 months (Early Redemption) | 99.14% |
| 12 months (Maturity) | 0.86% |
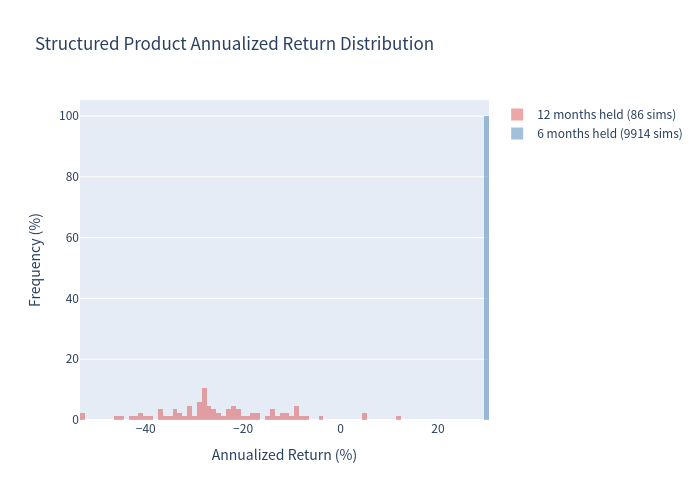
The product is overwhelmingly expected to be called at the first early redemption date (6 months), as the issuer calls when no barrier event has occurred. Only in 0.86% of scenarios (where a barrier event occurs early) does the product run to full maturity.
Coupon Distribution
| Number of Coupons | Probability |
|---|---|
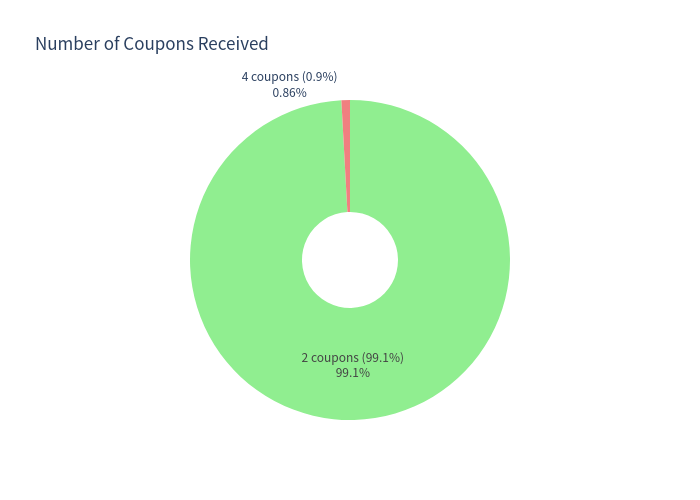
| 2 coupons (CHF 150) | 99.14% |
| 4 coupons (CHF 300) | 0.86% |
Conditional Returns by Holding Period
| Holding Period | Share | Avg Total Return | Avg Annualized Return |
|---|---|---|---|
| 6 months | 99.14% | 15.00% | 30.00% |
| 12 months | 0.86% | -24.71% | -24.71% |
Charts
Return Scatter Plot
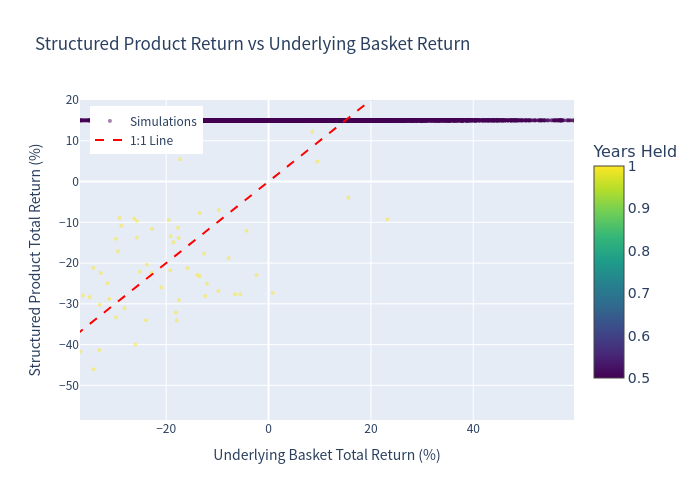
Each point represents one simulation. The horizontal line at 15% shows the fixed coupon return for most (early redeemed) scenarios. The vertical spread below shows the tail-risk scenarios where the product runs to maturity with losses.
Annualized Return Histograms
Structured Product:
Underlying Basket:
Scenario Probability
Risk/Return Profile
Box Plot Comparison
Holding Period Distribution
Coupon Distribution
Investment Commentary
Key Strengths
- High coupon rate: The 30% p.a. coupon is significantly higher than the risk-free rate (near 0% in CHF) and the expected return of the underlying basket.
- Downside protection: The 49% barrier provides a substantial cushion against market declines.
- Low probability of loss: Only 0.83% of simulated scenarios result in a negative annualized return.
- Short expected holding period: The product is likely to be called at 6 months, providing a quick 15% total return.
Key Risks
- Tail risk of significant loss: In the ~0.9% of scenarios where the barrier is breached and the worst performer declines below strike, investors can lose up to 53.5% of their capital.
- Concentration risk: All three underlyings are Swiss small/mid-cap equities with high individual volatility.
- Worst-of structure: The redemption at maturity depends on the worst-performing underlying.
- Issuer credit risk: The product is an unsecured obligation of Leonteq Securities AG (Fitch BBB-).
- Early redemption risk: The issuer controls the call decision; investors cannot rely on the full 12-month coupon stream.
Important Notes
- The expected annualized return of 29.53% appears very high because most scenarios result in a 15% return over just 6 months (annualizing to ~30%).
- For the 0.86% of scenarios that go to maturity, the average total return is -24.71%, highlighting the severe tail risk.
- The 99% VaR of 30.00% reflects that 99% of scenarios have at least 30% annualized return, but this masks the extreme losses in the worst 0.17% of cases (-53.49% worst case).
- Dividend yields were estimated based on the SMI ETF (2.41%) as a proxy for the underlying Swiss stocks.
This report is based on Monte Carlo simulation using GJR-GARCH(1,1) model with historical data. Past performance is not indicative of future results. This analysis is for informational purposes only and does not constitute investment advice.