
10.00% p.a. Multi Barrier Reverse Convertible
on Alcon, Novartis & Straumann
ISIN CH1593777985 · CHF 1,000 Denomination · Final Fixing 09/03/2028 · Issuer-callable
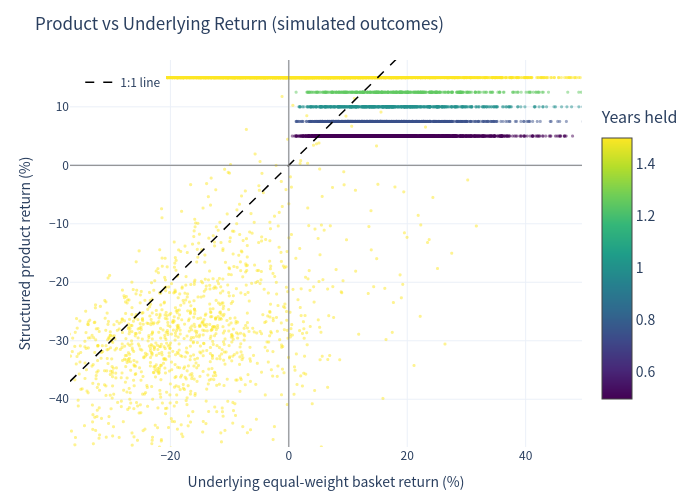
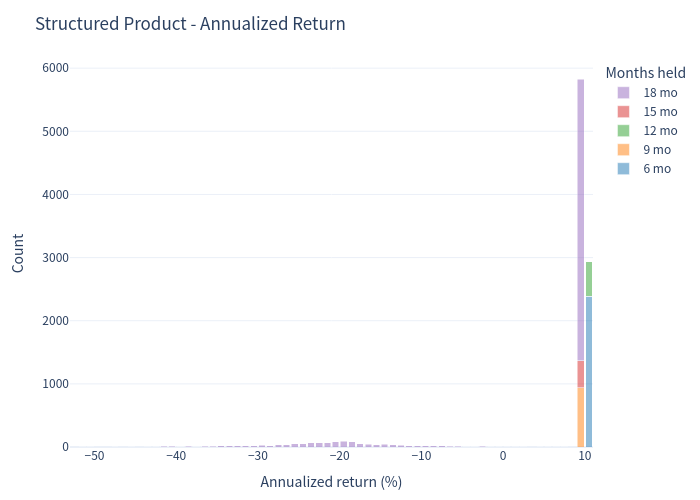
The product pays a 10.00% p.a. coupon (CHF 25 per quarter on CHF 1,000) regardless of underlying performance. In the simulation, 44.60% of paths delivered the maximum +15.00% total return (par at maturity + all six coupons), and a further 43.01% ended via early issuer call at +5.00% to +12.50% (two to five coupons). 56.99% of paths ran the full 18 months to maturity, of which 12.39% of all paths ended in physical delivery of the worst-performing share (redemption below par); the resulting overall capital-loss probability was 12.19% (worst simulated path −66.06%).
A 1.5-year, CHF-denominated, issuer-callable barrier reverse convertible referencing the worst performance of three Swiss healthcare stocks — Alcon, Novartis and Straumann — with a 10.00% p.a. coupon paid quarterly and a barrier at 59% of each initial fixing level.
- You invest CHF 1,000 and receive CHF 25 every 3 months (10% p.a.) — paid regardless of how the shares perform.
- If none of the three shares ever falls below 59% of its starting level during the product's life, you get your full CHF 1,000 back at maturity (15/03/2028).
- If any share ever trades at/below 59% of its start (a "barrier event"), then at maturity the outcome depends on the worst performer:
- worst share still at or above its start (100%) → you still get CHF 1,000 back; or
- worst share below its start → you receive shares of that worst performer (value < CHF 1,000) instead of cash — this is where capital loss occurs.
- The Issuer may call the product early at quarterly observation dates (from month 6). If called, you receive CHF 1,000 + the coupon for that period and no further coupons. (Simulation applies a transparent assumption that the Issuer calls when all three underlyings close at/above their start level on an observation date.)
- Coupon: 10.00% p.a. → 2.50 index points per quarter; max 6 coupons = 15.00 index points on a 100 notional.
- Downside protection: ~41% barrier (59% of initial fixing); continuous barrier observation over the full life.
- Upside is capped — no participation beyond the fixed coupon; worst-of delivery risk at maturity.
- Early redemption (issuer call) possible at months 6, 9, 12, 15.
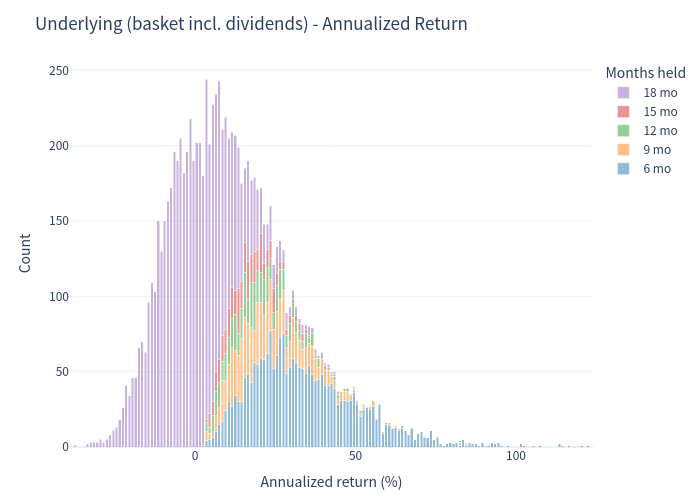
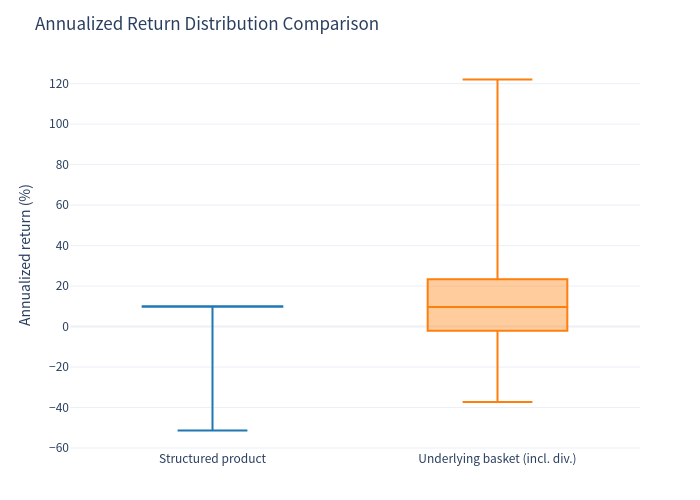
Benchmark = equal-weight basket of the three underlyings. Underlying figures are total returns including ~1.44% average dividend yield; product figures include coupon income. Returns are annualized over each path's realized holding period.
| Metric | Structured Product | Underlying basket (total return incl. div.) |
|---|---|---|
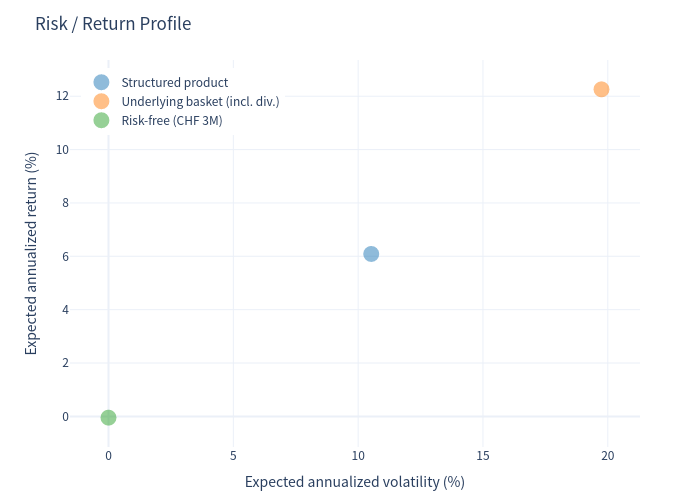
| Expected annualized return | 6.09% | 12.26% * |
| Expected annualized volatility | 10.52% | 19.75% |
| Probability of loss (total return < 0) | 12.19% | 29.16% |
| 99% VaR (1-year annualized) | −33.00% | −22.01% |
| Expected total return over realized horizon | 6.07% | 8.01% |
* The basket's annualized figure is lifted by short (6–9 month) holding paths in which the product is called after strong rallies (linear annualization of short periods). On a matched-horizon total-return basis the basket returned ~8.01% (incl. dividends) versus 6.07% for the product — the product gives up upside for downside protection and roughly half the volatility.
Outcome Scatter (Product vs. Underlying return, colored by years held)
Annualized Return Distributions (1% bins, stacked by months held)
Underlying basket (total return incl. dividends) — left; Structured product — right.
Risk / Return Profile & Distribution Comparison
Scenario Probabilities & Holding / Coupon Outcomes
- The product delivered a positive expected annualized return of 6.09% with roughly half the volatility of the underlying basket (10.52% vs 19.75%).
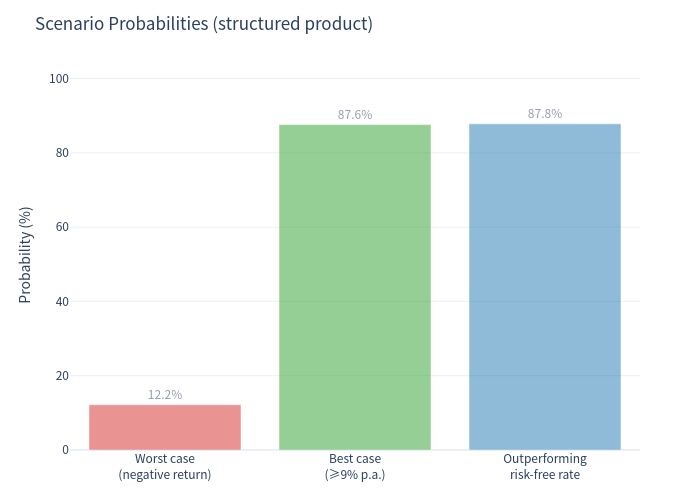
- 87.82% of simulated paths beat the (≈0%) CHF risk-free rate, and 87.61% captured essentially the full annual coupon (≥9% p.a.). The coupon is paid "in any case" while the product is alive — the main determinant of total return is how long the product stays alive and whether a barrier event + weak final worst performer occurs.
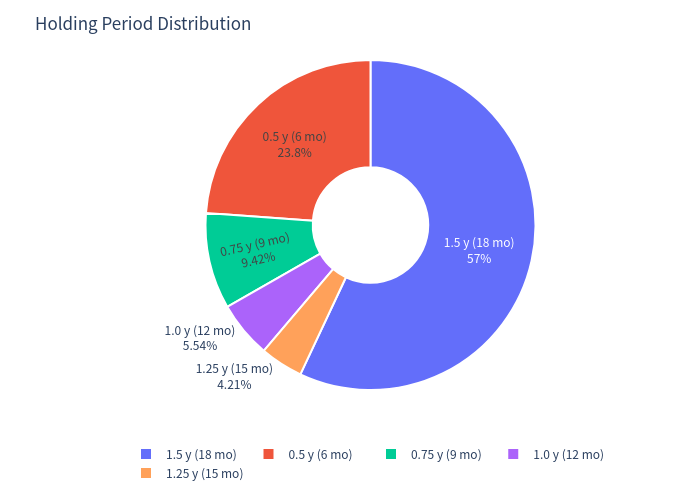
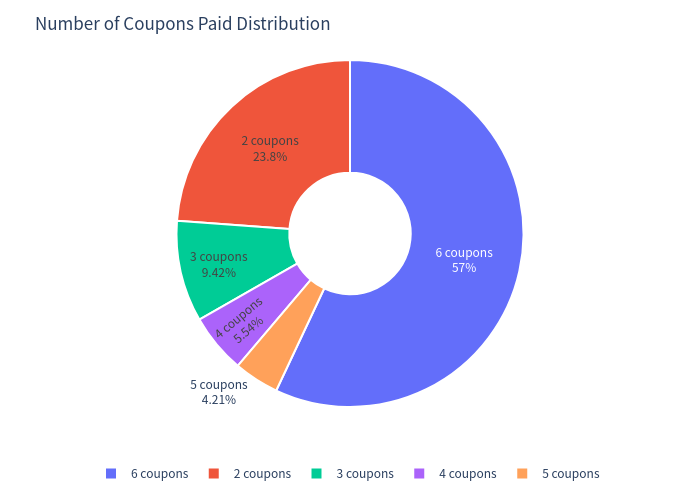
- Holding period varies: 56.99% of paths ran the full 18 months (six coupons); the remaining 43.01% were called early after healthy rallies — 23.84% at month 6 (two coupons), 9.42% at month 9, 5.54% at month 12 and 4.21% at month 15. Because short holdings are annualized linearly, a +5.00% six-month return reads as ~10% annualized; it is best to read total return and holding period together.
- Downside is concentrated at maturity: 13.10% of paths saw a barrier event and 12.39% ended in physical delivery (redemption below par); however, thanks to the accumulated coupons, only 12.19% resulted in an overall capital loss (in the few delivery cases where the worst share closed between ~85% and 100%, total return stayed positive). Average loss in losing paths was −29.61% and the 99% VaR was −33.00% (1-yr annualized). If the Issuer never exercised its call, expected total return would rise to 9.25% over the full 18 months (annualized 5.79%, loss probability 12.88%) — the issuer call mainly trims coupon income in healthy markets rather than changing the tail-loss profile.
- Attractive 10.00% p.a. quarterly coupon — very high versus near-zero CHF money-market rates.
- Generous ~41% barrier cushion (59% barrier) before any capital-at-risk scenario is activated.
- Coupons are paid irrespective of underlying performance; if the barrier is never breached and the product is not called early, the outcome is par + all coupons (+15.00% total).
- Clearly lower volatility than holding the three shares directly, with a much lower probability of loss (12.19% vs 29.16% for the basket incl. dividends).
- The structure caps upside: in strongly rising markets the investor still only receives the fixed coupons, and an early issuer call can shorten the coupon stream (product terminated at par + current coupon).
- Capital loss requires BOTH a barrier breach (any share ≤59% intraday) AND the worst performer finishing below ~85% of its start at maturity after accounting for coupons — losses can be severe (worst simulated path −66.06% total) because the investor receives depreciated shares.
- As a debt instrument, the product also carries issuer credit risk (Leonteq Securities AG, Guernsey Branch).