
Structured Product Analysis — 9.00% p.a. Multi Barrier Reverse Convertible (Callable)
Headline Simulation Results
mean of per-path CAGR
| Metric | Value |
|---|---|
| Expected annualized return (mean of per-path CAGR) | 4.07% |
| Median annualized return | 8.81% |
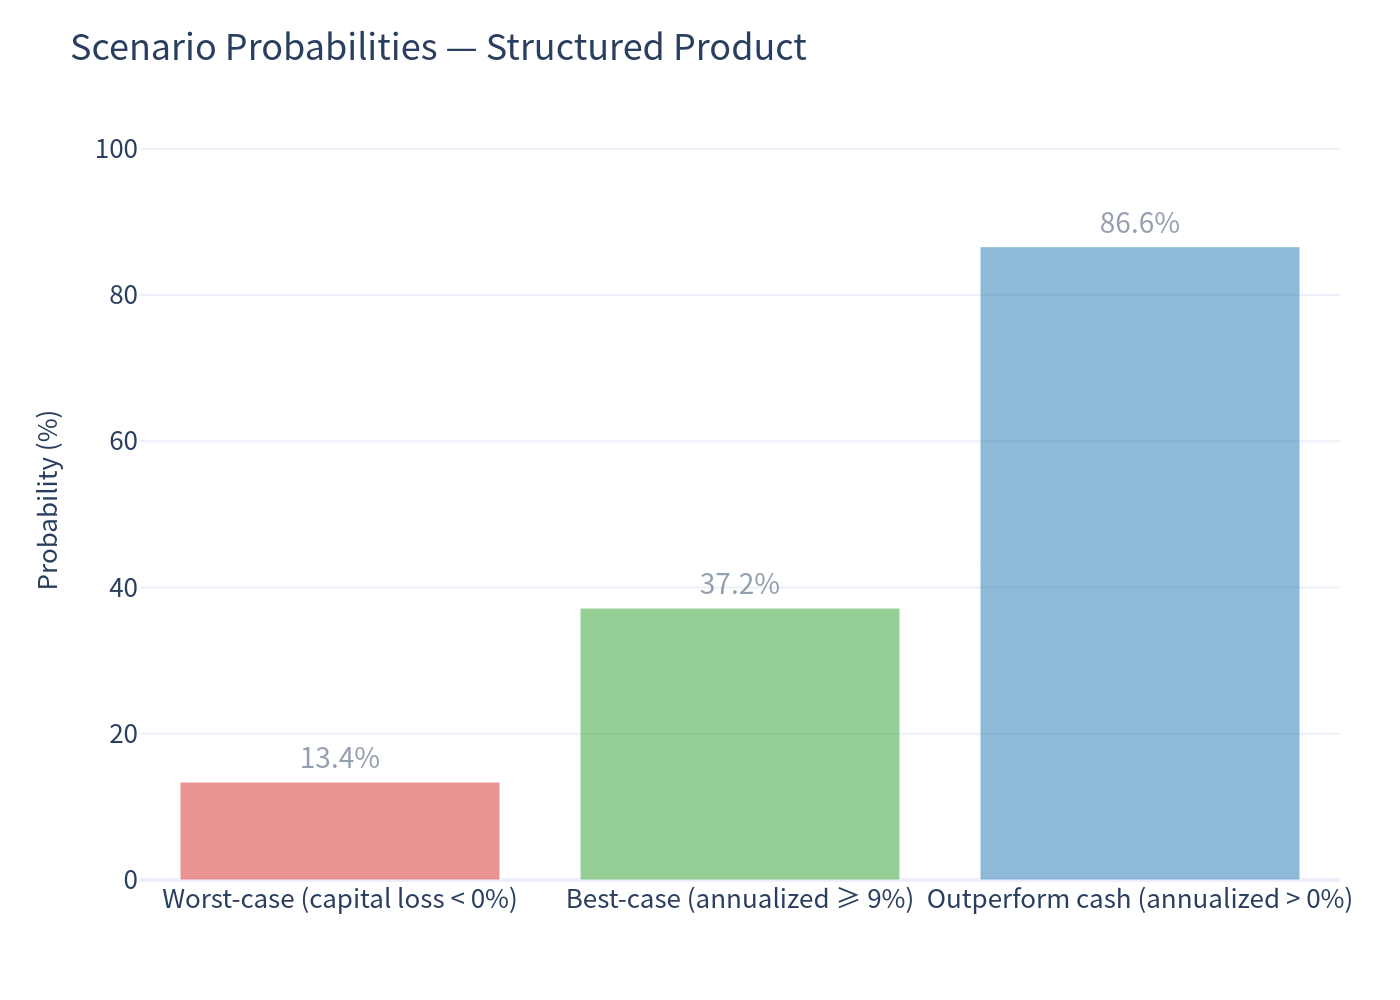
| Probability of a negative return | 13.40% |
| 99% confidence VaR (1-year) | -38.43% |
| Expected total return over realized holding period | 3.66% |
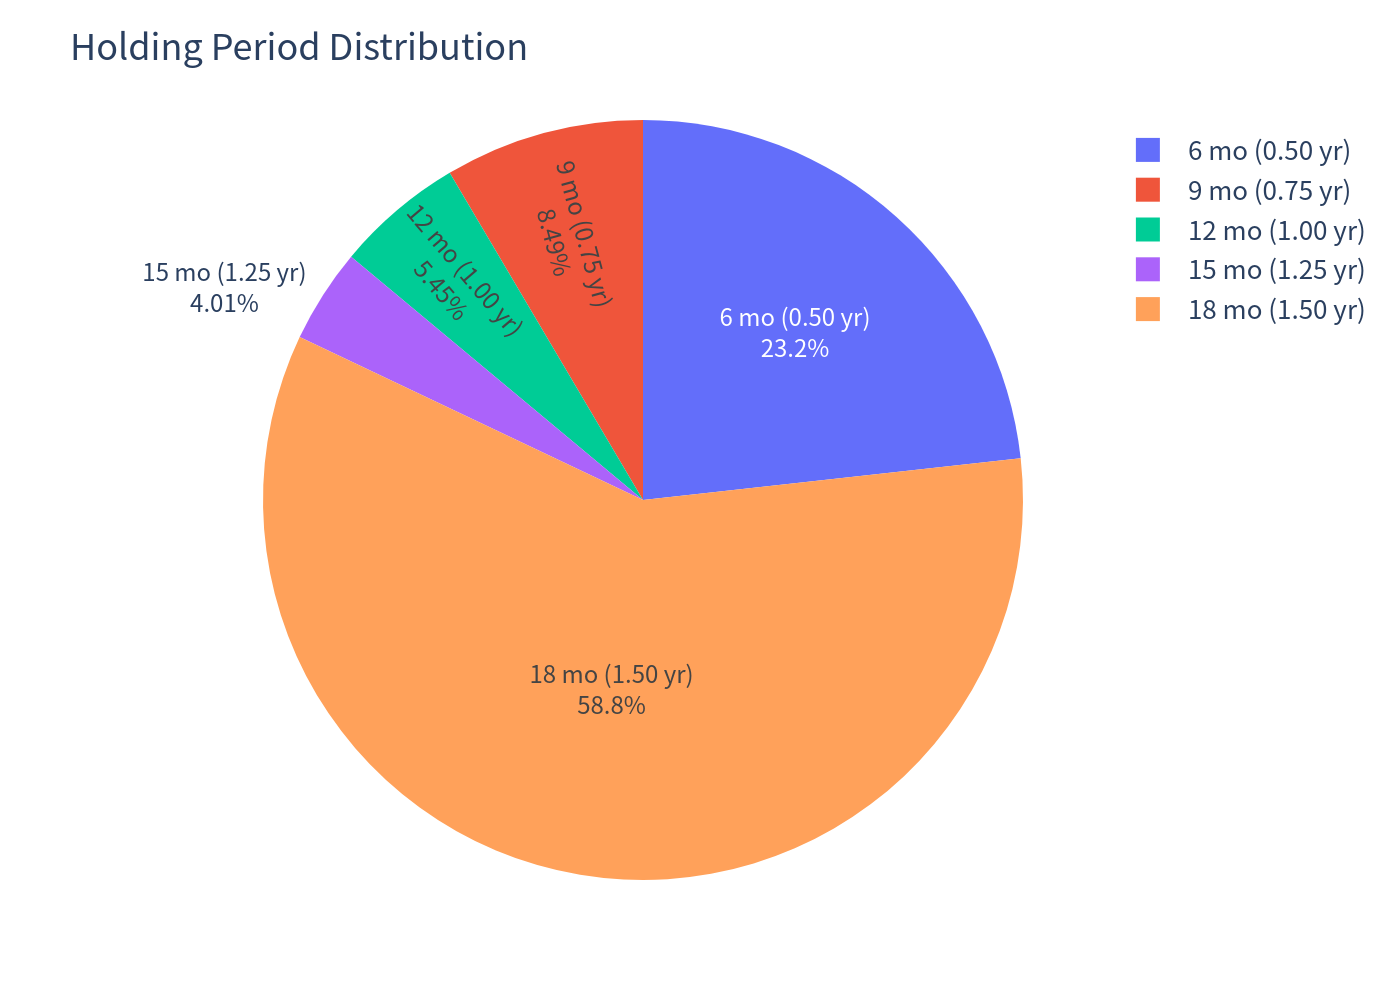
| Expected holding period | 14.0 months |
| Expected annualized volatility | 12.61% |
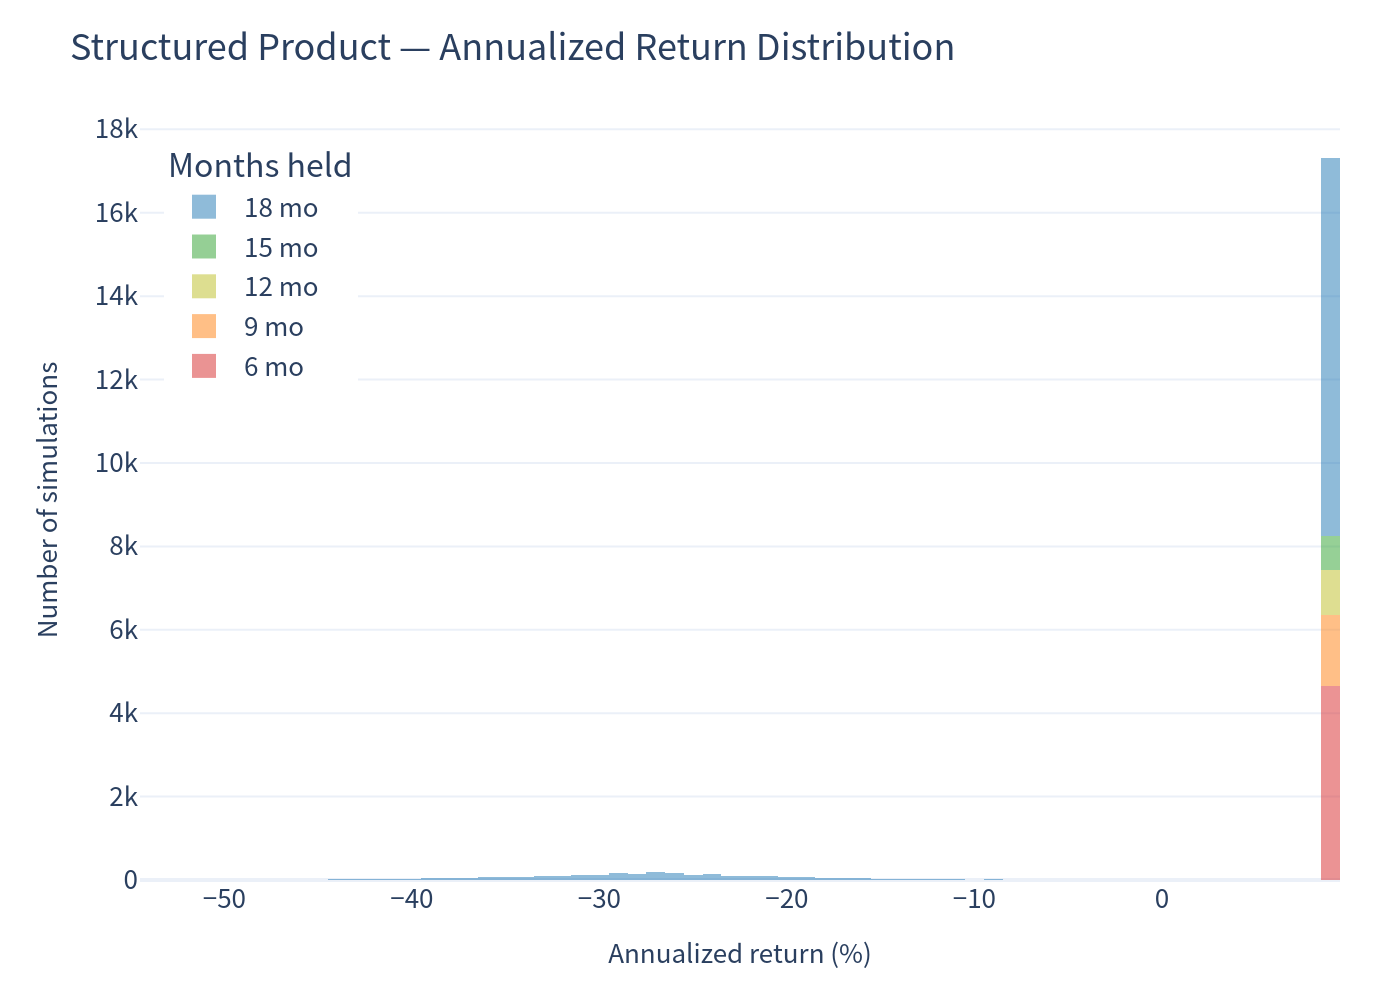
Reading the numbers: In the large majority of paths the note delivers the full coupon (median annualized ≈ 8.8%). The mean (4.07%) is pulled well below the median because the payoff is negatively skewed: about 13.4% of paths lose capital (average annualized ≈ -27.1%), the worst reaching a final value of 31 (a −69% total loss). Losses, total return and holding period should be read together — the note is a high-probability income profile with an occasional large hit.
How the Product Works (in plain terms)
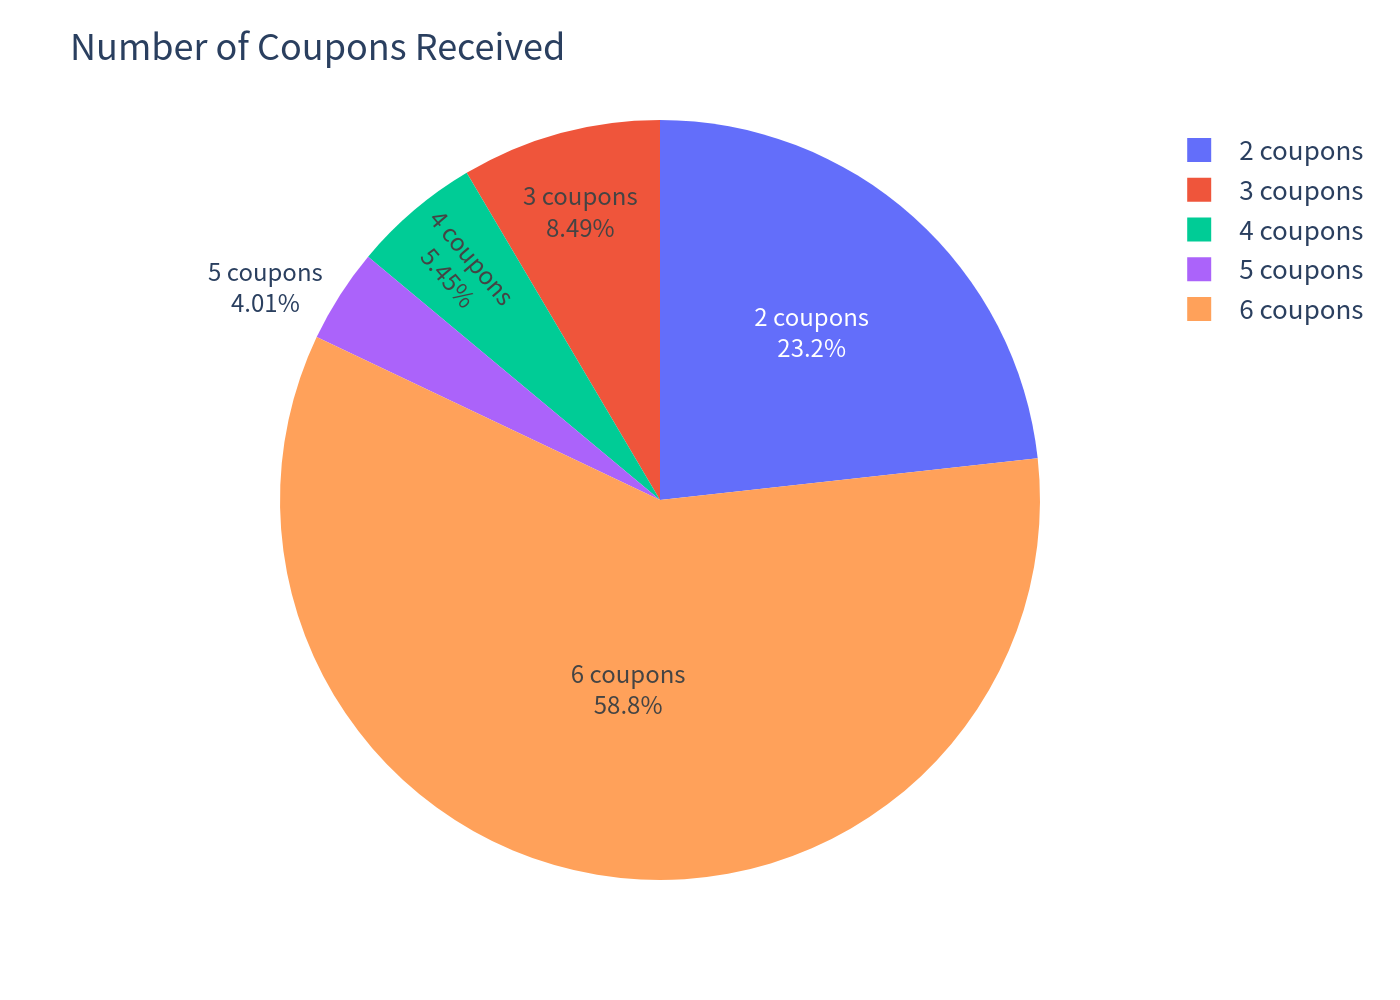
- You buy a bond-like note at par (100) that pays a fixed 9.00% p.a. coupon (2.25% per quarter, 6 coupons) — paid even if the shares fall.
- In return you sell downside protection on the worst-performing of the three shares. As long as no share ever trades below 49% of its starting level (the barrier), you get your 100 back at maturity plus all coupons.
- If the barrier is breached (any one share falls ≥51% at any time over the 18-month life) and the worst share finishes below its start, you receive that worst share's loss (physical delivery / cash equivalent). This is the source of the fat left tail.
- The issuer can call the note on four quarterly dates (2027–2028). When called, you receive par plus that period's coupon and the note ends. Upside is capped — you never receive more than par plus coupons.
Because the payout is on the worst-of three shares, the effective downside is more fragile than a basket: a single weak name can trigger the loss even if the other two are flat or up.
Key Statistics: Product vs. Buy-and-Hold Benchmark
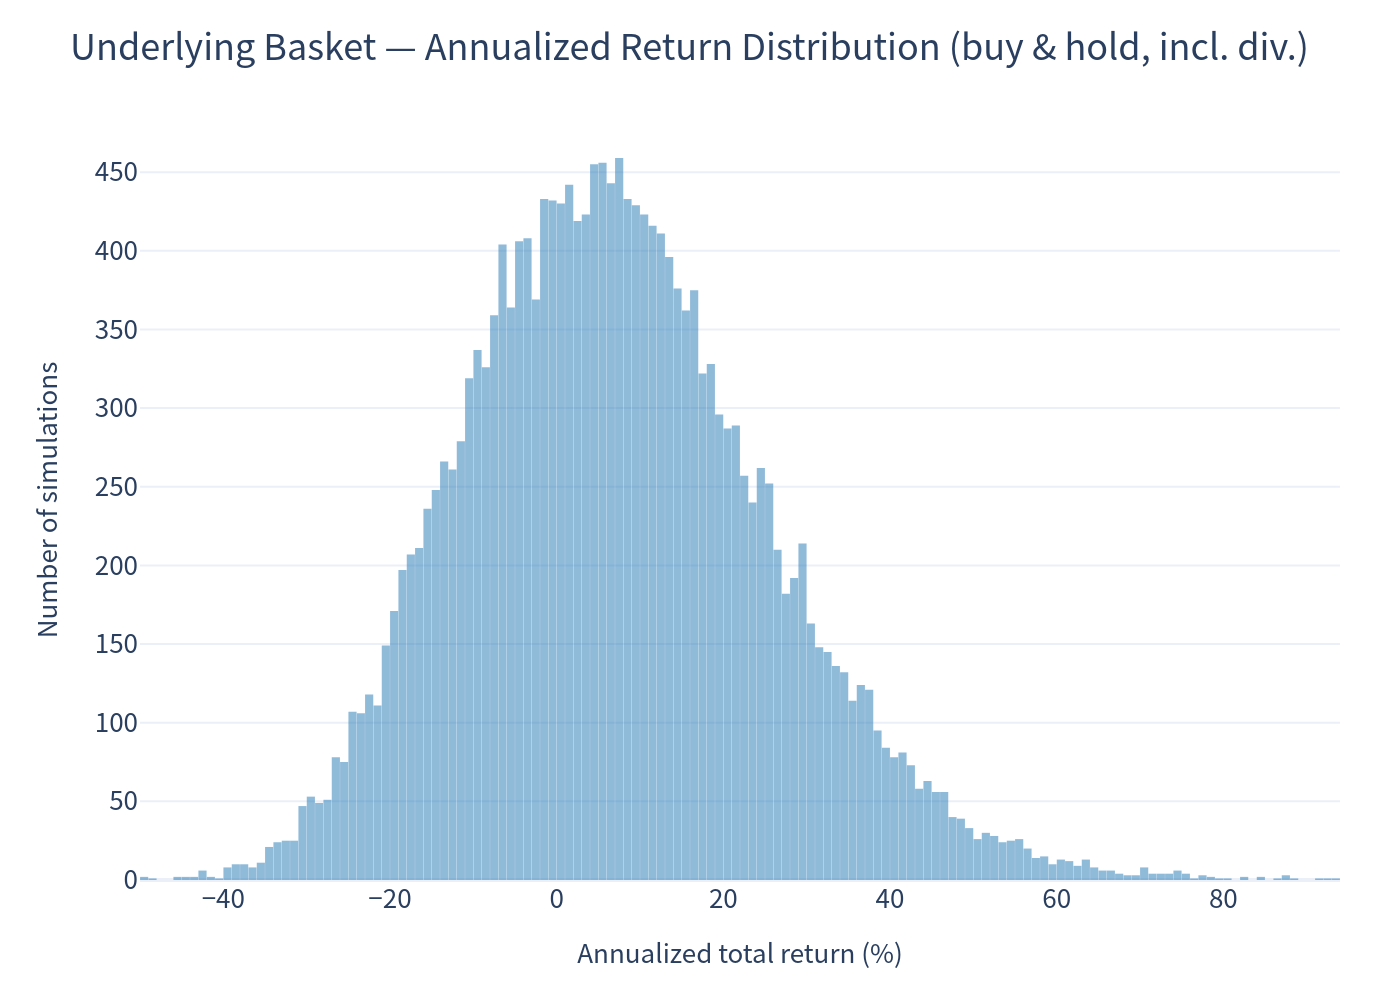
The benchmark is an equal-weight, buy-and-hold basket of the three shares over the note's full 18-month term, with an assumed dividend yield ≈ 1.94% p.a. included in its total return.
| Metric | Structured Product | Benchmark (EW basket, total) |
|---|---|---|
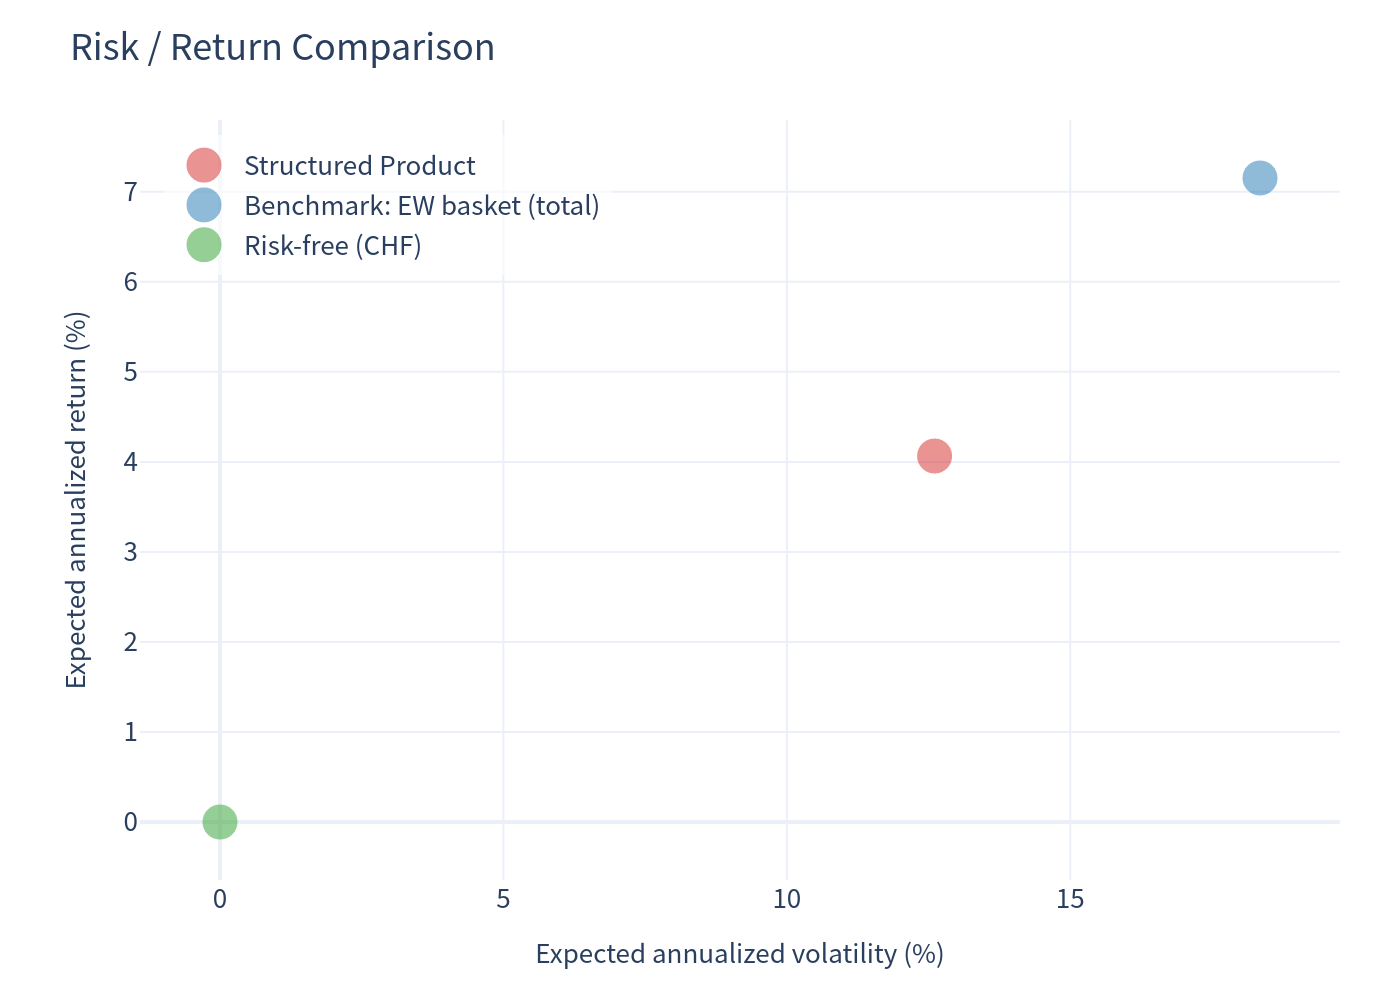
| Expected annualized return | 4.07% | 7.15% |
| Expected annualized volatility | 12.61% | 18.35% |
| Probability of loss | 13.40% | 36.69% |
| 99% VaR (1-year) | -38.43% | -30.13% |
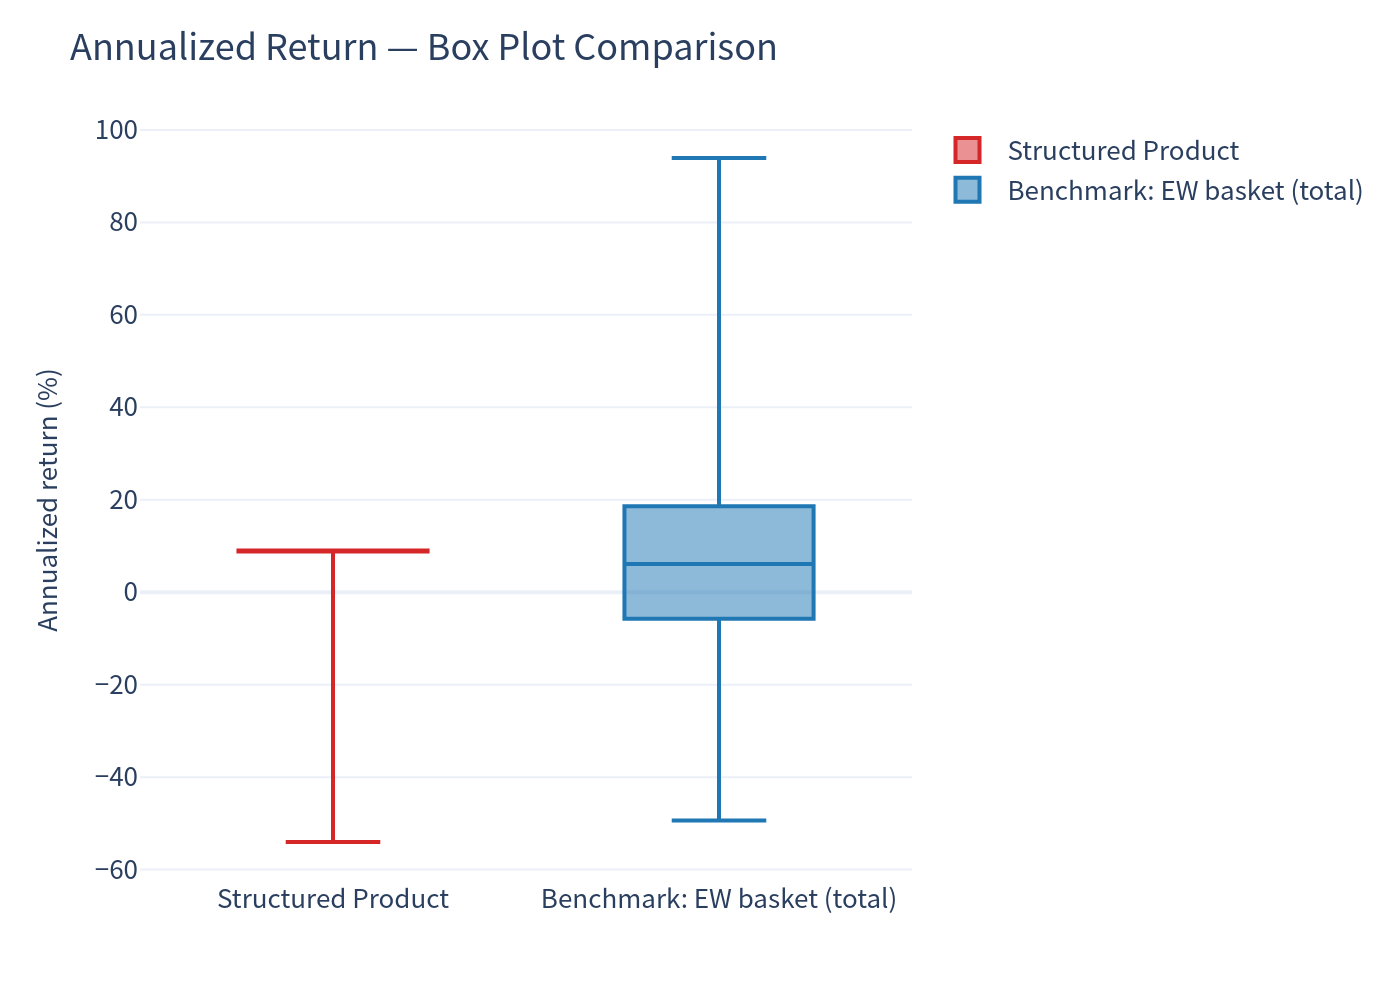
Interpretation. The note trades a lower expected return (4.07% vs 7.15%) and much lower volatility (12.6% vs 18.3%) for a higher win rate (86.6% of paths avoid any loss, versus 63.3% for the basket) — but a worse tail: the 1% worst annualized outcome (-38.4%) is more severe than the basket's (-30.1%). Typical reverse-convertible shape: many small coupon gains, rare large losses.
Charts
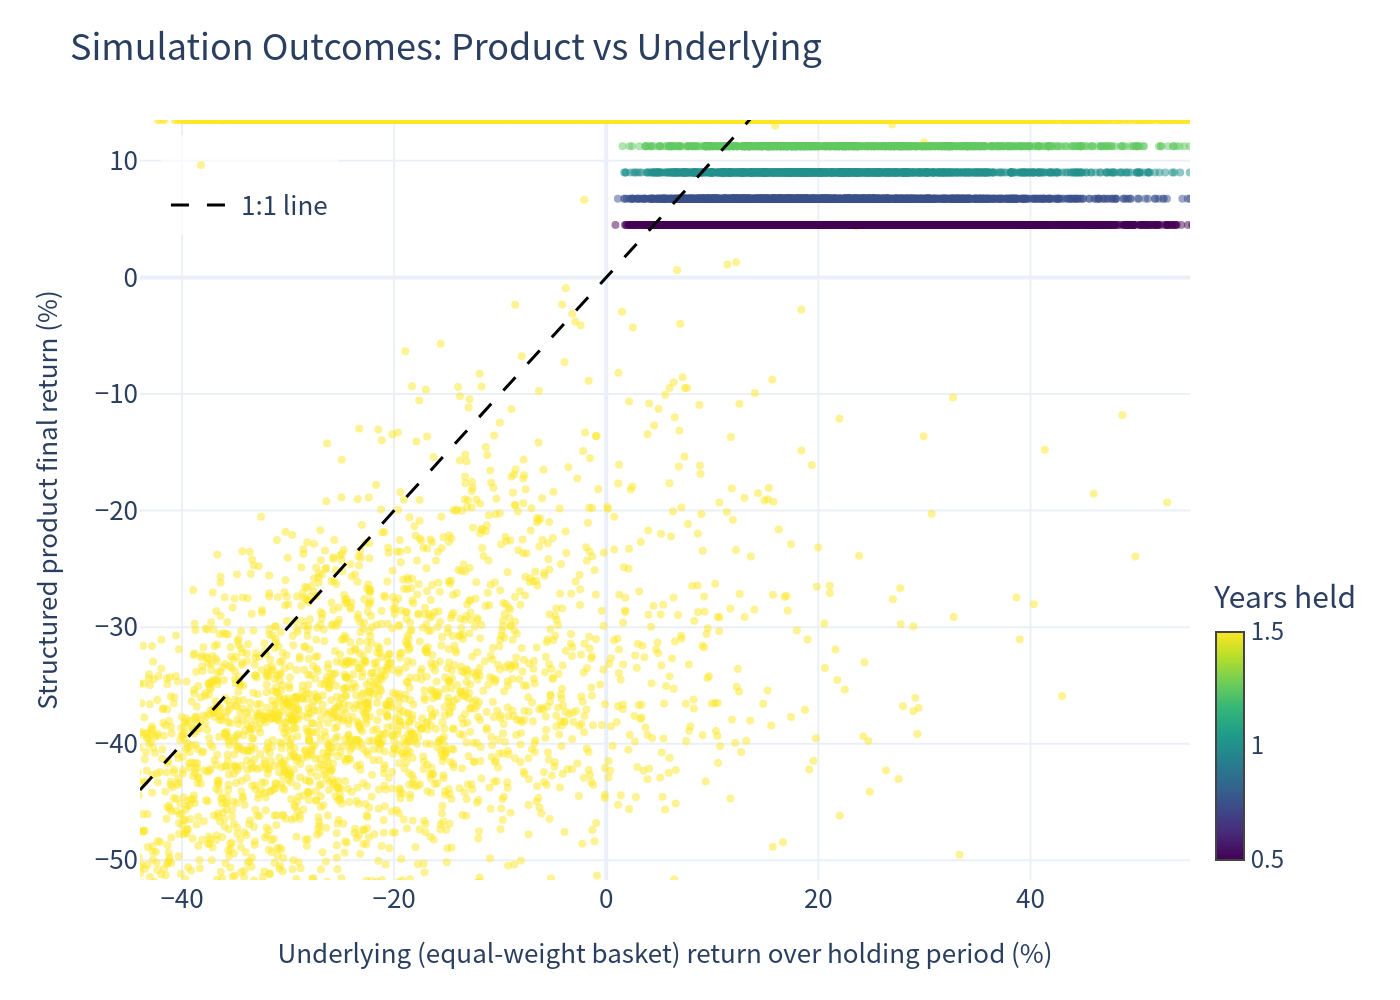
1 — Simulation outcomes (product vs underlying, 1:1 line)
Each point is one path; colour = years held. Note how product returns cap out near +9–14% even as the underlying rallies strongly (upside cap), while sitting below the 1:1 line when the basket falls (worst-of downside).
2 — Risk / return comparison
3 — Annualized return distribution: product (stacked by holding period)
4 — Annualized return distribution: underlying basket
5 — Box plot: annualized return
6 — Scenario probabilities
Worst-case = capital loss; best-case = full-coupon-max outcome (annualized ≥ 9%); outperform cash = annualized > CHF risk-free (~0%).
7 — Holding period distribution
Issuer call vs. held to maturity.
8 — Number of coupons received
Investment Commentary
Strengths
- Attractive, unconditional income: a 9.00% p.a. headline coupon that is paid on every scheduled date regardless of market direction or a barrier breach.
- Wide 49% barrier on each share — each name can fall up to 51% from its start before the loss mechanism is armed.
- High probability of a good outcome: ≈ 86.6% of simulated paths return capital intact (no loss) and ≈ 86.6% beat a near-zero CHF cash rate; ≈ 37.2% earn the full-coupon outcome.
- Low day-to-day volatility (≈ 12.6%) versus holding the shares directly (≈ 18.3%), useful for investors who value a smoother ride and a defined income stream.
Trade-offs to weigh
- Capped upside: maximum annualized return is ≈ 9.0%; you give up all equity upside above par.
- Worst-of downside / negative skew: the ~13.4% loss scenarios are severe (worst path final value 31, i.e. a −69% loss) and the 1-year 99% VaR (-38.4%) is worse than simply holding the basket (-30.1%). A single underperforming name drives the result.
- Issuer call risk: ≈ 41.2% of paths are called early on one of the four observation dates, truncating the coupon stream — reinvestment risk if market conditions change.
- Credit exposure to the issuer/guarantor, and no equity participation in a rising market.
This is a quantitative illustration of the payoff under simulated market paths and is not investment advice or a suitability assessment.