
Structured Product Analysis
Headline Simulation Results
| Metric | Value |
|---|---|
| Expected annualized return | 9.80% |
| Probability of a negative return | 12.30% |
| 99% confidence VaR (1-year) | −43.83% |
| Expected holding period | 9.70 months (≈ 0.81 years) |
The product behaves like a high-yield bond with an equity trap-door. In roughly 87.6% of simulated paths the investor earns the coupon at the full 15.5% annualized rate — whether the note runs the full 12 months (four quarterly coupons) or is redeemed early at ~month 6 / ~month 9 (the same 15.5% annualized return delivered over a shorter period) — and gets the principal back. In the remaining ~12.3% of paths at least one bank breaches its 55% barrier and the worst-performing share ends deeply depressed (median final level ≈ 54% of its start); the note then converts into that worst share and the investor suffers a net capital loss that the accumulated coupons cannot fully offset. The ~15.5% coupon is therefore earned with a ~1-in-8 chance of a large capital loss, which pulls the expected annualized return down to 9.80%.
Product at a Glance
| Feature | Detail |
|---|---|
| Type | Callable Multi Barrier Reverse Convertible (Yield-Enhancement) |
| ISIN / Symbol | CH1607597551 / AIIXTQ (SIX Swiss Exchange) |
| Issuer | Leonteq Securities AG, Guernsey Branch (Fitch BBB−) |
| Currency / Denomination | EUR / EUR 1,000 per note |
| Coupon | 15.50% p.a. (EUR 38.75 per quarter, paid quarterly) |
| Underlyings (worst-of) | BNP Paribas, Commerzbank AG, Société Générale |
| Barrier | 55% of initial level, continuously observed over the whole term |
| Strike | 100% of initial level |
| Callable | Issuer may redeem early on 2 dates (≈ month 6 and month 9) at par + coupon |
| Final Fixing / Redemption | 29/10/2027 / 04/11/2027 (≈ 12-month term) |
| Upside | Capped – investor earns only the fixed coupon |
Indicative dividend yields: BNP Paribas 7.55%, Commerzbank 3.03%, Société Générale 2.88% (equal-weight ≈ 4.49%).
How It Works (in plain terms)
- You are paid to take on bank downside risk. The note pays a fixed 15.5% p.a. coupon every quarter no matter what the share prices do in between.
- Protection unless the shares crash. As long as none of the three banks trades at or below 55% of its starting price at any moment during the year, you get your full principal (100%) back at maturity on top of the coupons.
- The trap-door. If any one bank touches its 55% barrier even once, protection disappears. At maturity you then receive the worst-performing of the three shares (in kind) if that share is below its starting level — so you wear the full downside of the weakest bank. If, despite the barrier breach, the worst share has recovered to at or above its start, you still get par.
- The issuer can call it early. On ~month 6 and ~month 9 the issuer may redeem you at par plus the coupon if it suits them (typically when the shares are doing well). If called, the note simply ends and your money is returned.
Because the payoff is driven by the worst of three strongly correlated European banks, the effective risk is concentrated: it only takes one weak performer to trigger the loss branch.
Key Statistics — Product vs. Benchmark
Benchmark = equal-weight basket of the three underlyings (the natural market alternative). Two benchmark views are shown: exit-timed (measured over each simulation's actual holding period, then annualized, consistent with the product's realized horizon) and buy-and-hold 12-month (unconditional long-only reference). Both "total return" columns add the 4.49% dividend yield.
| Metric | Structured Product | Benchmark — exit-timed (total) | Benchmark — buy & hold 12M (total) |
|---|---|---|---|
| Expected annualized return | 9.80% | 20.19% | 12.29% |
| Median annualized return | 15.50% | 16.18% | 8.20% |
| Expected annualized volatility | 15.54% | 38.39% | 31.79% |
| Probability of loss | 12.30% | 34.66% | 38.64% |
| 99% confidence VaR (1-year) | −43.83% | −44.19% | −44.20% |
| Return/risk ratio (mean − RF)/vol | 0.49 | 0.47 | 0.32 |
Reading the table: the product delivers a much smoother ride — only about 40–50% of the volatility and roughly one-third of the probability of loss of simply owning the basket. Its 99% VaR is essentially the same as the basket's, reflecting that when the trap-door opens the investor is fully exposed to the worst share. On a risk-adjusted basis (return per unit of volatility) the product is at least as attractive as holding the banks outright, and it clearly beats the buy-and-hold benchmark.
Charts
Simulation Outcomes — Product vs Underlying
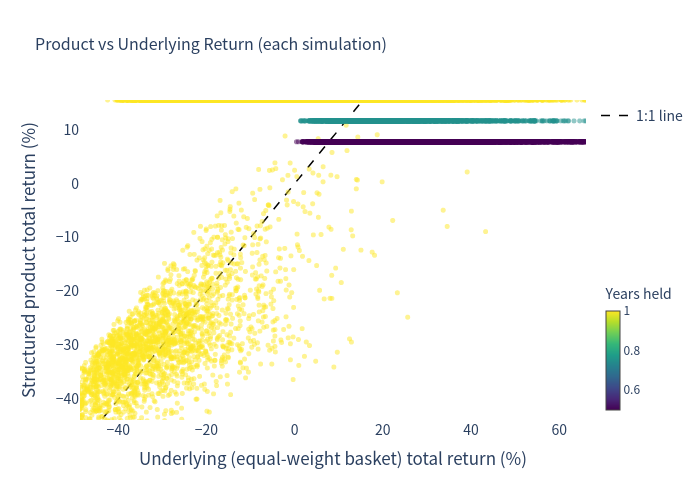
Simulation outcomes — product vs underlying (each dot = one path, coloured by holding period). The horizontal band at the top is the capped-coupon region (≈ +15.5% total over 12 months, less when called early); the diagonal cloud below shows paths where the barrier opened the downside and the product tracks the worst-of basket almost 1-for-1.
Underlying (Basket) Annualized Return Distribution
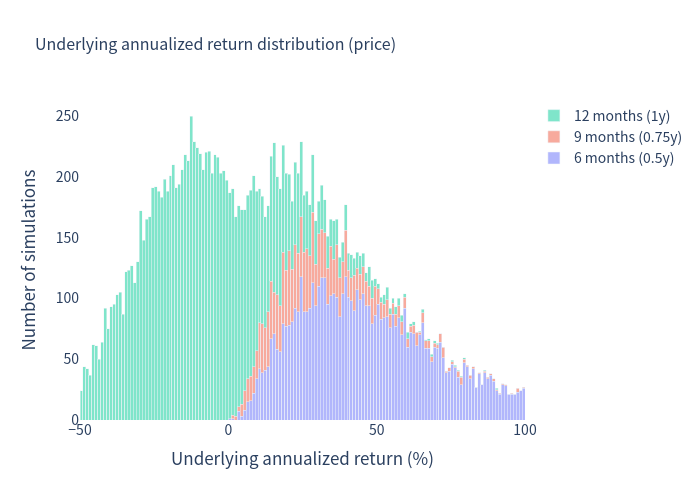
Underlying (basket) annualized return distribution, stacked by holding period. Extreme right-tail values arise from annualizing short, strongly-positive holding periods and should be read together with holding period and total return rather than in isolation.
Structured Product Annualized Return Distribution
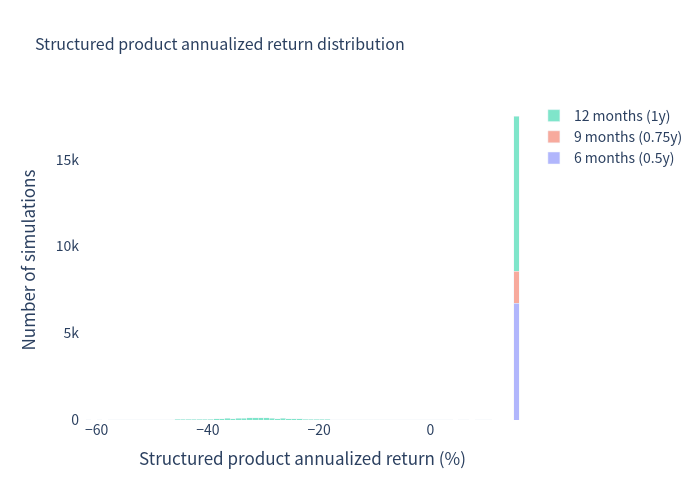
Structured product annualized return distribution, stacked by holding period. The distribution is sharply bimodal: a large spike at ~15.5% (full coupon, non-loss paths) and a negative tail for the ~12% of paths that breach the barrier.
Scenario Probabilities
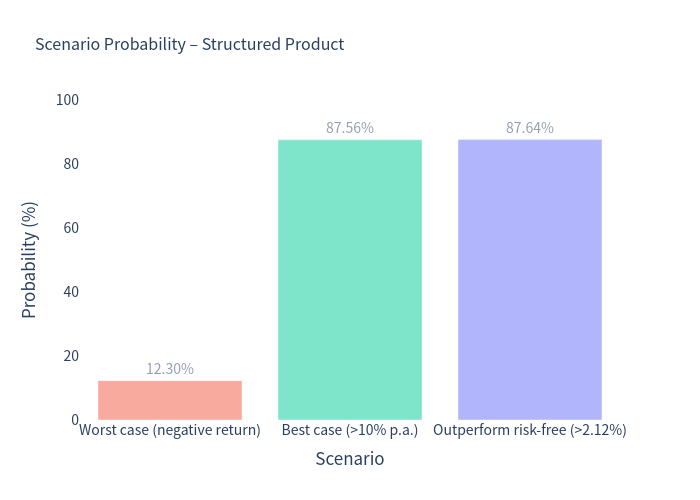
Scenario probabilities. ~12% chance of a loss, ~88% chance of annualized return above 10% (i.e., earning the full 15.5% annualized coupon rate, whether over 6, 9, or 12 months), and ~88% chance of beating the 2.12% risk-free rate.
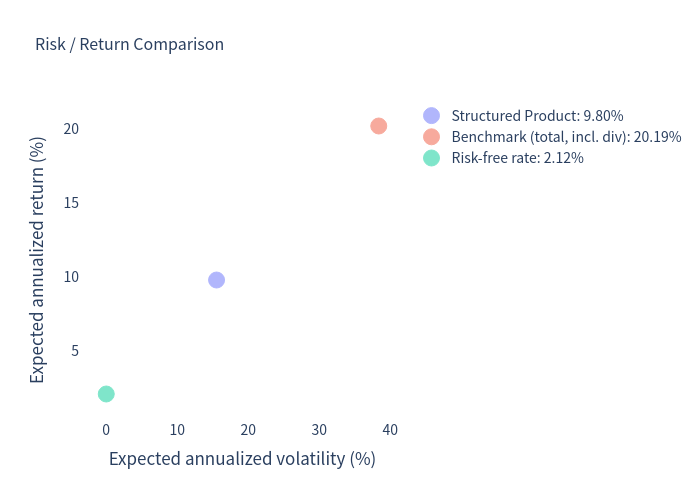
Risk / Return Map
Risk / return map. The product (blue) sits far to the left of the benchmark (red) — materially lower volatility for a moderately lower expected return — while still delivering a substantial spread over the risk-free rate (green).
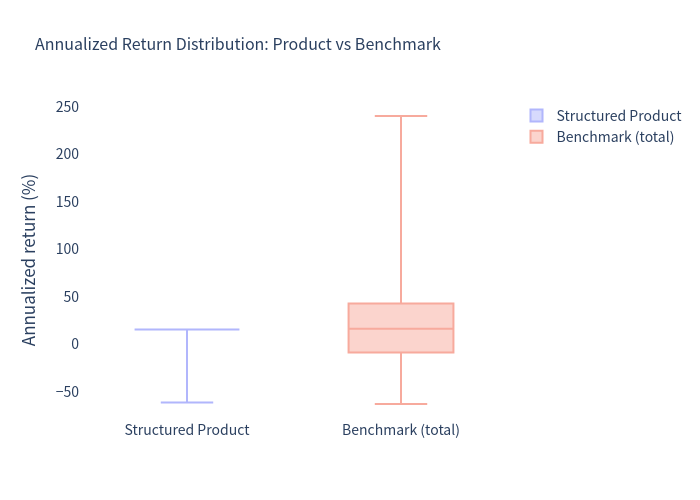
Annualized Return Box Plot
Annualized return box plot. The product's interquartile range collapses to a single level (~15.5%), showing that most outcomes deliver the coupon; dispersion comes almost entirely from the downside tail, whereas the benchmark is widely spread on both sides.
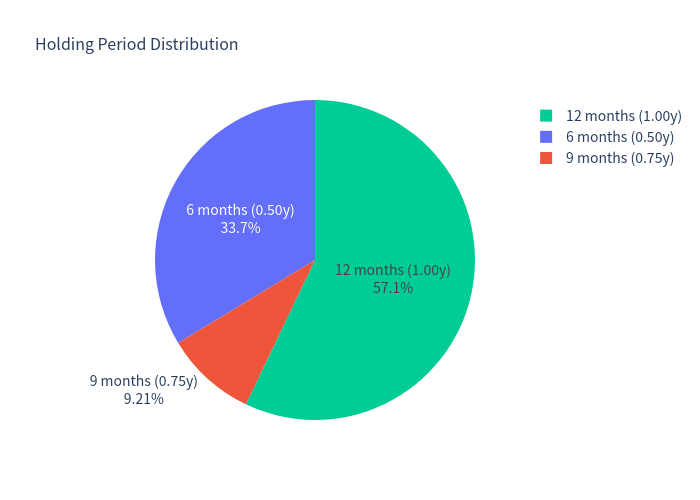
Holding-Period Distribution
Holding-period distribution. About 33.7% of paths are called at ~month 6, 9.2% at ~month 9, and 57.1% run to the ~12-month maturity.
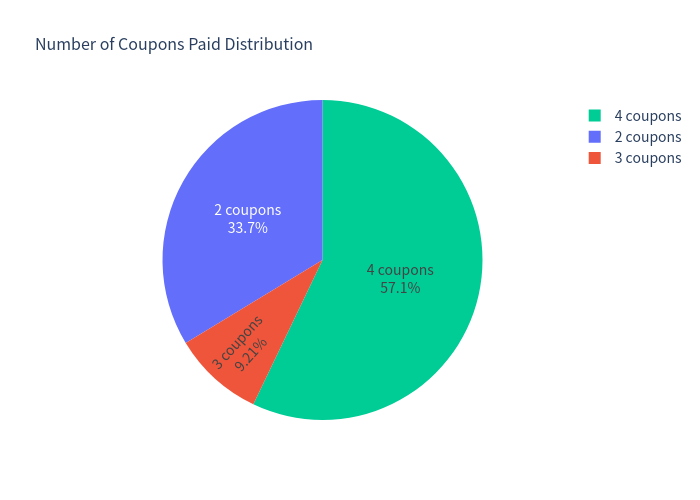
Coupon-Count Distribution
Coupon-count distribution. Investors receive 2, 3, or 4 quarterly coupons depending on when (or whether) the note is called or held to maturity.
Investment Commentary
Strengths
- High, frequent income: a 15.50% p.a. coupon paid quarterly, well above the ~2.1% EUR risk-free rate and the basket's ~4.5% dividend yield.
- Meaningful buffer: protection only breaks if a bank falls ~45% and stays at or below 55% at a monitored moment; moderate declines still return full principal.
- Much lower volatility and loss frequency than owning the banks directly (~15.5% vs ~32–38% vol; ~12% vs ~35–39% loss probability).
- Coupons are never clawed back — they are paid regardless of a barrier breach, softening the loss branch.
- Risk-adjusted profile competitive with, and on a buy-and-hold basis better than, the underlying basket.
Risks & Drawbacks
- Capped upside: gains are limited to the coupon; there is no participation if the banks rally strongly.
- Concentrated worst-of exposure: three closely correlated European banks, so one weak name can sink the return; the barrier is continuously monitored (more easily triggered than a maturity-only barrier).
- Binary loss tail: when triggered, the loss is large — the 99% 1-year VaR of ~−44% is on par with holding the shares, and physical delivery of shares can result.
- Issuer callable: early redemption at par + coupon when it suits the issuer creates reinvestment risk precisely in strong markets.
- Issuer credit risk (Leonteq, BBB−) and a limited secondary market; listed but not guaranteed.