
Simulation Analysis Report
Headline Results
The reference underlier is a proprietary, non-listed index. A documented synthetic proxy (U.S. equity-momentum returns with a 40% volatility-target overlay, up to 200% exposure, and a 4% p.a. decrement) is used for simulation; results are therefore indicative.
Loss/VaR figures assume the CD is held until its scheduled redemption or maturity date; secondary-market values before those dates are not addressed in this simulation.
How the Product Works (in plain terms)
- The investor deposits $1,000 per CD (indexed to 100). No interest/coupons are paid over the life of the CD.
- Starting on the first anniversary, and quarterly thereafter, if the reference index is at or above its initial level on an observation date, the CD is automatically redeemed, paying back the deposit plus a fixed amount equal to roughly 7.10% per annum (simple) for the time held. When annualized (CAGR) this equals ~7.10% p.a. for a year-1 call and slightly less for later calls (~6.0% p.a. for a call in year 7).
- If the CD is never auto-called, at maturity (year 7):
- If the index is above its initial level → investor receives the deposit plus 100% of the index gain (uncapped participation).
- If the index is at or below its initial level → investor receives only the $1,000 deposit (0% return, nominal principal protected).
- There are no coupons, no barrier/kick-in events, and the FDIC-insured deposit amount itself is never reduced by index performance.
Key Statistics
| Metric | Structured Product | Underlying Index (net) | Underlying + Dividends* | Risk-free (1y T-bill) |
|---|---|---|---|---|
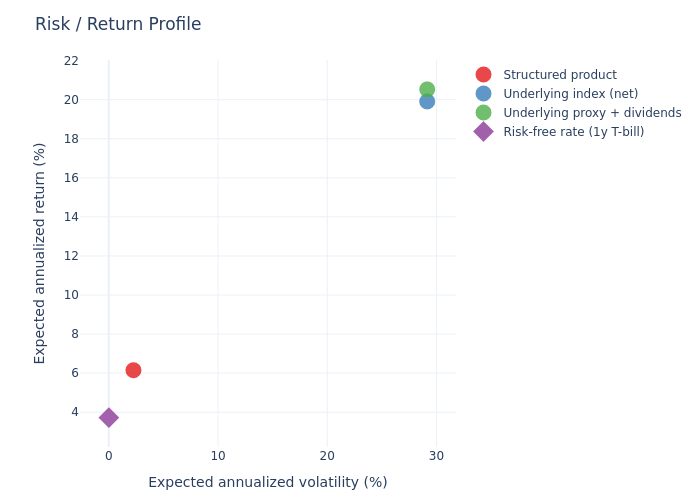
| Expected annualized return | 6.15% | 19.91% | 20.53% | 3.72% |
| Expected annualized volatility | 2.26% | 29.15% | 29.15% | 0.00% |
| Probability of loss (ann. < 0) | 0.00% | 11.54% | 11.41% | — |
| 99% VaR (1-year) | 0.00% | −18.56% | −17.94% | — |
Dividends added to the closest investable proxy (momentum ETF, ~0.62% yield). The reference index itself embeds a 4% p.a. decrement, so no dividend is added to the payoff comparison.
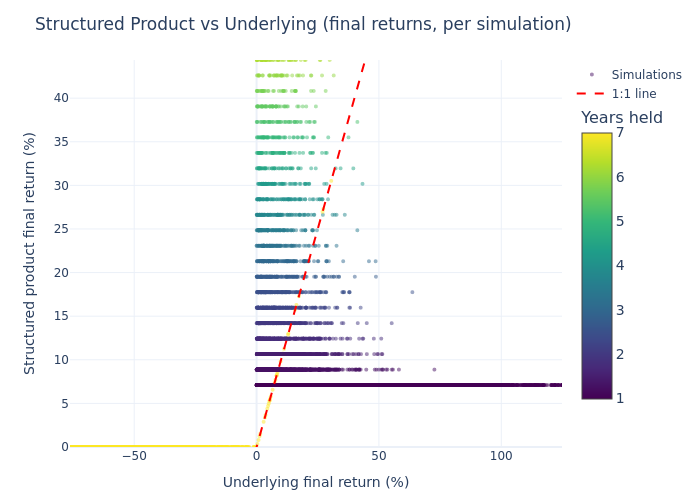
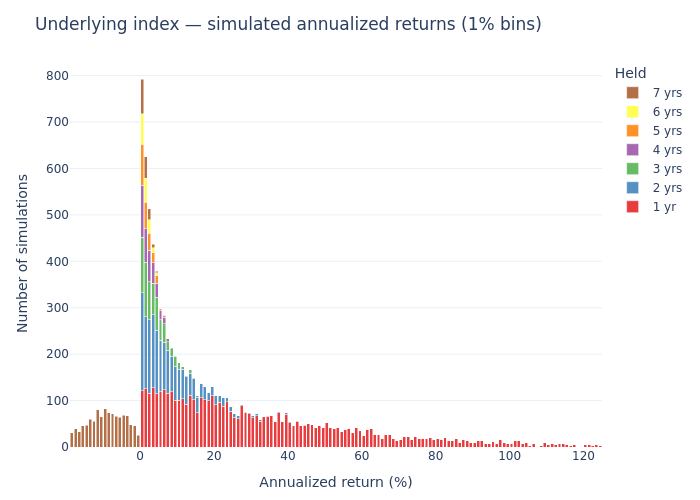
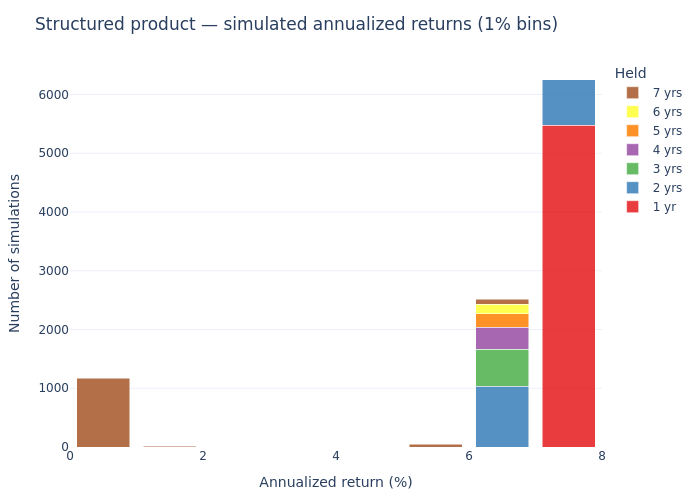
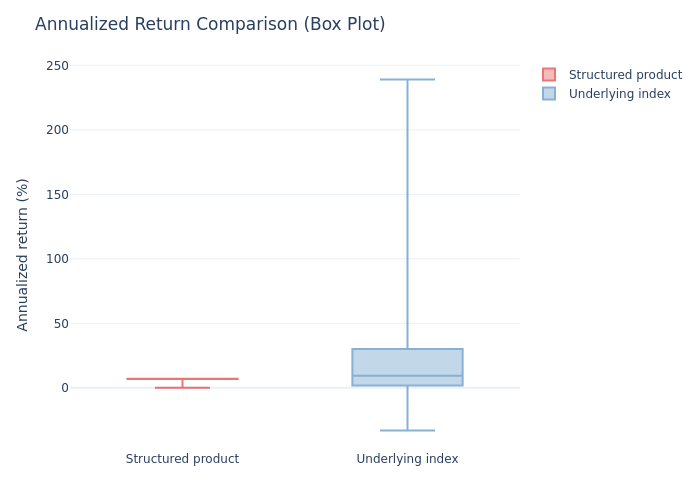
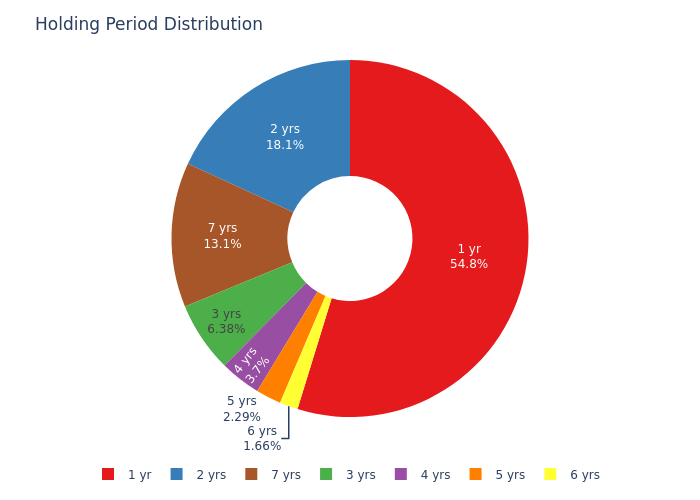
Holding-period context: because 54.75% of simulations redeem after just 12 months and ~88% within 3 years, per-simulation annualized figures are computed over each path's own realized holding period. The structured product's median annualized return is 7.10%; its mean total return across realized holding periods is 9.94%. The underlying index's matched-horizon statistics look elevated because the product tends to redeem exactly when the index is at or above its initial level.
Charts
Simulation outcomes (structured product vs underlying final returns)
Scatter plot of simulated paths: structured product payoff vs underlying index final returns.
Underlying index — simulated annualized returns
Distribution of annualized returns for the underlying (net) index across simulated paths.
Structured product — simulated annualized returns
Distribution of annualized returns for the structured product across simulated paths (clustered at ~7.1% p.a. calls and 0%).
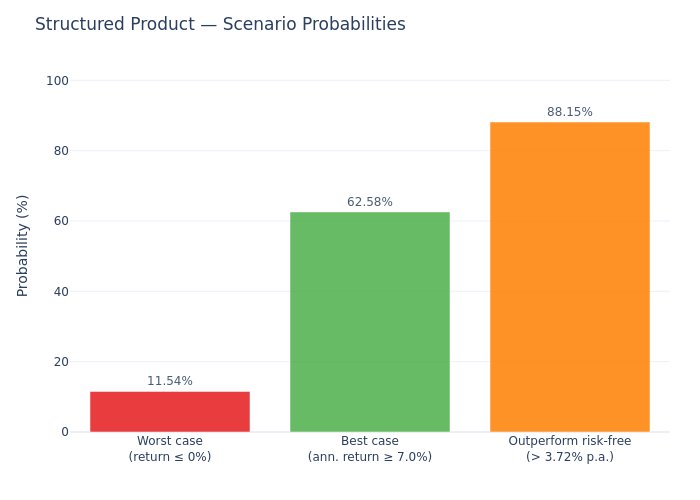
Scenario probabilities
Probability of each outcome scenario: early auto-call by year, held to maturity with upside, and flat/down at maturity.
Risk / return profile
Risk/return positioning of the structured product relative to the underlying index and risk-free benchmark.
Annualized return box plot comparison
Box-plot comparison of annualized returns: structured product vs underlying index vs risk-free.
Holding-period distribution
Distribution of realized holding periods across simulations (share of paths redeeming in each year).
Investment Commentary
Attractive features
- No nominal downside: the deposit is principal-protected and FDIC-insured; 0.00% probability of a negative return in the simulation.
- 88.15% of simulations outperform a 1-year risk-free rate of 3.72%, with a median annualized return of 7.10%.
- Early auto-call outcomes are known in advance (≈7.0–7.1% p.a.), providing a predictable ~6–7% p.a. outcome in the majority of scenarios.
- If the note is never called and the index finishes up, the investor captures the full uncapped upside (100% participation).
Trade-offs to be aware of
- The product is effectively return-capped at ≈7.1% p.a. whenever it is auto-called — which happens in ~88% of simulations — so investors give up most of the index's upside in exchange for principal protection.
- No current income (no coupons).
- There is an 11.54% chance of a 0% total return over the full 7-year term (never called and index flat/down at maturity), which underperforms even a risk-free deposit over that horizon.
- The embedded issuer/selling/hedging costs mean the pricing-date estimated value was ~$934 per $1,000 (below par).
- Because the underlier is a proprietary ~40% volatility-target decrement index, historical returns cannot be independently verified, and simulated results rely on a proxy index.