
14.20% p.a. Multi Barrier Reverse Convertible — Investment Analysis
Worst-of Commerzbank / ING / Société Générale / UniCredit — Callable, Continuous 55% Barrier — EUR, ~12-month term
Headline Simulation Results
| Metric (Structured Product) | Value |
|---|---|
| Expected annualized return | 7.53% |
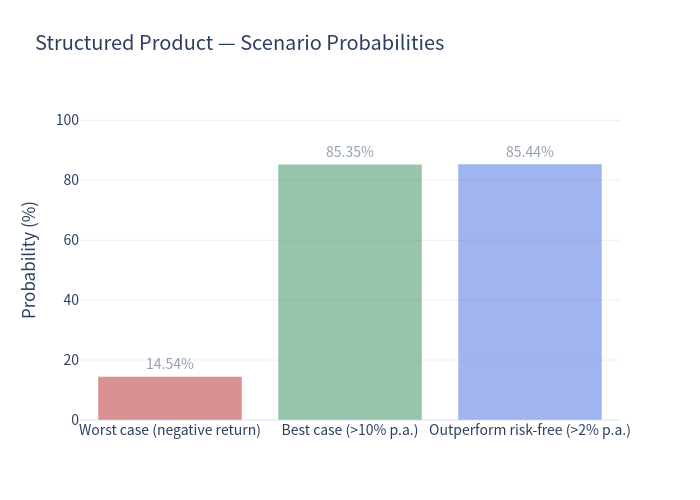
| Probability of a negative return | 14.54% |
| 99% confidence VaR (1-year) | −45.41% |
| Expected annualized volatility | 16.56% |
| Probability of no capital loss (par or better) | 85.46% |
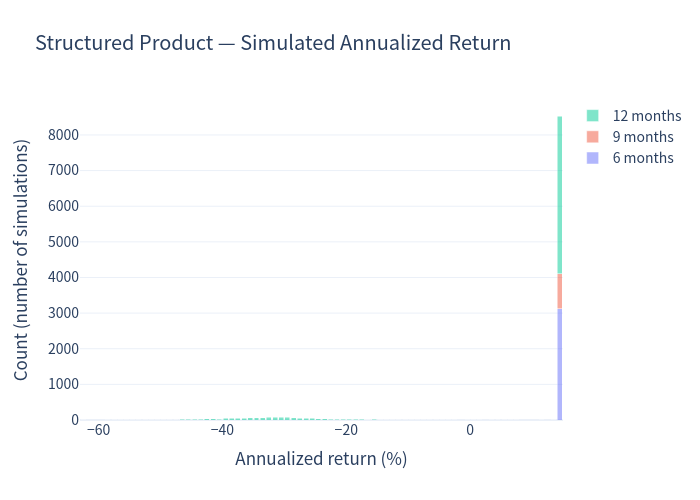
| Maximum annualized return (upside cap) | 14.20% |
| Expected holding period | 9.84 months (~0.82 years) |
| Expected total return over the realized holding period | 4.97% |
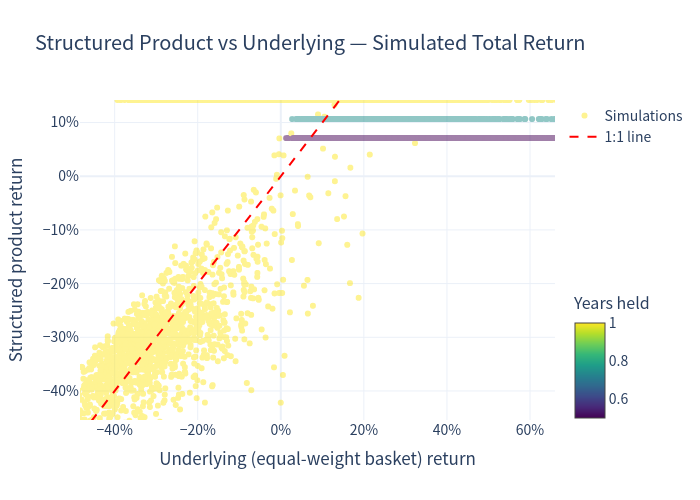
The product is a yield-enhancement / income structure. In the large majority of simulated scenarios (85.46%) the investor suffers no capital loss — par is returned together with the coupons accrued while the product was alive. The tail is the risk: in 14.54% of paths a capital loss occurs because the continuously-monitored barrier is breached and the worst-performing underlying finishes below its strike, so capital falls in line with that weakest name.
How the Product Works (plain language)
- Fixed coupon. The product pays a 14.20% p.a. coupon (EUR 35.50 per EUR 1,000, quarterly) regardless of how the shares perform — for as long as the product is alive.
- Conditional protection. Each of the four bank shares has a barrier at 55% of its starting level, watched continuously throughout the term.
- If no share ever touches its 55% barrier → the investor receives 100% of par at maturity (barrier never touched in ≈85.1% of scenarios). The issuer may still redeem early.
- If any single share does touch its barrier → at maturity the investor receives par only if the worst-performing share is back at/above its start; otherwise the investor receives the worst-performing share's actual decline and bears that loss. A single weak name can trigger this risk.
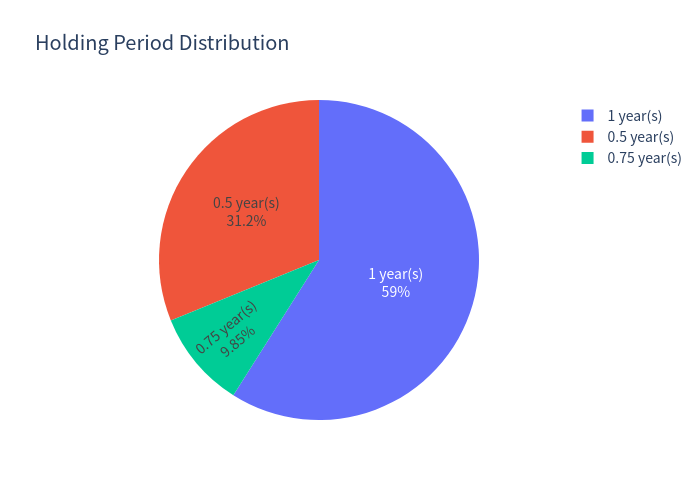
- Issuer call. At two interim dates (months 6 and 9) the issuer may redeem early at par + coupon. The term sheet gives no call-trigger level, so the issuer is modelled as calling when the worst-of level is at/above 100% of initial. About 41% of paths are called early (31% at month 6, 10% at month 9).
Key Statistics — Structured Product vs Underlying
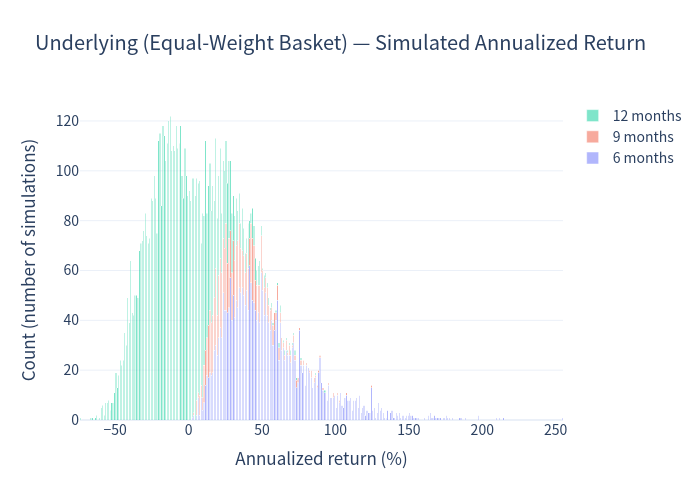
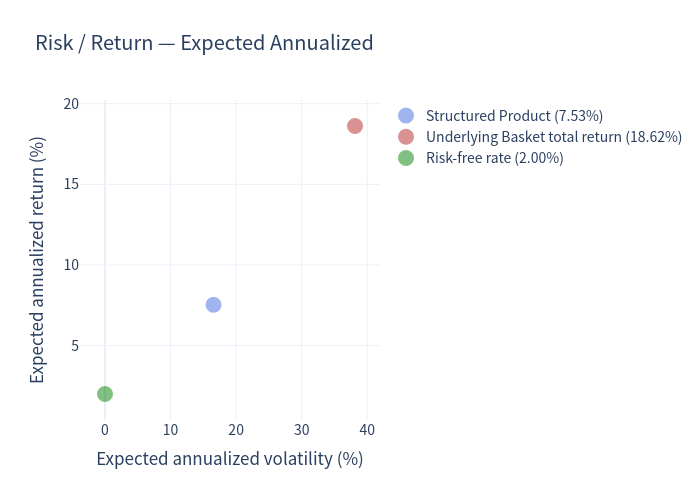
Comparison is against an equal-weight basket of the four underlying shares (the natural benchmark), shown on a total-return basis (dividends included). The EUR 1-year average risk-free (repo) rate is 2.00%.
| Metric (annualized) | Structured Product | Underlying Basket (total return) |
|---|---|---|
| Expected return | 7.53% | 18.62% |
| Expected volatility | 16.56% | 38.13% |
| Probability of loss | 14.54% | 36.36% |
| 99% VaR (1 year) | −45.41% | −45.31% |
| Sharpe-type ratio (excess / vol) | 0.33 | 0.44 |
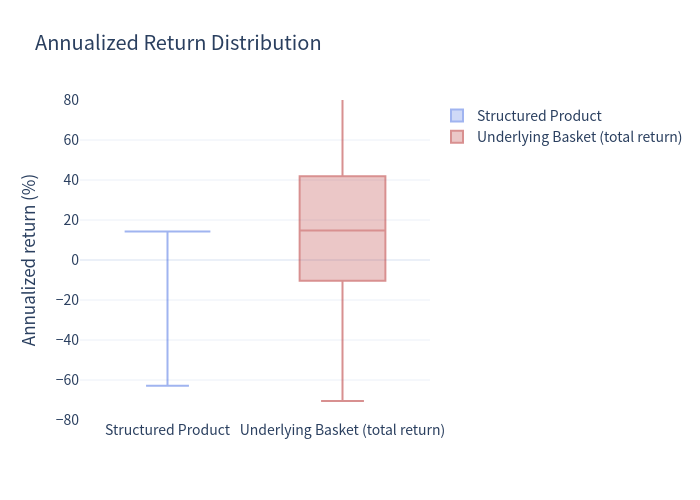
The structure materially reduces volatility (16.6% vs 38.1%) and the probability of loss (14.5% vs 36.4%), at the cost of capping upside and forgoing much of the basket's expected return. The deep 99% VaR is essentially unchanged because the barrier cushions ordinary drawdowns but not extreme ones.
Charts
Simulated annualized returns — structured product
Stacked by holding period.
Simulated annualized returns — underlying basket
Risk / return profile
Return distribution comparison
Scenario probabilities
Holding-period distribution
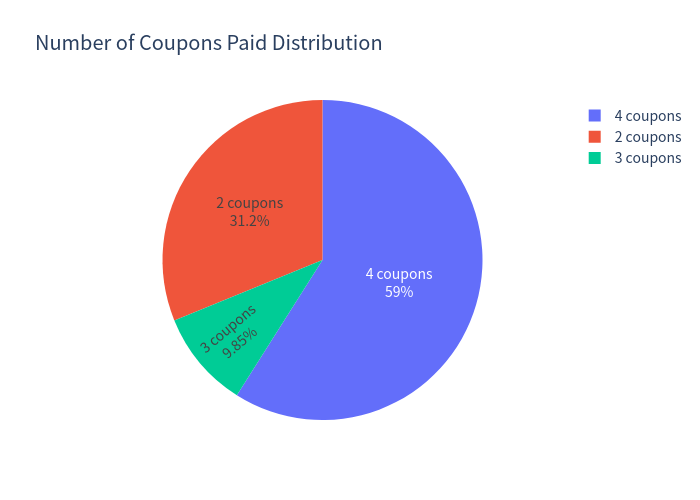
Number of coupons received
Distribution of Outcomes
- Coupons received: 4 coupons in 58.99%, 3 coupons in 9.85%, 2 coupons in 31.16% of simulations (fewer coupons arise when the issuer calls early).
- Holding period: full 12 months in 58.99%, 9 months in 9.85%, 6 months in 31.16%.
- Barrier breached in 14.92% of paths; capital loss realised in 14.54%.
- The product's annualized return is capped at 14.20% (the coupon); there is no participation in equity upside.
- Because a meaningful share of paths (31%) redeem after only 6 months, some annualized figures are amplified by the short holding period and should be read together with the total-return and holding-period figures (expected total return 4.97% over ~9.8 months).
Investment Commentary
Strengths
- High, unconditional headline coupon of 14.20% p.a., paid quarterly regardless of share performance while the product lives.
- Deep 55% barrier provides a substantial cushion: capital is at risk only in a minority of paths (≈15%), and the probability of any loss is roughly one-third that of holding the basket (14.5% vs 36.4%).
- Much lower volatility than the underlying shares — the coupon dominates the return profile in the common scenarios.
- The barrier and strike both sit well below the start, so the payoff only bites when the weakest of the four banks is severely impaired.
Risks / trade-offs to note
- Upside is capped. The investor never earns more than the coupon; strong bank-share rallies are fully forgone.
- Worst-of, continuous barrier. A single weak name can trigger the barrier, and continuous monitoring makes a touch likelier than an observation-at-maturity design.
- Equity downside is largely retained once the barrier is breached (99% VaR ≈ −45%), so capital loss can be severe in a banking-sector stress.
- Early-call risk. The issuer can redeem early (~41% of paths), shortening the coupon stream and creating reinvestment risk.
- Issuer / credit exposure to Leonteq Securities AG (TCM-collateralised).
This analysis is a quantitative simulation of contractual payoffs and is not investment advice or a suitability assessment.