
1. Headline simulation results
| Headline metric | Result |
|---|---|
| Expected annualized return (structured product) | 6.12% |
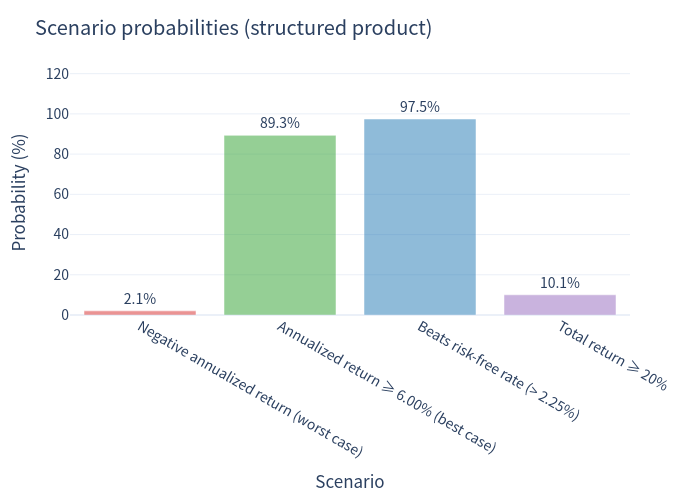
| Probability of a negative return | 2.06% (annualized return below zero) |
| 99% confidence VaR (1 year) | −4.99% (annualized return) |
| Expected total return over the realized holding period | 7.39% |
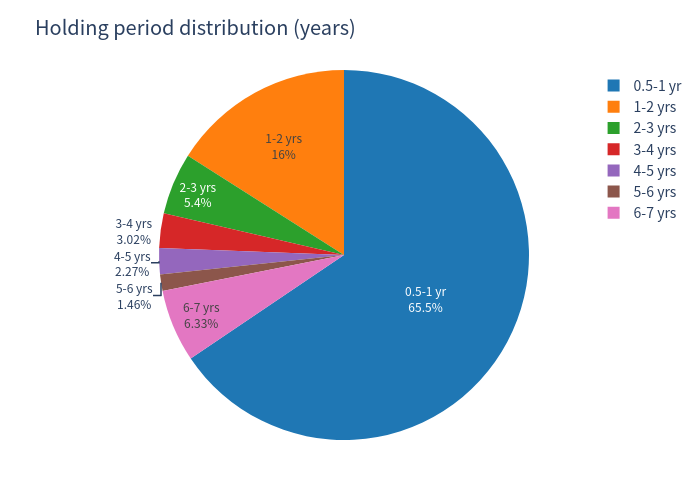
| Expected holding period | 1.45 years (median 8 months) |
| Probability of being automatically called | 94.41% |
| Probability of losing principal at maturity (barrier breached) | 2.35% |
The note is a monthly coupon, auto-callable, maturity-monitored barrier structure paying 6.54% p.a. (0.545% per month) while the index stands at or above 70% of its initial level. In the simulation the note is usually redeemed early: 68.02% of paths are called within the first 12 months and 82.12% within 24 months, so the holding period is short and the return profile is closer to a short-dated floating-rate note than to a 7-year equity exposure.
Reading the numbers together: because most simulations end after only 6–12 months, annualized figures can look extreme. The product's expected total return of 7.39% over an average holding period of 1.45 years is the more intuitive reading of the same outcome; the mean of the per-simulation annualized returns is 6.12%.
2. Basic product information
| Item | Detail |
|---|---|
| Issuer | National Bank of Canada (senior unsecured, non-bail-inable; DBRS AA / S&P A+ / Moody's Aa2 / Fitch AA) |
| Currency / notional | Canadian dollars, $100 per note |
| Term | 7 years (Nov 6, 2026 → Nov 7, 2033), callable monthly from May 2027 |
| Coupon | 6.54% p.a., paid monthly (0.545% of principal per month) when the index return is ≥ −30% on the coupon valuation date |
| Coupon threshold | −30.00% (single index level test, monthly, no memory) |
| Maturity barrier | −30.00%, observed only at maturity (not continuously monitored) |
| Autocall | Monthly from the April 29, 2027 valuation date; triggered when the index return is ≥ +5.00%; redemption at par ($100) plus the period's coupon |
| Redemption | Par if the index return is ≥ −30% (called or at maturity); otherwise 100 × (1 + index return), subject to a 1% principal floor |
| Upside | Capped — no participation in index appreciation; maximum total cash flow 145.78 per 100 of principal |
How it works (plain language)
Each month the note checks the index. If the index has not fallen more than 30% from its starting level, the investor receives a 0.545% coupon. Starting in May 2027, the issuer additionally checks whether the index is at least 5% above its starting level: if it is, the note is called automatically, the investor gets the principal back plus that month's coupon, and the investment ends. If the note is never called, it runs to November 2033; principal is repaid in full as long as the index is not more than 30% below its starting level on the final observation date. Only in the case where the index is down more than 30% at that final date does the investor lose principal one-for-one with the index decline (floored at 1% of principal). Importantly, the index used is a 5% decrement index: it tracks the Canadian large-cap total-return universe minus 5.00% per year, while the constituent dividend yield is only about 2.19% — a structural headwind of roughly 2.8% per year relative to the price index.
3. Key statistics
All figures use the same realized holding period for the product and for the index (each simulation's exit month), annualized by holding period.
| Metric | Structured product | Underlying: SOLXIU5 5% decrement index | Underlying universe, total return (dividends included) | Risk-free rate |
|---|---|---|---|---|
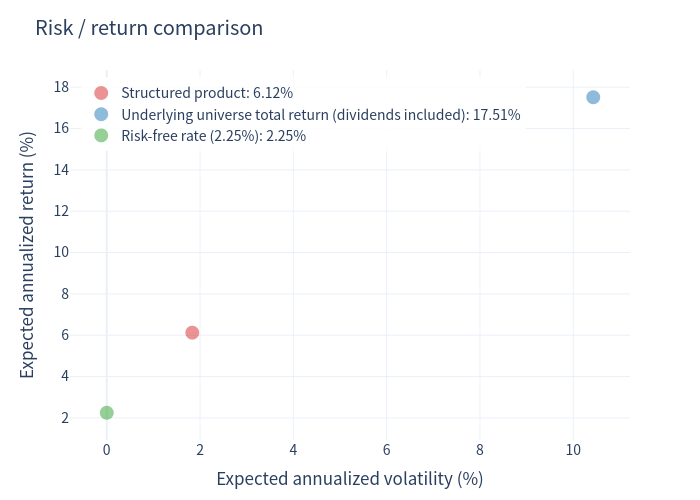
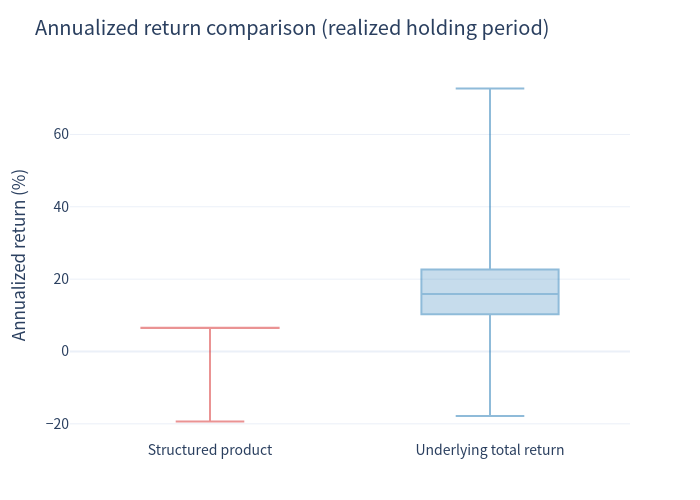
| Expected annualized return | 6.12% | 12.07% | 17.51% | 2.25% |
| Median annualized return | 6.54% | 10.50% | 15.91% | 2.25% |
| Expected annualized volatility | 1.83% | 10.20% | 10.43% | 0.00% |
| Probability of loss (annualized < 0) | 2.06% | 5.38% | 2.42% | — |
| 99% confidence VaR (1 year) | −4.99% | −8.45% | −3.76% | — |
| Expected total return over holding period | 7.39% | 6.62% | 14.36% | — |
Context — full 7-year buy-and-hold (no early redemption): the decrement index is expected to return 4.21% annualized (22.41% of paths end below their starting level), while the dividend-inclusive universe is expected to return 9.55% annualized. The much higher same-horizon index returns shown above (12.07% / 17.51%) are a selection effect: simulations exit precisely when the index has risen at least 5%, and short windows are then annualized.
Outcome distribution
| Measure | Value |
|---|---|
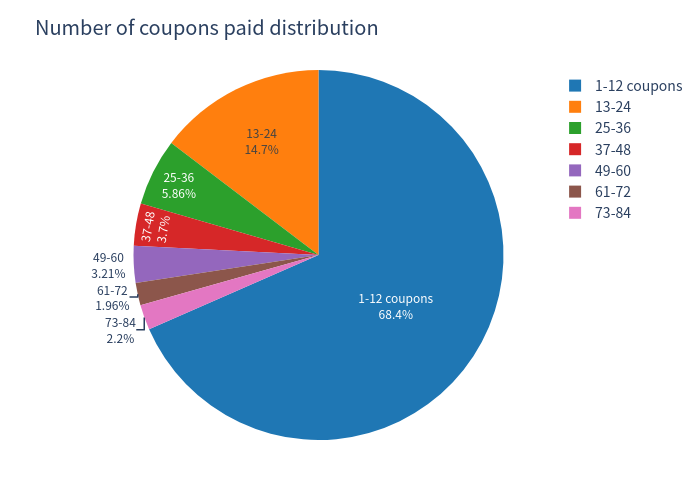
| Average number of coupons received | 15.53 of a possible 84 |
| Probability of receiving all 84 coupons | 0.58% |
| Probability of 12 or fewer coupons | 68.42% |
| Redemption at par ($100) | 97.65% of simulations |
| Average redemption when the barrier is breached | 54.47 (range 17.83 – 69.98) |
| Worst simulated total return | −77.81% |
| Best simulated total return | 45.78% (par + all 84 coupons) |
| Maximum possible annualized return | 6.54% |
4. Charts
4.1 Simulation outcomes — product vs underlying
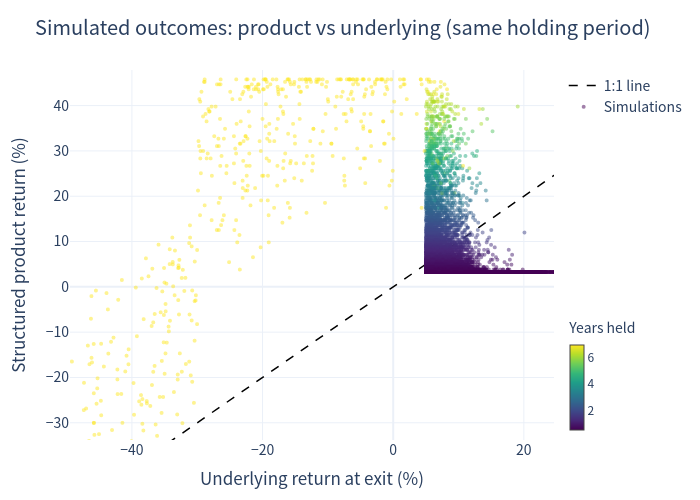
Each point is one simulation. Points sitting on the horizontal band near 0–7% reflect early redemptions at par plus coupons, insensitive to how far the index rose (capped upside). Points that fall below the 1:1 line and to the left are uncalled notes that ended below the barrier: the index loss passes through one-for-one.
4.2 Annualized return distributions
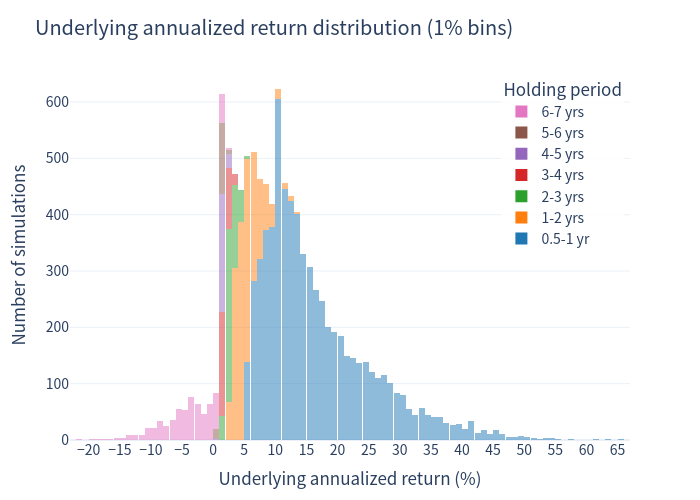
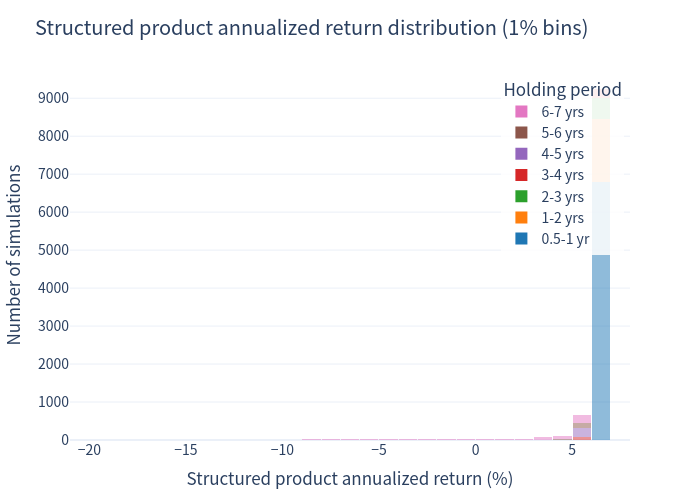
The product distribution is tightly clustered at 6.54% — the annualized equivalent of receiving every monthly coupon and par back at an early call. The left tail contains the rare barrier-breach outcomes.
4.3 Risk / return comparison
4.4 Annualized return box plot
4.5 Scenario probabilities
4.6 Holding period and coupon count
5. Investment commentary
Strengths
- High probability of a positive outcome. 97.45% of simulations beat the 2.25% risk-free rate and 89.32% earn at least 6.00% annualized; the probability of an outright loss is only 2.06%.
- Wide, single-observation protection. The coupon threshold and the maturity barrier are both at −30%, and the barrier is observed only on the final valuation date — an intra-term drawdown of more than 30% does not itself cause a capital loss, it only suspends coupons.
- Effective downside cushion for a modest volatility profile. Simulated annualized volatility of the note is 1.83% versus 10.20% for the index; the 99% VaR is −4.99% versus −8.45% for the index on the same holding periods.
- Cash-flow predictability. With a +5.00% call threshold, the note is called in 94.41% of paths at an average of 15.53 monthly coupons, so the realistic experience is a short-dated instrument returning par plus accrued income.
- Structural floor. Redemption is floored at 1% of principal, so the note cannot be worth less than 1 while the issuer performs.
Trade-offs and risks
- Capped upside, given up explicitly. The maximum annualized return is 6.54% (145.78 total per 100 of principal) regardless of how far the index rallies. In simulations where the note is called after a strong move, the index return over the same window (12.07% annualized; 17.51% including dividends) far exceeds what the note pays.
- Reinvestment risk dominates the outcome. 68.02% of paths end within 12 months. The investor effectively takes a 6.54% annualized short-term yield and must then reinvest at whatever rate prevails.
- The 5.00% decrement is a persistent headwind. Decrement (5.00%) exceeds the 2.19% constituent dividend yield, so the reference index sheds about 2.81% a year relative to the price index. Over the full 7 years this makes the −30% barrier meaningfully easier to breach: the index is expected to return only 4.21% annualized and 22.41% of unsimulated 7-year holds finish below the starting level.
- Non-memory coupons. A month below −30% forfeits that coupon permanently (no catch-up), which is why 68.42% of paths receive 12 or fewer coupons.
- Fat left tail when protection fails. When the barrier is breached, average redemption is 54.47 and the worst simulated total return is −77.81%; the 2.35% probability tail is severe, not moderate.
- Issuer and liquidity considerations. The notes are unsecured obligations of the issuer, are not rated, are not CDIC-insured, are not listed, and rely on the dealer's secondary market (subject to an early trading charge).
Assumptions: 2.25% Canadian risk-free rate, 6.00% equity risk premium, 5.00% annual index decrement, 2.19% constituent dividend yield, 84 monthly observations, no fees or trading charges. Figures are model outputs, not forecasts.