
Morgan Stanley — SPUMP40 Contingent Income Memory Buffered Auto-Callable Securities due February 4, 2031
Headline Simulation Results
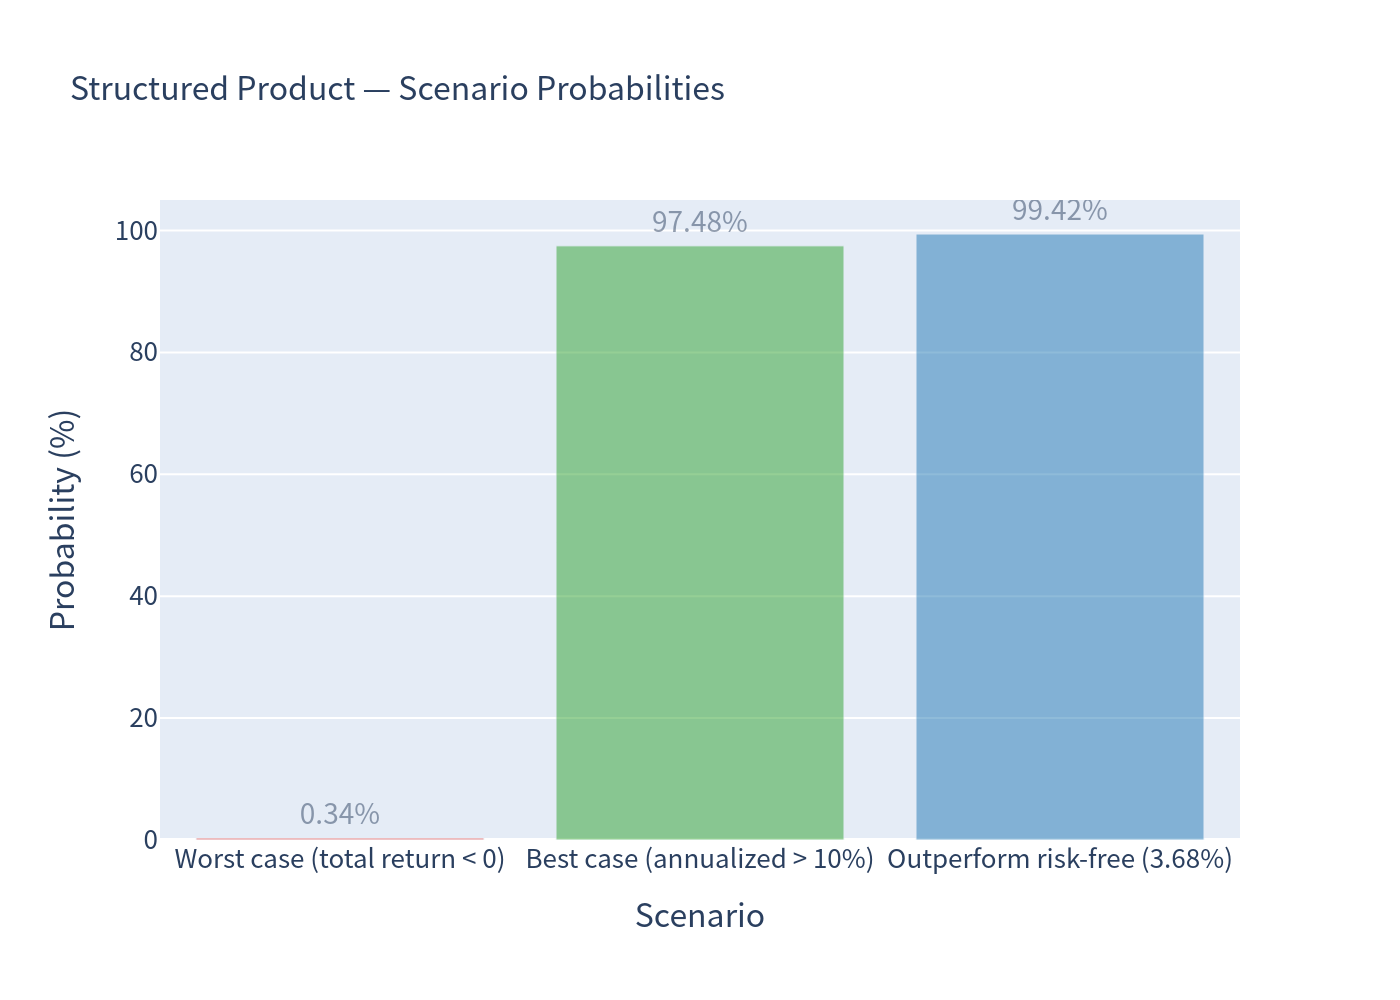
The headline picture: the note behaves like a short-dated, high-coupon instrument. Its economics are dominated by the ~12% p.a. coupon, and because it is almost always automatically redeemed early at par, the realized loss risk over the horizon is very small (0.34%) and the 1-year 99% VaR is positive (+8.57%).
Basic Product Info — How It Works (plain language)
This is a 5-year note linked to a single U.S. equity index (the S&P U.S. Equity Momentum 40% VT 4% Decrement Index). In the simulation the underlier is represented by a broad U.S. equity market proxy.
- Monthly contingent coupon (~12% p.a., with memory). Each month you are paid a coupon only if the index is at or above 70% of its starting level on that month's observation date. If a coupon is missed, the "memory" feature banks it and pays it to you on the next date the 70% test is met.
- Automatic early redemption ("autocall"). If the index is at or above 100% of its starting level on any monthly determination date (starting after 6 months), the note is redeemed early at par. A coupon is still paid on that redemption date if the 70% test is met, and no further payments are made afterwards.
- Buffered maturity. If the note is never called, at maturity you get full principal back provided the index has fallen no more than 15%. If it has fallen more, you lose 1-for-1 on the decline beyond 15% (maximum loss 85%).
- Capped upside. You never participate in index appreciation — par is the best redemption outcome.
Key Statistics (simulated)
| Expected annualized return | Expected annualized volatility | Probability of loss | 99% VaR (1 year) | |
|---|---|---|---|---|
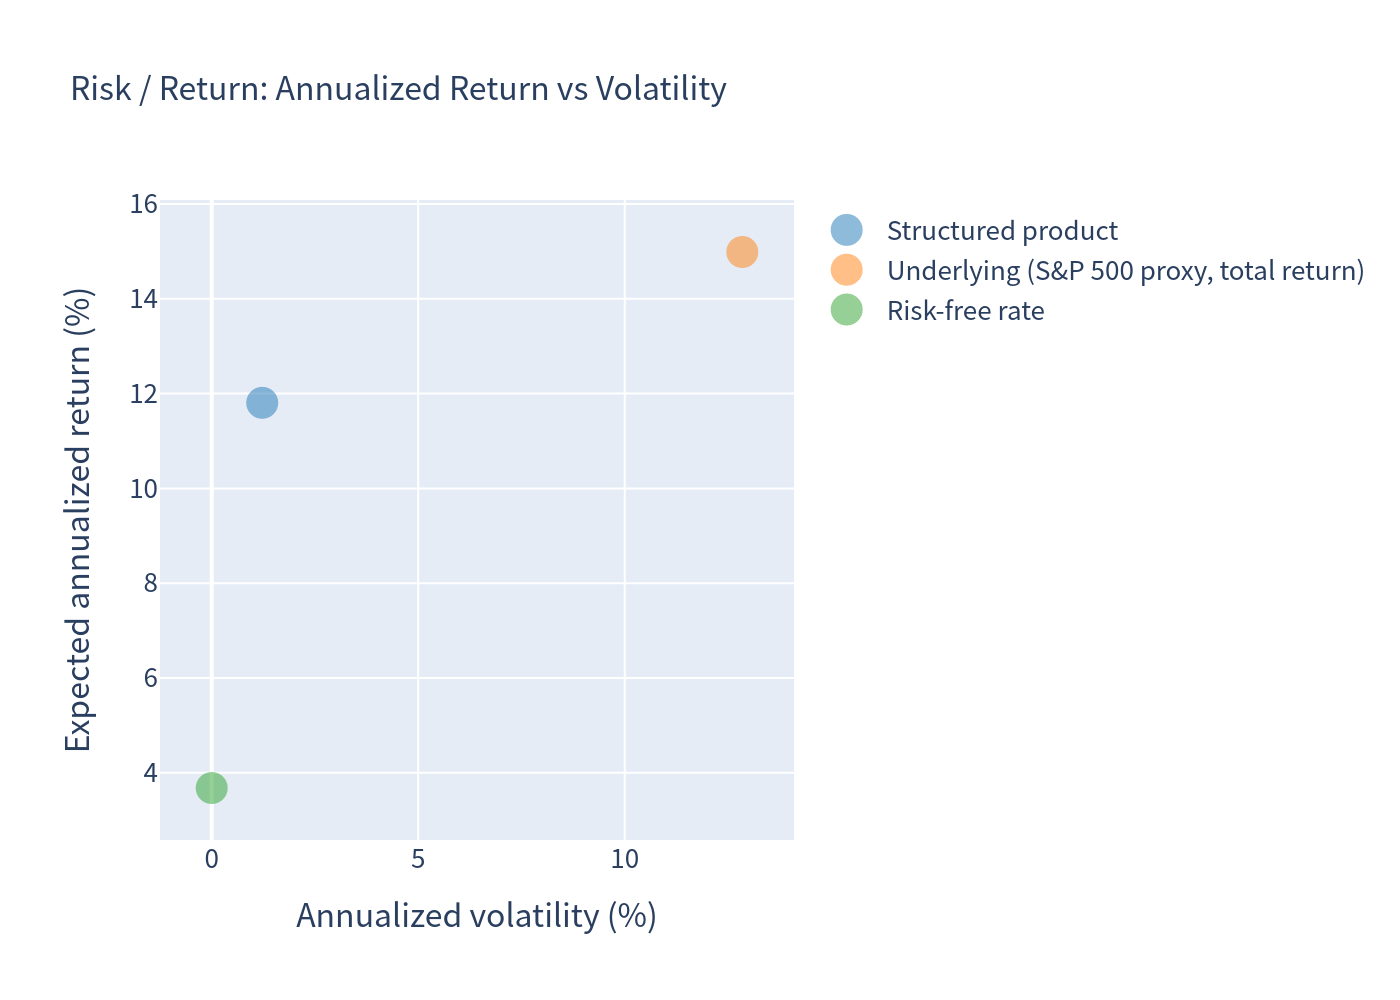
| Structured product | 11.81% | 1.22% | 0.34% | +8.57% |
| Underlying (total return, incl. dividends) | 14.99% | 12.85% | 2.25% | −4.40% |
| Risk-free rate (1-year average T-bills) | 3.68% | — | — | — |
Interpreting these numbers
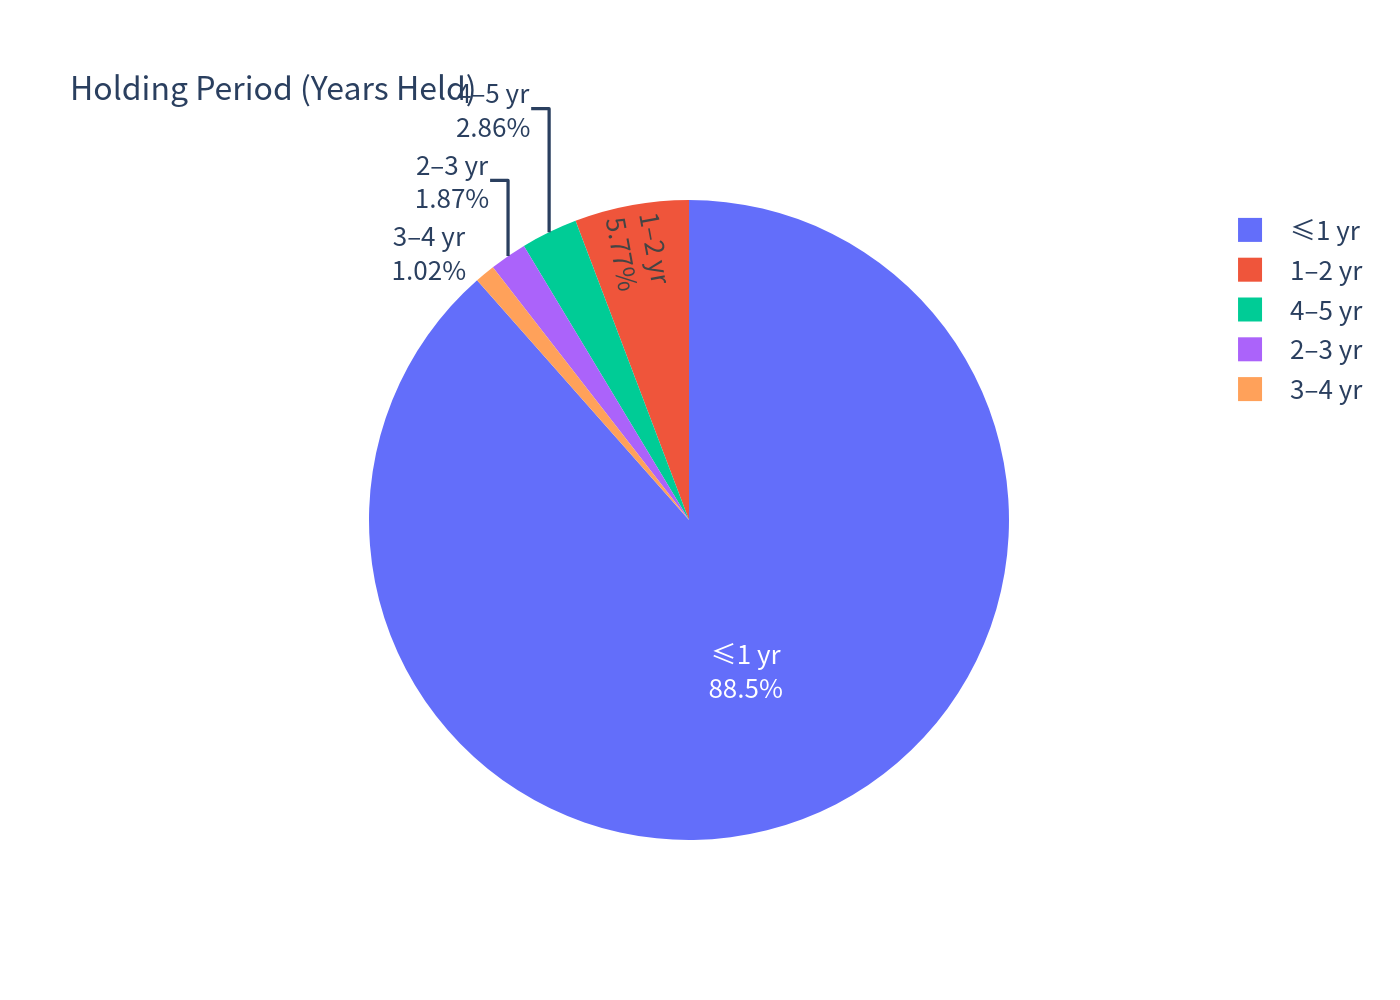
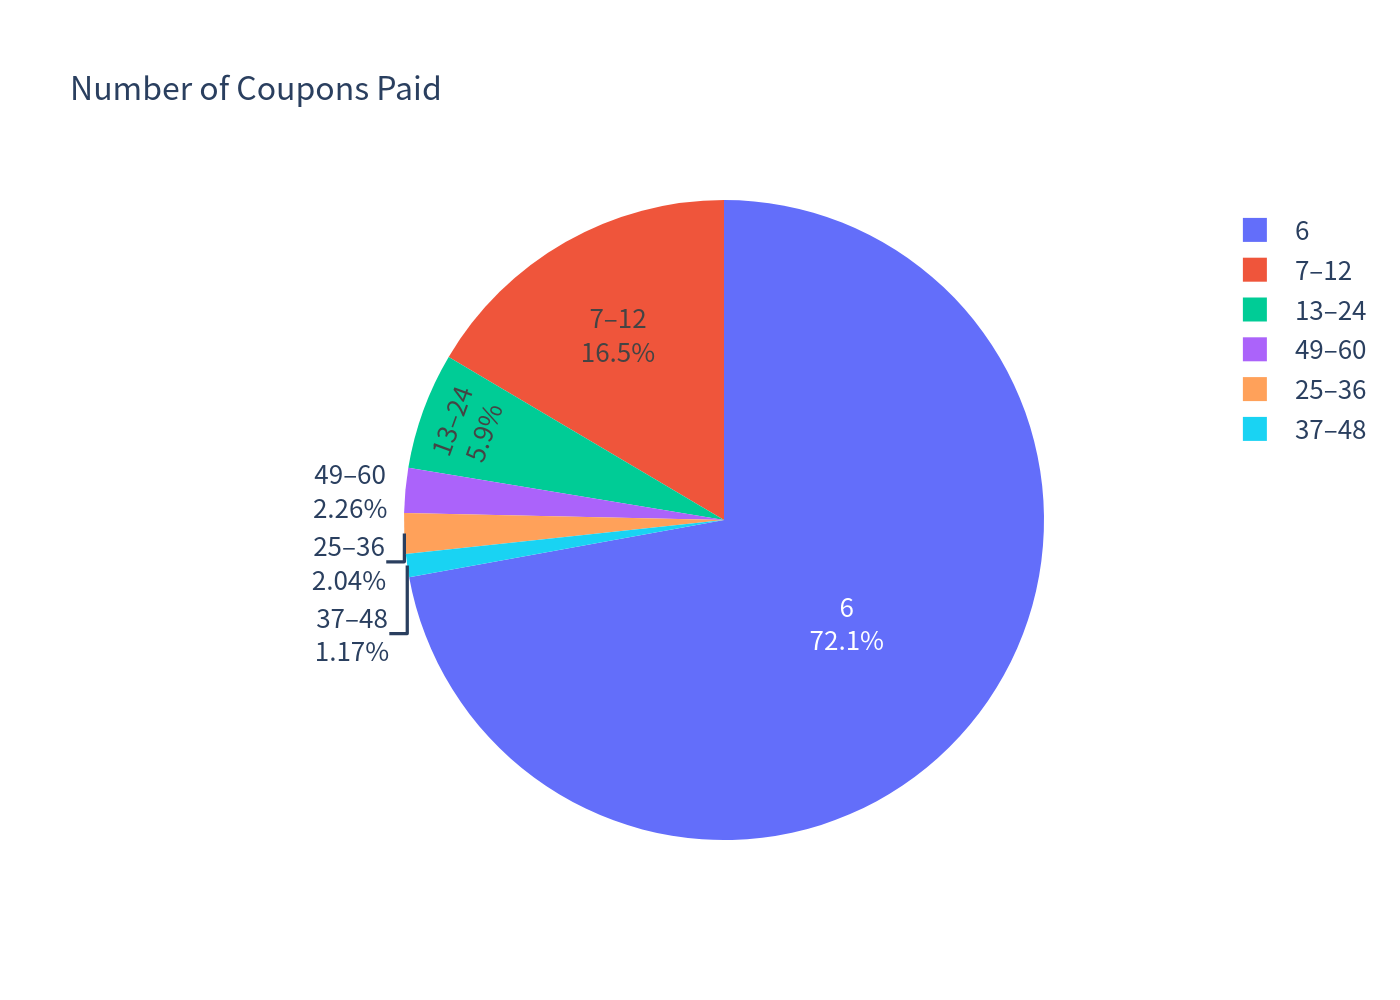
The two rows are not a like-for-like "expected drift" comparison. Because ≈ 72% of simulations are called at the very first date (month 6) and ≈ 88% within the first year, roughly 87% of paths are annualized with a ×(12/m) linear factor, which amplifies short, call-selected returns. This inflates both annualized means, and the volatile underlying more than the product:
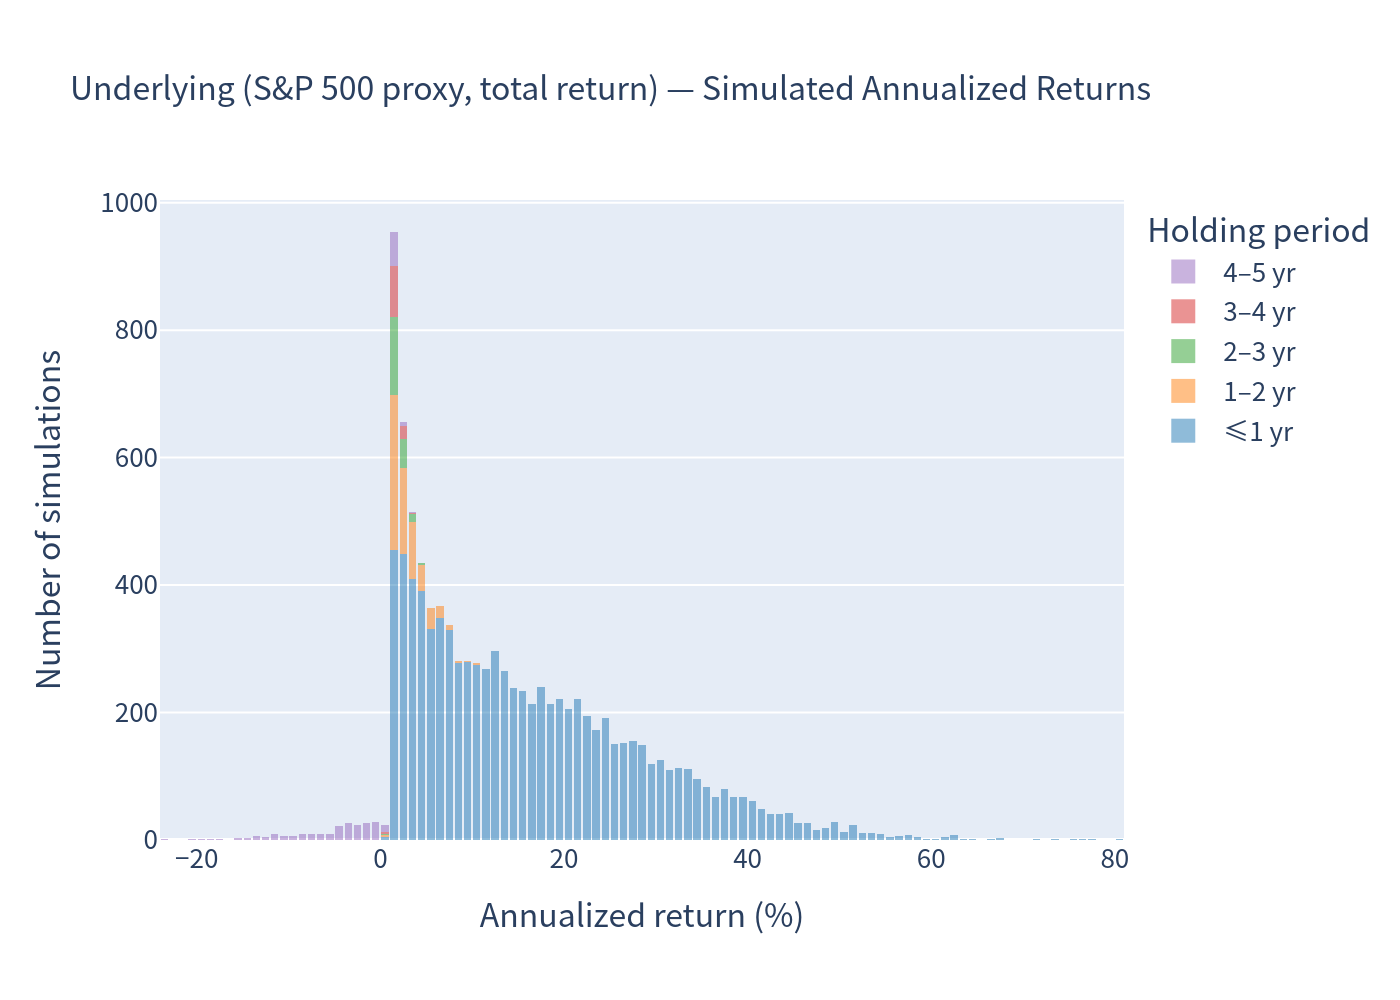
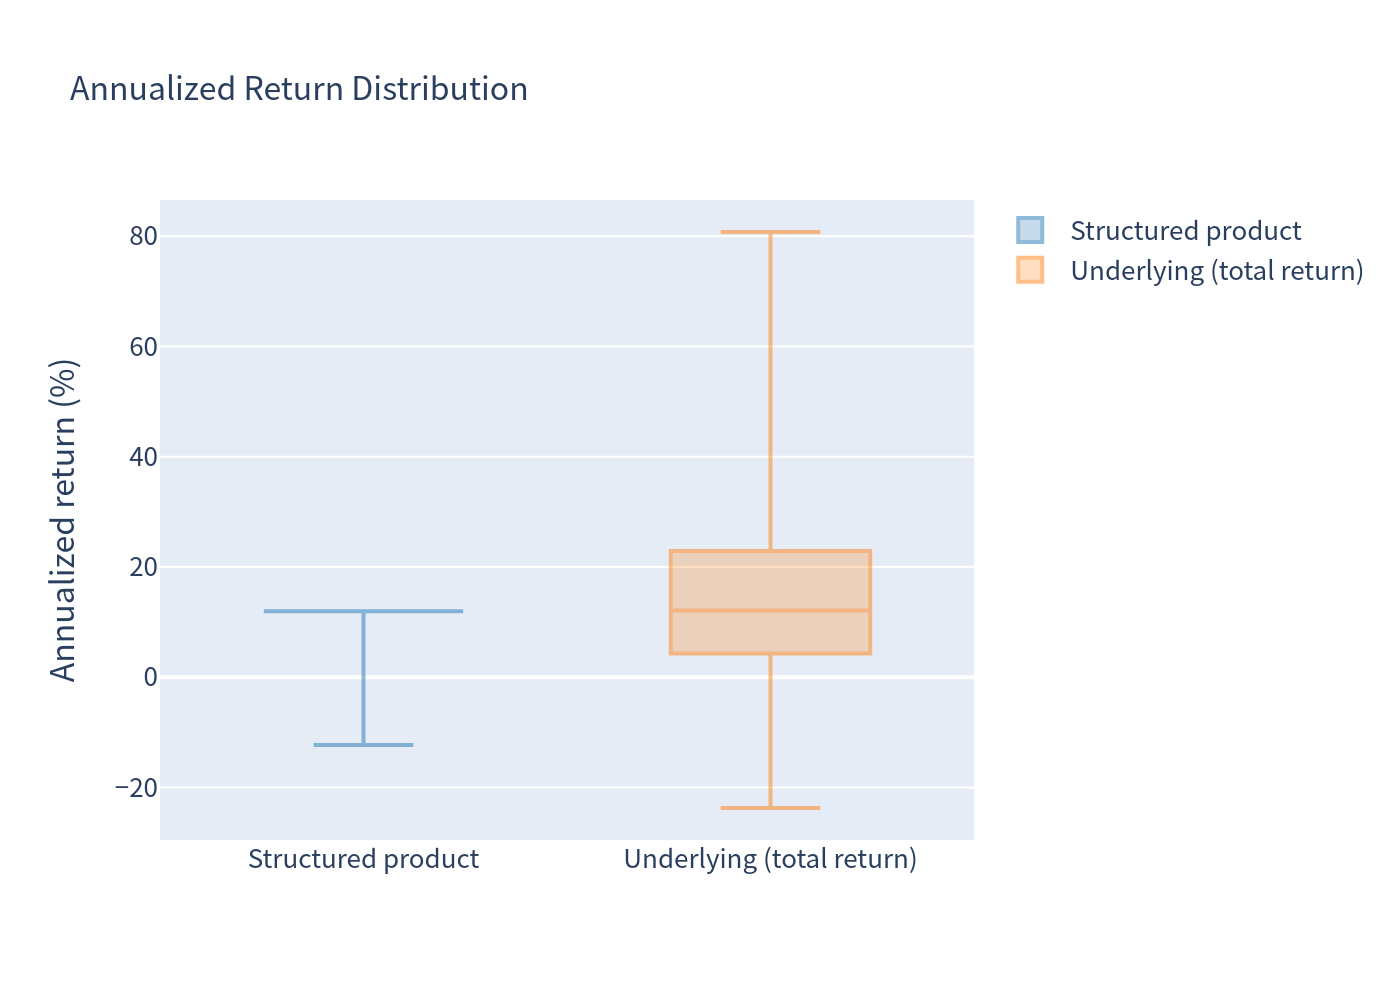
- Underlying median annualized return is 11.13% (mean 14.99%) — the mean is pulled up by a right tail.
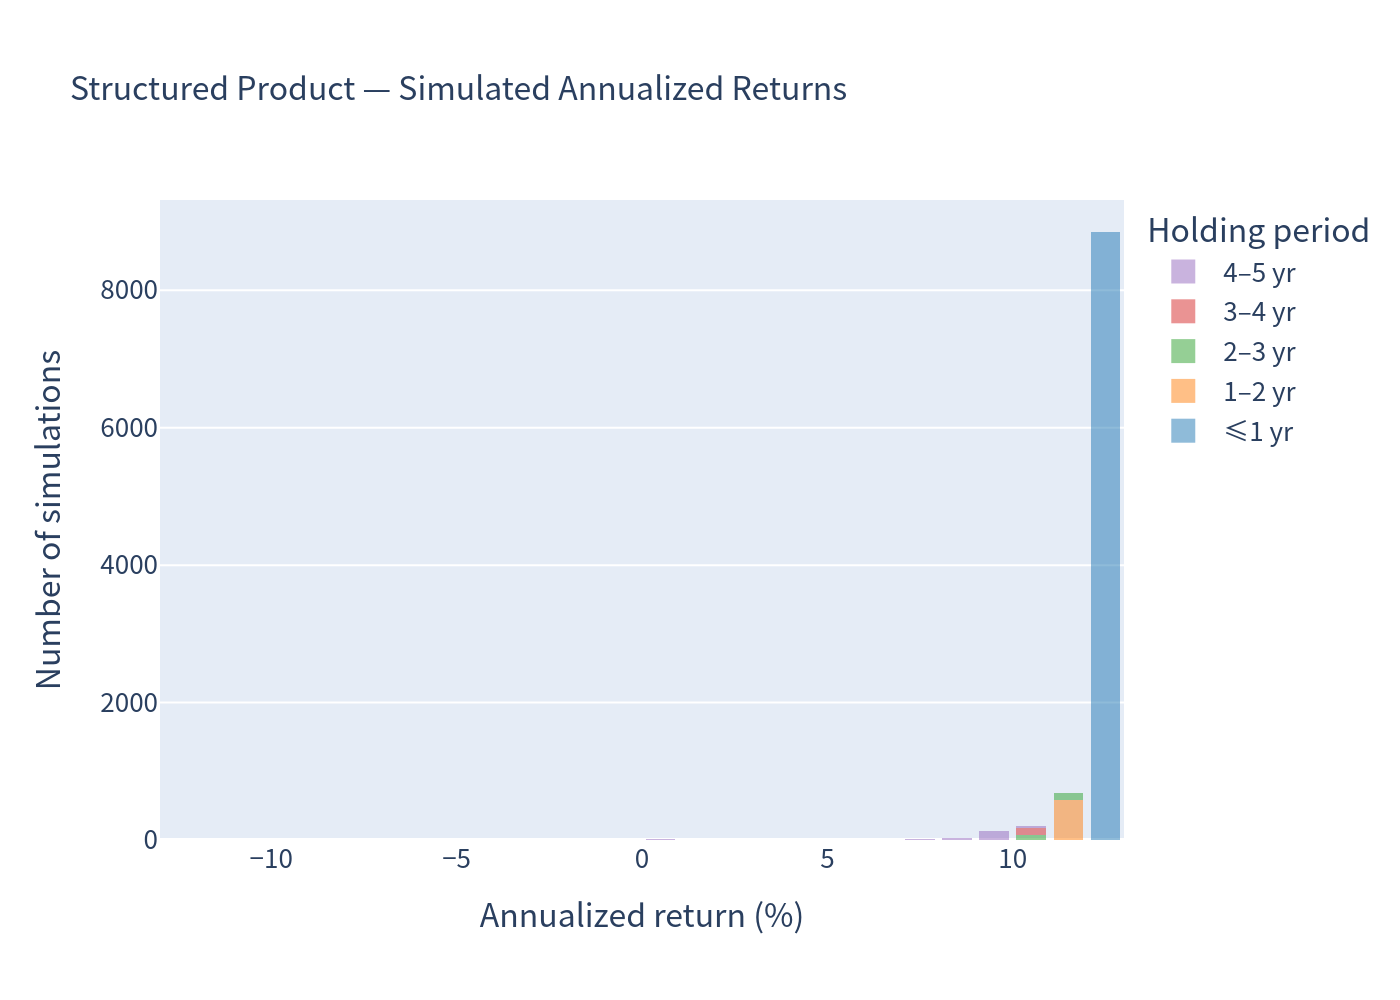
- The product's median annualized return is 12.00% (roughly flat across paths, hence mean ≈ median).
- On the realized horizons, the product's mean total return of 8.88% actually edges out the underlying's 7.54%; as a sanity anchor, a plain 5-year buy-and-hold of the underlying proxy annualizes to ≈ 8.5%.
So: the product converts the underlier's volatile, capped-at-par path into a steady ≈12% annualized coupon stream with a small tail risk, while giving up the market's upside. Its expected annualized excess over cash is ≈ +8.1 points, delivered at about one-tenth of the underlying's volatility.
Charts
1) Simulation outcomes — product vs underlier
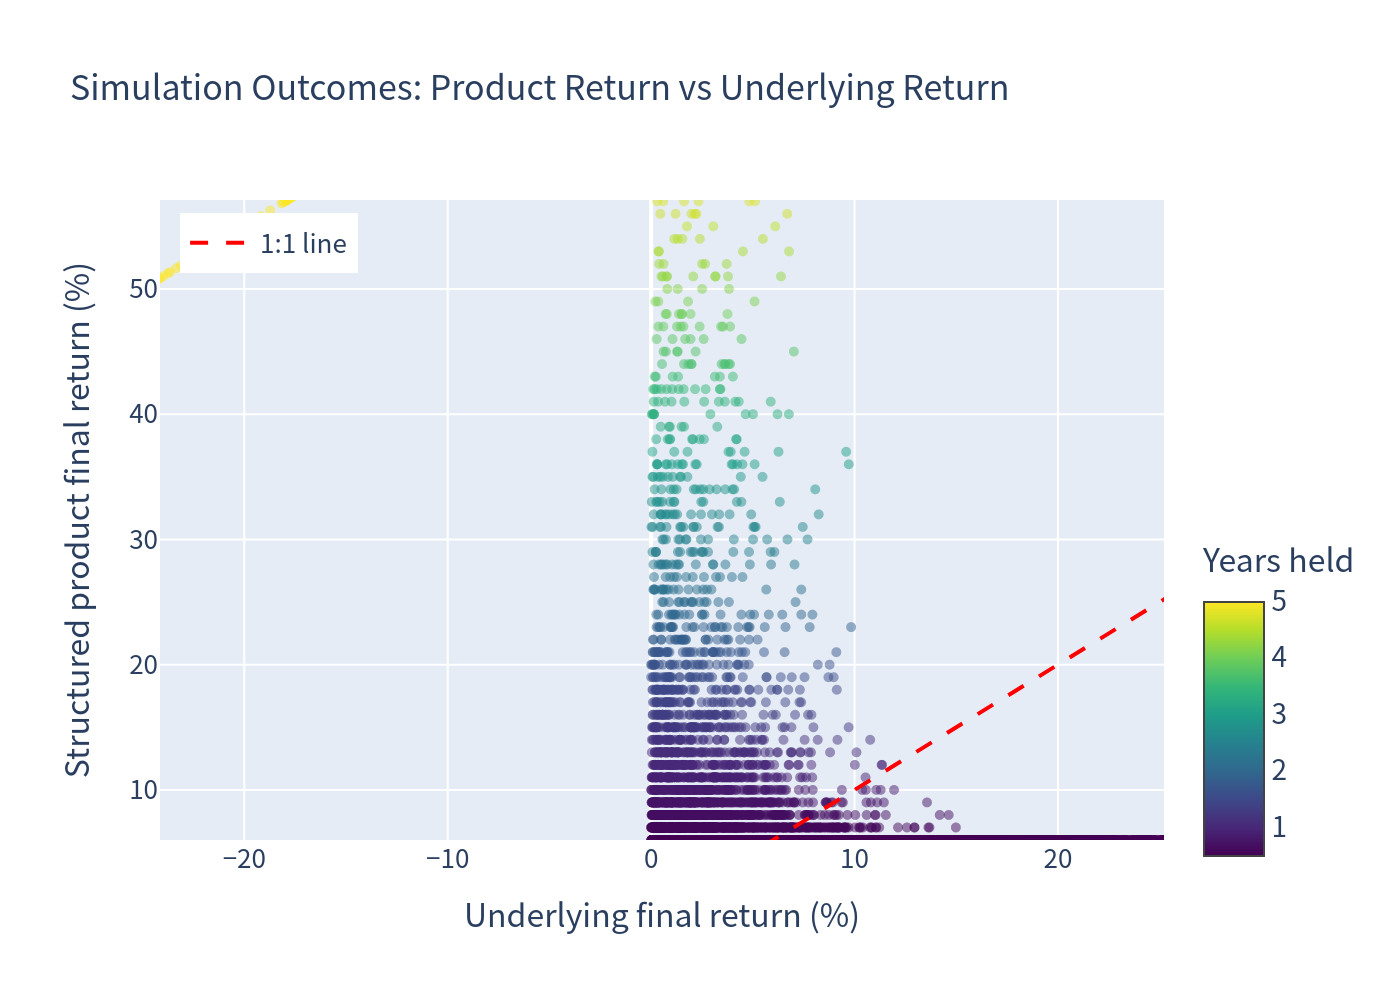
Each dot is one simulation; the dashed line is 1:1. Product returns cluster in a narrow band (par + coupons) while underlier returns fan out.
2) Structured product — annualized return distribution
3) Underlying (total return) — annualized return distribution
4) Scenario probabilities
5) Risk / return positioning
6) Annualized return distribution (box plot)
7) Holding period distribution
8) Number of coupons paid
Investment Commentary
Potential merits
- High coupon (≈12% p.a.) with a forgiving 70% trigger and a memory feature — coupons are only forfeited if the index sits below 70% and never recovers before maturity.
- Structurally defensive: the simulation shows a 0.34% loss probability and a positive 99% 1-year VaR; the coupon stream plus the 15% buffer mean outcomes elsewhere are dominated by coupons being paid.
- Reliable income in flat-to-up markets: because the coupon condition (≥70%) is far below the call level (100%), the note keeps paying even when the market is modestly down.
Risks and caveats
- Upside is capped — investors forego all index appreciation; par + coupons is the best case. In strong rallies the underlier will far outrun the note.
- Early-redemption / reinvestment risk is the dominant feature: ~72% of paths are called at the first date (month 6) and ~89% within a year, so the note typically returns cash after only ≈ 6–9 months. The realized return is a short kicker rather than a durable 5-year yield, and you must reinvest at then-prevailing rates.
- The underlying is a leveraged, decrementing momentum index (40% volatility target, −4%/year decrement). The simulation proxies it with a broad equity index, which understates its volatility and omits the 4% decrement drag — the true underlier would be materially riskier and likely to trail a plain equity index over time.
- Tail risk: if the index slides below 70% and never recovers, coupons stop; if it finishes below 85% of the starting level, investors take losses up to 85%.
- Issuer/credit risk (Morgan Stanley Finance LLC, guaranteed by Morgan Stanley); the issuer's estimated value ($938.70) is below par, reflecting embedded costs.
- Read annualized figures with the holding period: the short, path-dependent horizons inflate per-path annualized returns — pair them with the total-return (8.88%) and holding-period (~9.4 months) figures, as above.