
Morgan Stanley SPXFP Market-Linked Notes due February 4, 2031
Headline Simulation Results
| Metric | Value |
|---|---|
| Expected annualized return | 10.91% |
| Probability of a negative return | 0.00% (principal protected) |
| 99% confidence VaR (1 year) | 0.00% |
| Expected total return over the 5-year term | 76.05% |
| Median annualized return | 10.86% |
| Expected holding period | 5.0 years (fixed — held to maturity in every scenario) |
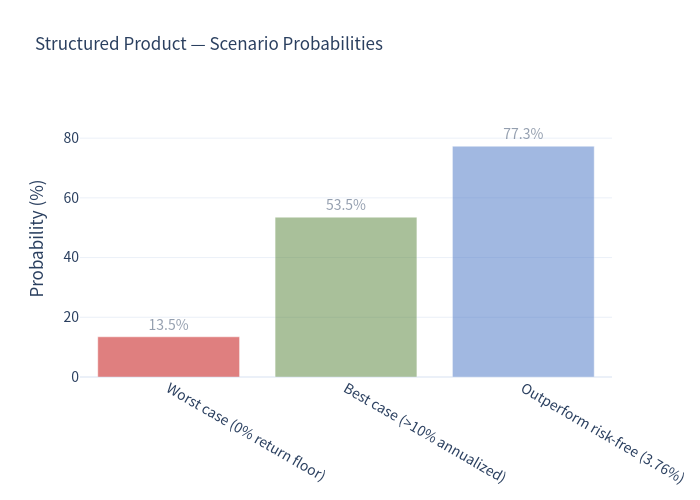
| Probability of beating the risk-free rate (3.76%) | 77.31% |
| Probability of an annualized return ≥ 10% | 53.54% |
| Probability of an annualized return ≥ 15% | 31.50% |
The note produces a non-negative return in every one of the 10,000 simulated scenarios thanks to full principal protection, while capturing 125% of the upside. The trade-off is a meaningful chance (13.47%) of simply getting your money back (a 0% five-year return) when the index finishes flat or lower.
How the Note Works (plain language)
The note is a five-year bond whose repayment is tied to the S&P 500 Futures Excess Return Index (SPXFP). You pay 100% of the notional up front and receive no interest payments.
At maturity you get back:
- Your principal if the index is flat or has fallen, or
- Principal + 125% of the index gain if the index has risen.
In formula form the redemption value is Principal × (1 + 125% × Index Return), floored at principal.
The downside is protected (subject to the issuer's credit risk); the upside is leveraged (125%) and uncapped.
Because the participation rate exceeds 100% while the downside is floored, the note's payoff at maturity is
greater than or equal to a direct investment in the index in 100% of simulated scenarios.
Key Statistics (simulated, annualized)
| Strategy | Expected annualized return | Expected annualized volatility | Probability of loss | 99% VaR (1 yr) | Expected 5-yr total return |
|---|---|---|---|---|---|
| Structured Product | 10.91% | 7.69% | 0.00% | 0.00% | 76.05% |
| Underlying — S&P 500 futures proxy (price) | 8.52% | 7.78% | 13.47% | −11.63% | 58.10% |
| Underlying — total return (+ ~0.98% dividend) | 9.50% | 7.78% | 11.15% | −10.65% | 63.00% |
| Risk-free rate (1-yr avg T-bill / repo) | 3.76% | — | — | — | — |
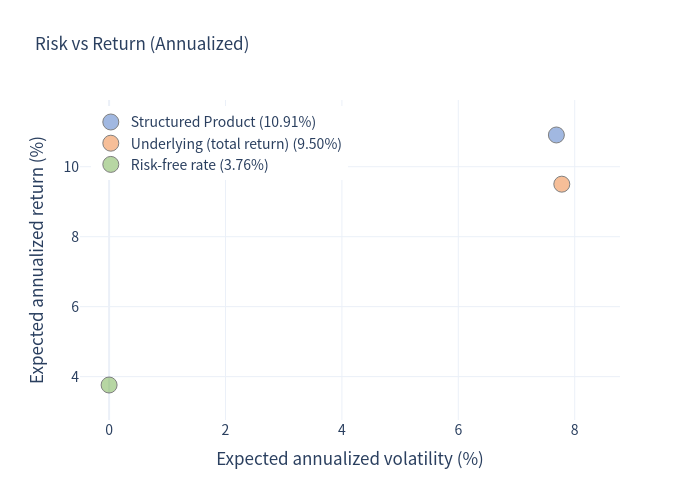
The note delivers a higher expected return than the index with slightly lower volatility, because the 125% participation leverages the upside while the floor removes the left tail.
Charts
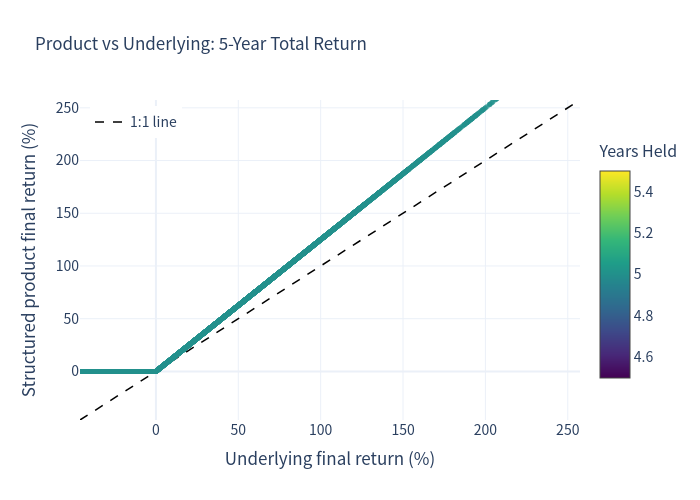
Payoff outcomes: product vs underlying (1:1 line)
Every point sits on or above the 1:1 line — the note dominates a direct index holding. All simulations end at the same horizon (5 years), so the points form a single curve: flat at 0% for index losses, then rising at 125% of the index return.
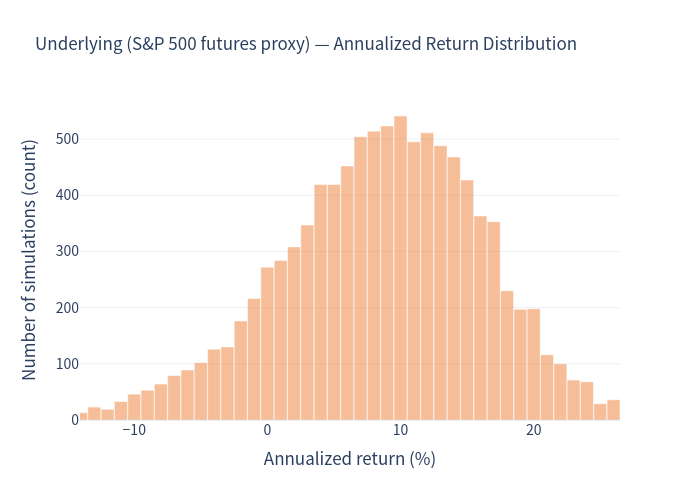
Annualized return distribution — underlying
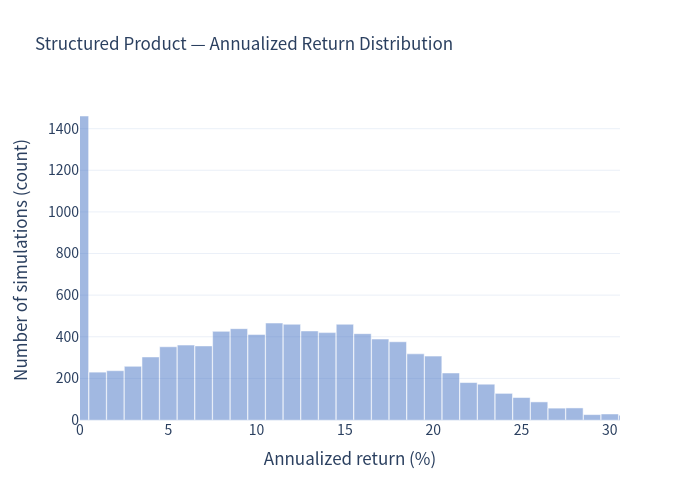
Annualized return distribution — structured product
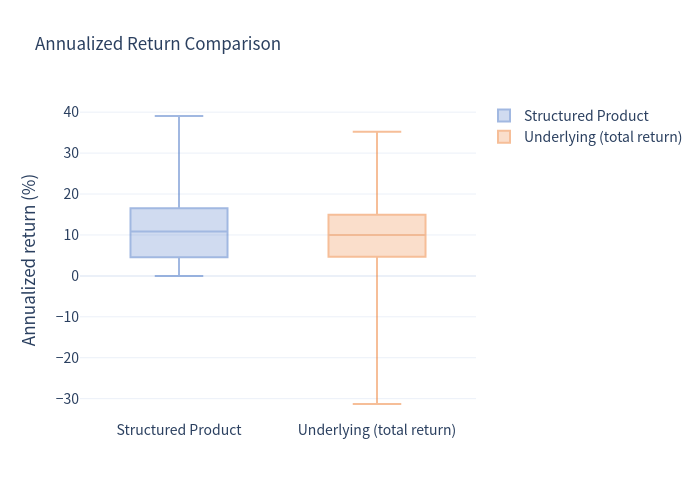
The product histogram is a "spike at zero plus a right-skewed hill": 13.47% of scenarios cluster at 0%, and the remainder spread into positive returns (median ≈ 10.9%, best ≈ 39% annualized).
Risk vs return
Annualized return comparison (box plot)
The box plot shows the product has no downside below zero — its entire distribution sits at or above 0%, whereas the underlying's 1st-percentile annualized return is about −11.6% (its 99% VaR).
Scenario probabilities
Investment Commentary
Favourable features
- Downside is fully protected at par. There are no negative-return outcomes; the 99% VaR is essentially 0% and the probability of loss is 0.00%.
- Leveraged, uncapped upside. 125% participation means the note captures more than the index gain; in the simulations the note's payoff matched or beat a direct index investment in 100% of paths.
- Equity-like return with less risk. Expected return of ~10.9% annualized with volatility (~7.7%) below that of the index itself, and a 77% chance of beating the risk-free rate.
- Meaningful upside participation. A 53.5% chance of ≥10% annualized and a 31.5% chance of ≥15% annualized.
Considerations / drawbacks
- No income and a real chance of a 0% return. The note pays no coupon; in 13.47% of scenarios the index finishes flat or lower and the investor earns 0% over five years — a large opportunity cost versus simply earning the risk-free rate.
- All-or-nothing on a single date. The return depends solely on the index level on the January 30, 2031 observation date; interim rallies can be fully given back and interim drawdowns are irrelevant.
- Capital is locked up. Principal is returned only at maturity; the notes are not exchange-listed, so secondary liquidity may be limited.
- Embedded cost at issuance. The note is offered at par ($1,000) while its estimated value is $969.90 (~3% below par).
- Issuer credit risk. Repayment depends on the creditworthiness of Morgan Stanley Finance LLC / Morgan Stanley.
- Single, futures-based index exposure. The linked index is a futures "excess return" index whose roll/financing dynamics can differ from the spot S&P 500; performance is concentrated in USD US large-cap equities.
Assumptions
- Participation rate assumed at 125% (the low end of the stated 125%–135% range, matching the issuer's own payoff table).
- Investment held to the February 4, 2031 maturity; 5-year holding period in all scenarios.
- Notional invested at par ($1,000); fees, commissions and issuer credit risk are ignored.