
info@tokenengine.ai
Structured Product Evaluation
Morgan Stanley Finance LLC — Callable Contingent Income Securities due February 3, 2028
Worst-of the Dow Jones Industrial Average, Nasdaq-100® Technology Sector Index and Russell 2000® Index
Headline Simulation Results
| Metric | Result |
|---|---|
| Expected annualized return | 10.12% |
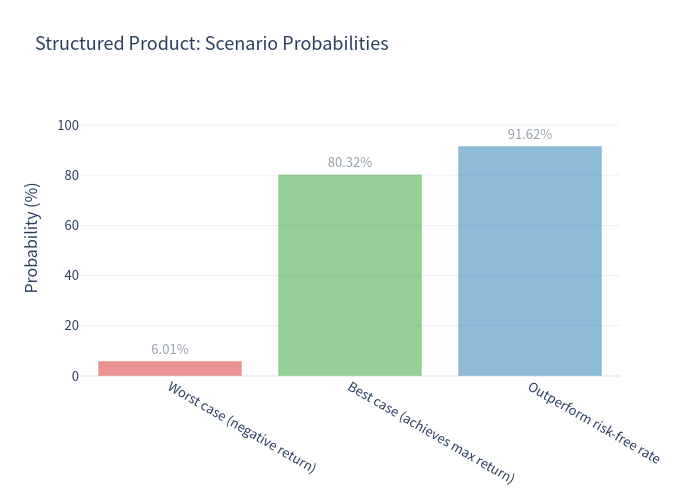
| Probability of a negative return | 6.01% |
| 99% confidence VaR (1-year) | -29.53% |
| Expected holding period | 9.10 months (~0.76 years) |
| Expected total return over the (variable) holding period | 4.71% |
| Probability of outperforming the risk-free rate (3.61%) | 91.62% |
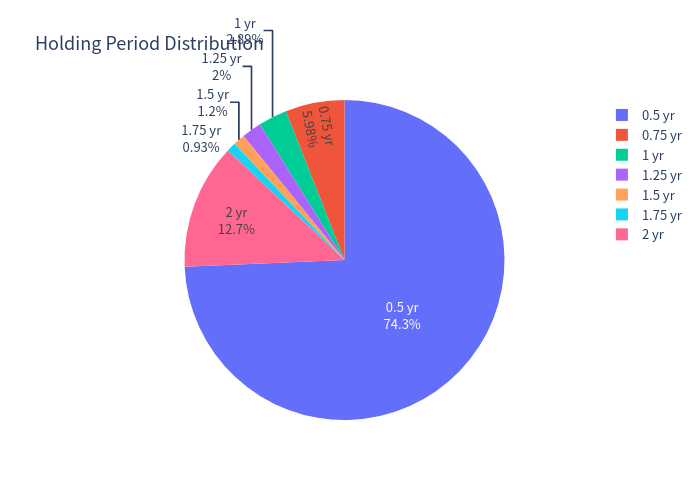
The securities offer a high, but conditional, quarterly coupon in exchange for capped upside and full downside exposure to the worst-performing of three equity indices. Because the note is callable by the issuer, the most likely outcome is an early redemption — the expected holding period is only about 9.10 months, and there is a 74.34% chance of the note being redeemed at the first call date. The expected return is driven almost entirely by the coupon stream; the modest 8.68% volatility reflects how often the note is redeemed early and returns par.
Basic Product Information
| Feature | Detail |
|---|---|
| Issuer / Guarantor | Morgan Stanley Finance LLC / Morgan Stanley |
| Underlyings | Dow Jones Industrial Average (INDU), Nasdaq-100 Technology Sector Index (NDXT), Russell 2000 Index (RTY) |
| Payoff linkage | Worst-of (a decline in any one index drives the outcome) |
| Stated principal | $1,000 per security (principal at risk) |
| Contingent coupon | 12.00%–14.00% p.a. (13.00% midpoint used; 3.25 points per quarter) |
| Coupon condition | Paid only if each index closes ≥ 80% of its initial level on the observation date |
| Downside threshold | 70% of initial level for each index (observed at maturity only) |
| Callable | Discretionary issuer call on scheduled dates from Aug 2026 (month 6) |
| Upside cap | Yes — investors do not participate in index appreciation |
| Term | ~24 months to maturity (Feb 3, 2028) |
How it works (plain language)
- Quarterly income, if the market cooperates. Every quarter, if all three indices are at or above 80% of their starting levels, you receive a coupon of about 3.25% (≈13% annualized). If any index is below 80% on that date, you receive no coupon for that quarter.
- The issuer can call the note early. Starting in August 2026, the issuer may redeem the note (at par plus any coupon due). Redemptions are not triggered mechanically by index levels; they depend on the issuer's risk-neutral valuation model.
- At maturity (if not called): if all three indices are at or above 70% of their starting levels, you get your principal back (plus the final coupon, if due). If any index ends below 70%, you lose 1% of principal for every 1% decline in the worst-performing index — the loss can be substantial and, in theory, approach 100%.
Key Statistics (simulated, annualized)
| Metric | Structured product | Benchmark (equal-weight basket, total return) |
|---|---|---|
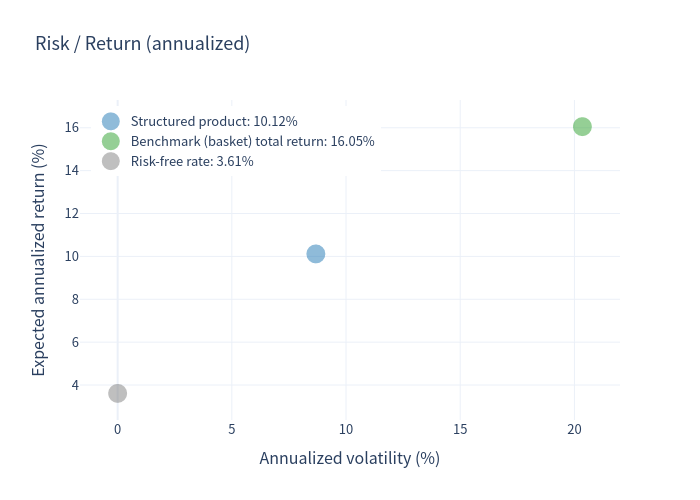
| Expected annualized return | 10.12% | 16.05% |
| Expected annualized volatility | 8.68% | 20.35% |
| Probability of loss | 6.01% | 23.47% |
| 99% confidence VaR (1-year) | -29.53% | -21.28% |
Risk-free rate used: 3.61% (1-year average of the 1-year U.S. Treasury bill rate). The benchmark is an equal-weight basket of the three underlyings and includes dividends (0.76%).
Charts
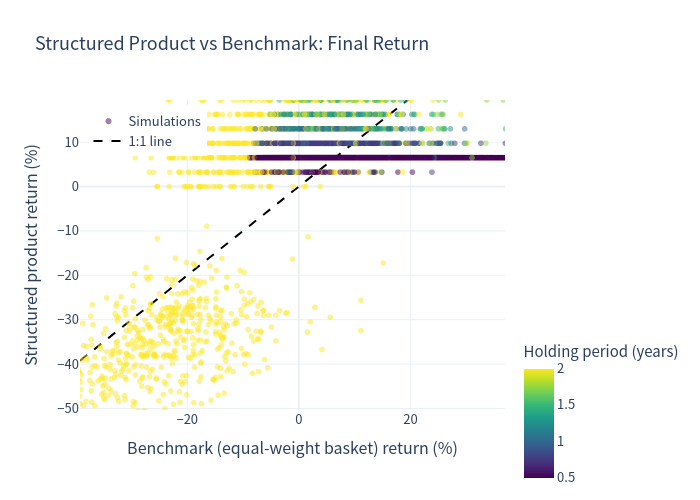
Simulation outcomes — product vs benchmark
Each point is one simulated outcome (colour = years held). Note how almost every outcome is clustered in the upper band (early redemption at a ~13% annualized coupon); the downside tail corresponds to notes that run to maturity after a worst-of decline.
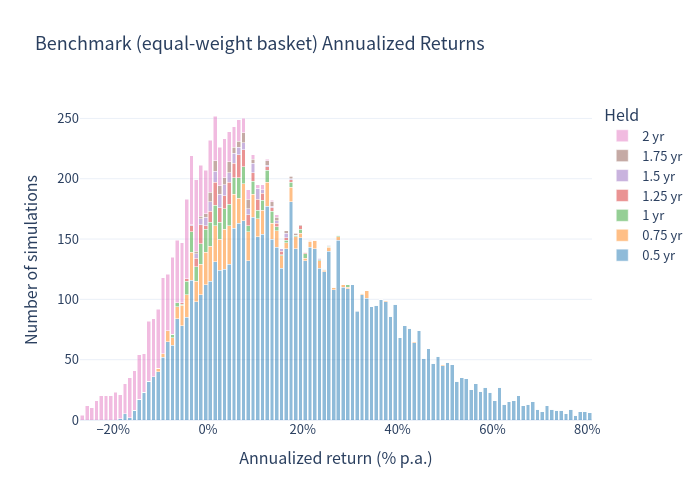
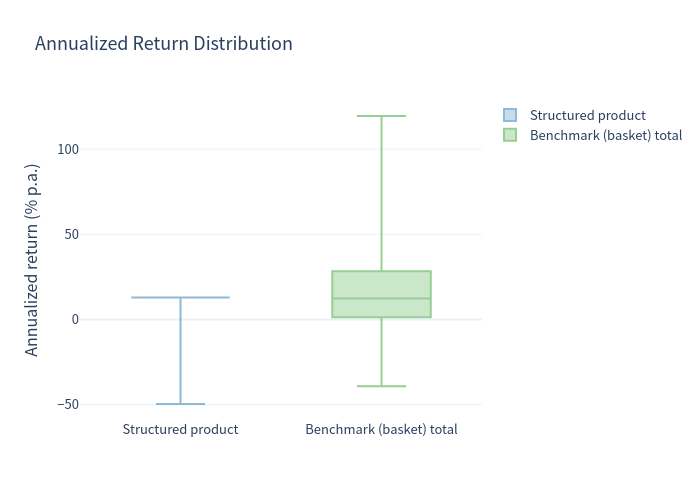
Benchmark (equal-weight basket) annualized return distribution
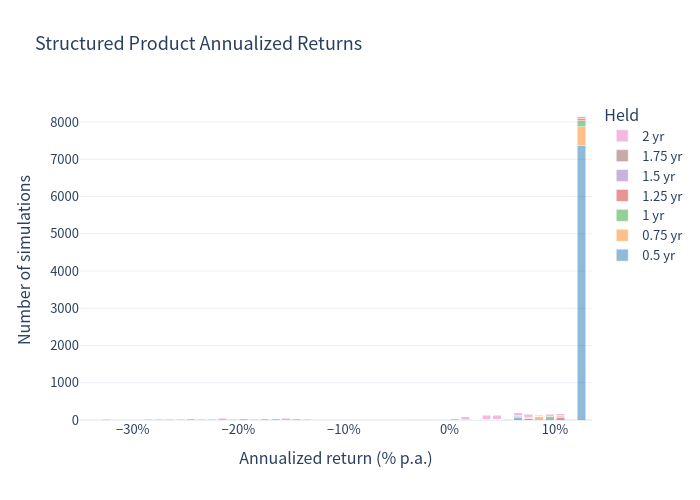
Structured product annualized return distribution
The distribution is sharply peaked at +13.00% (the coupon rate received when the note is called early), with a small but severe left tail.
Scenario probabilities
Risk / return
Annualized return — box plot comparison
Holding period distribution
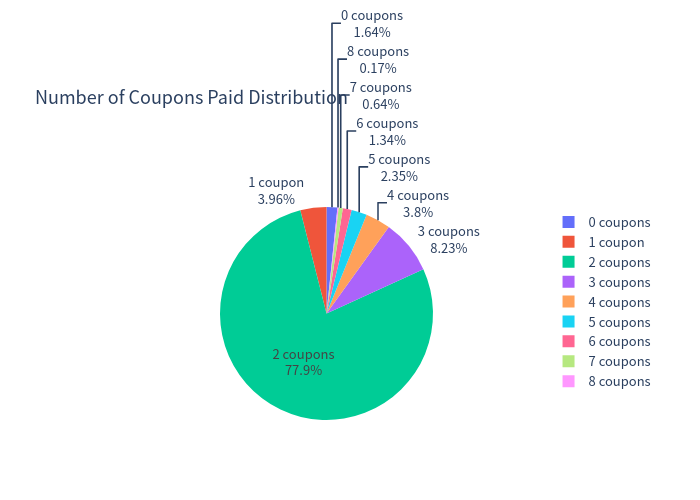
Number of coupons paid
Risk Commentary
Potential advantages
- Attractive conditional coupon. A 12.00%–14.00% annualized coupon is well above the 3.61% risk-free rate, and the note still offered a 91.62% modelled chance of beating cash.
- Downside buffer. Coupons can be earned as long as the worst index stays above 80% of its start, and principal is fully protected provided every index finishes above 70%.
- Lower realised volatility. The expected annualized volatility of the note (8.68%) is far below that of the underlying basket (20.35%), because the coupon and the early-call feature smooth the return profile for most outcomes.
- Frequent income. 98.36% of simulated paths received at least one coupon (expected 2.25 coupons over the note's life).
Risks and drawbacks
- Capped upside. Investors never participate in index gains; the maximum annualized return is essentially the coupon rate (~13%), even if the indices rise sharply.
- Worst-of exposure. A large decline in any one index can eliminate coupons and trigger principal loss; the three indices offer no diversification benefit by design.
- Principal at risk / severe tail. There is a 6.01% modelled probability of a negative return and a 99% VaR of -29.53% — a deeper tail than the equal-weight basket's -21.28%, because the loss is indexed to the single worst performer.
- Reinvestment / call risk. With an expected life of only ~9.10 months and a ~74.34% chance of being called at the first date, the high coupon may not persist; the issuer redeems precisely when the note is valuable.
- Credit risk. Payments depend on Morgan Stanley's ability to pay.
Notes and Assumptions
- The coupon is contingent on all three indices being at or above their coupon barrier on each observation date (an "all-of" test), while the maturity payoff and redemption-linked protection reference the worst performer.
- The issuer's call is discretionary (driven by its risk-neutral valuation model, not by index performance). It is modelled as occurring on the first redemption date on which the note's risk-neutral continuation value exceeds par (i.e., when redeeming is economically rational for the issuer). A hold-to-maturity (no-call) sensitivity produces an expected annualized return of about 7.95% and a loss probability of about 11.00%, confirming that the call feature both shortens the life and raises the modelled return.
- Simulation horizon: 24 monthly steps; 10,000 paths per underlier (correlated, fat-tailed). Figures are model estimates, not guarantees.