
Structured Product Analysis
1. Headline Simulation Results
| Metric | Result |
|---|---|
| Expected annualised return | 8.59% |
| Probability of a negative (annualised) return | 8.85% |
| 99% confidence VaR (1‑year) | −11.50% |
| Expected holding period | 17.7 months (≈1.47 years) |
| Expected total return over the realised holding period | 12.11% |
| Probability of outperforming the risk‑free rate (2.10%) | 90.48% |
2. Product Overview
What it is. A two‑year, EUR‑denominated Multi Barrier Reverse Convertible linked to the worst‑of performance of three Swiss blue chips — Nestlé, Novartis and Roche. It pays a fixed 10.40% p.a. coupon (EUR 26 per EUR 1,000, quarterly) and offers conditional capital protection.
How it works (plain language)
- Coupons are paid regardless of how the shares perform, at each quarter‑end, so long as the Note is still alive.
- Capital protection is conditional. As long as none of the three shares ever trades at or below 69% of its starting level at any time during the two‑year life (the barrier, observed continuously), the investor gets the full EUR 1,000 back at maturity.
- If the barrier is touched, protection is lost. At maturity the investor still receives par if the worst‑performing share has finished at or above its starting level; otherwise the investor receives that worst‑performing share's actual (lower) performance — i.e., the full downside is borne by the investor.
- The Issuer may call the Note early (quarterly, from month 12) at par plus the coupon due. Because the structure has no upside participation (maximum redemption is par), early calls simply stop the coupon stream once the trade has moved in the Issuer's favour.
- Quanto EUR: the shares are CHF‑traded but all amounts are settled in EUR with no FX exposure to the investor.
3. Key Statistics — Structured Product vs Underlying
(Underlying = equal‑weight basket of Nestlé, Novartis and Roche, shown on a total‑return basis, including ~3.31% average dividend yield. Both series are annualised over each simulation's realised holding period.)
| Metric | Structured Product | Underlying Basket (total return) |
|---|---|---|
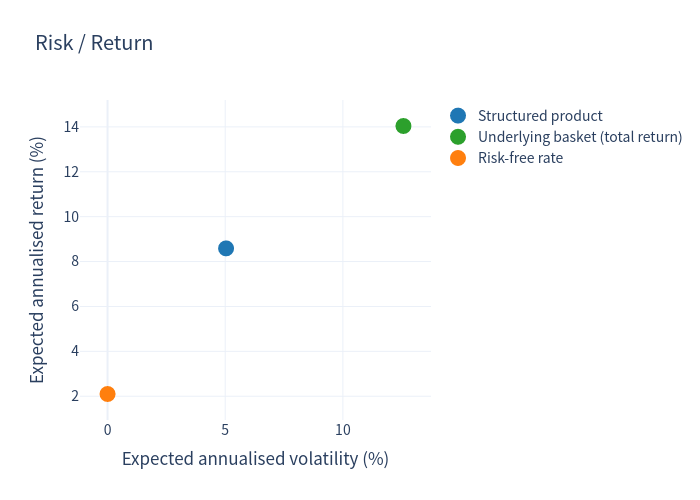
| Expected annualised return | 8.59% | 14.04% |
| Expected annualised volatility | 5.04% | 12.57% |
| Probability of loss | 8.85% | 12.69% |
| 99% confidence VaR (1 year) | −11.50% | −11.50% |
The Note delivers roughly 61% of the basket's (flattered) expected return for about 40% of its volatility, at the cost of a heavy left tail (worst simulated outcome ≈ −41% total return, versus the Note's capped best case of +20.8% total return).
4. Charts
4.1 Simulation outcomes — product vs underlying
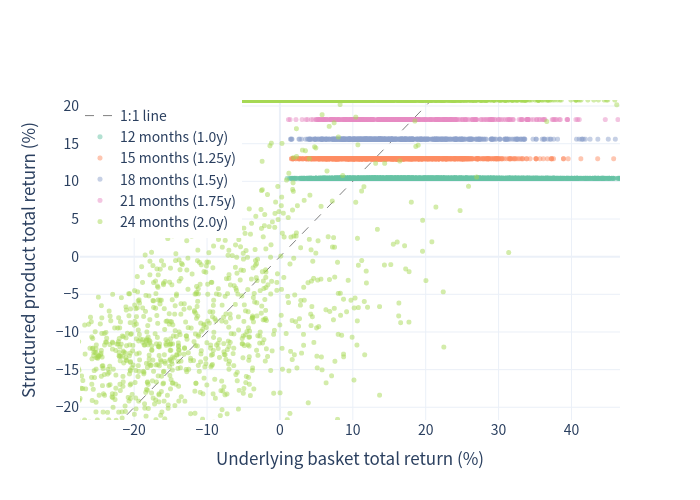
Each point is one simulation; the diagonal is the 1:1 line. Points sit above the line for the large majority of outcomes (the Note benefits from its coupon and early call), while a minority cluster below the line where the barrier was breached and the worst share finished below its starting level.
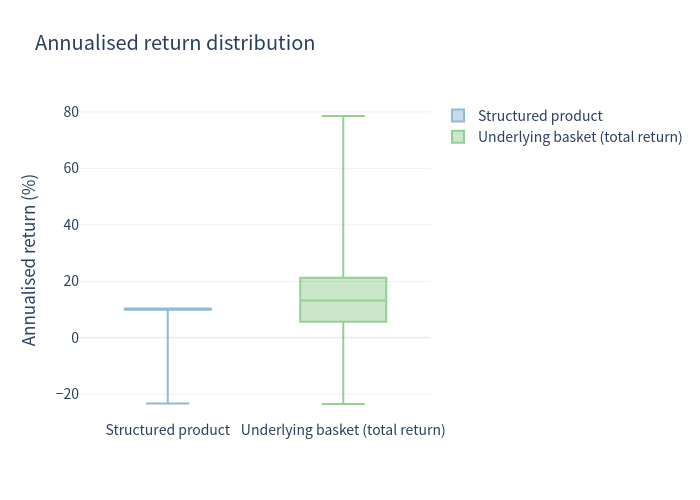
4.2 Distribution of annualised returns
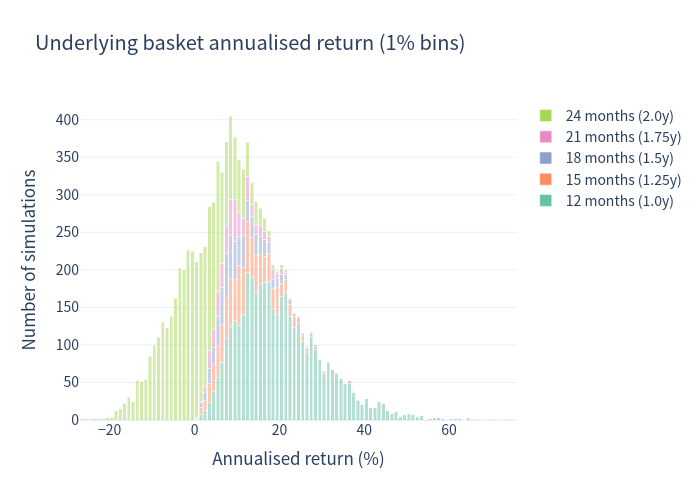
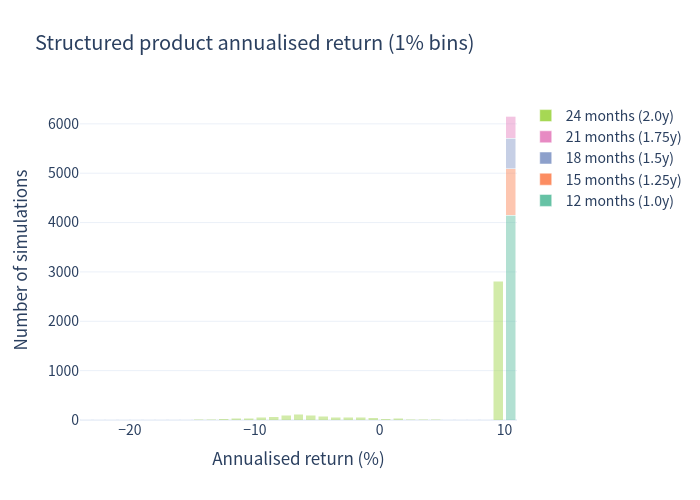
The product's returns are tightly bunched between roughly 0% and 10.4%, with a small spill‑over into negative territory (the barrier‑loss paths). The underlying distribution is far wider and noticeably right‑skewed.
4.3 Scenario probabilities
| Scenario | Probability |
|---|---|
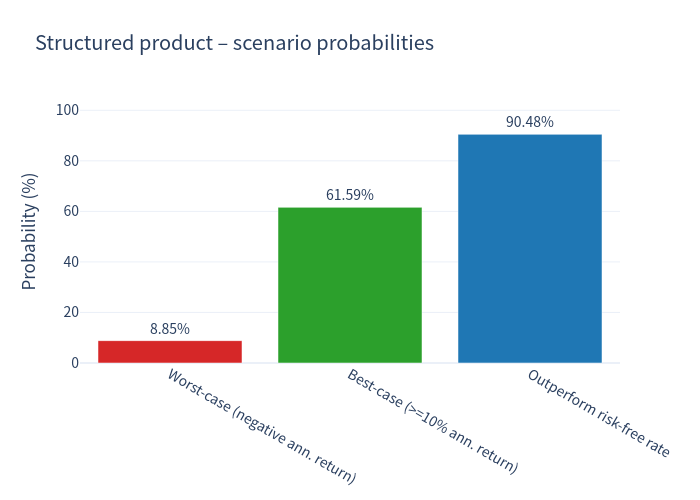
| Worst case (negative annualised return) | 8.85% |
| Best case (≥10% annualised return) | 61.59% |
| Outperform the risk‑free rate (2.10%) | 90.48% |
4.4 Risk / return
4.5 Annualised return distribution — box plot
4.6 Holding period and coupon outcomes
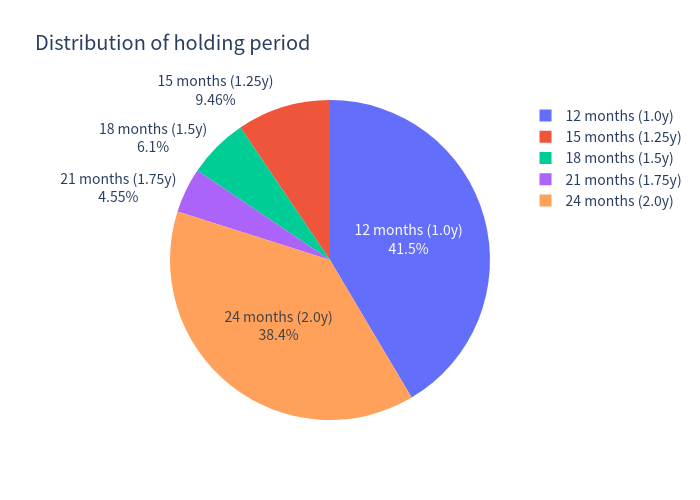
Holding period is variable (12–24 months) because of the Issuer's call. About 62% of paths are called early, most commonly at the first call date (month 12).
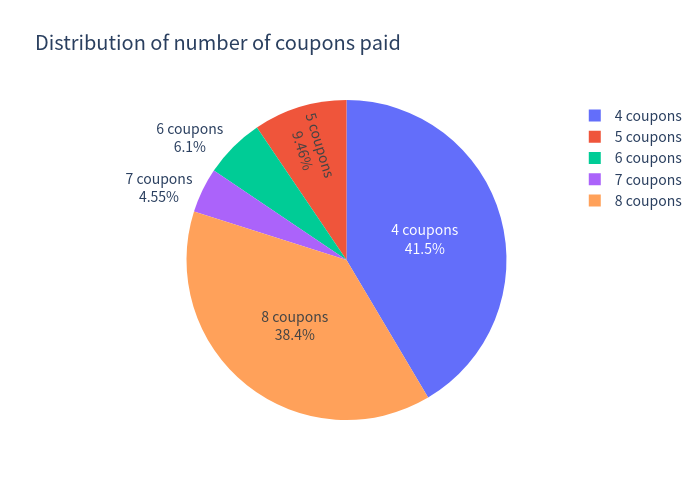
The Note pays on average 5.9 of the 8 scheduled coupons (≈15.3 index points), reflecting the frequency of early redemption.
5. Investment Commentary
Strengths
- High, paid‑regardless coupon: 10.40% p.a. (EUR 26 quarterly) — paid even if the shares fall, as long as the Note is alive.
- Substantial buffer before losses bite: the 69% barrier means the worst‑of must fall more than 31% before the investor is exposed to capital loss.
- Diversification across defensive names: the barrier references the worst of three large‑cap staples/pharma names rather than a single stock.
- Quanto EUR: removes currency risk for a EUR‑based investor.
- Favourable risk‑adjusted profile in simulation: ~8.6% expected annualised return at ~5% volatility (a Sharpe‑like ratio of ≈1.3 versus the basket's ≈0.95).
Points to weigh
- No upside participation: redemption is capped at par, so a strong rally only brings an early call, not a higher return.
- Issuer call caps the coupon stream: the best annualised outcome (~10.4%) occurs when the Note is called at month 12; a full 24‑month hold yields ~9.9% annualised.
- Concentrated downside tail: once the 69% barrier is touched and the worst share finishes below its starting level, the investor bears the full decline of that share — the worst simulated outcome was ≈ −41% total return.
- Issuer/guarantor credit risk (Leonteq / PostFinance) is embedded in the payoff.
- Pricing assumptions: the expected return depends on the modelled issuer call behaviour; a more aggressive call policy would lower the investor's expected coupon income.
Figures are the output of a 10,000‑path Monte‑Carlo simulation of the underlying price indices. Returns are shown in percent; values are in EUR index points (100 = initial). Past or simulated performance is not indicative of future results.