
Morgan Stanley Worst-of INDU, NDX and RTY
Dual Directional Buffered PLUS
| Metric | Structured Product | Worst-of Underlying (w/div) |
|---|---|---|
| Expected Annualized Return | 6.81% | 4.59% |
| Annualized Volatility | 8.51% | 8.59% |
| Probability of Negative Return | 18.50% | 28.78% |
| 99% Confidence VaR (1-year) | -11.20% | -16.63% |
| Expected Holding Period | 5 years | 5 years |
- The structured product offers enhanced upside participation (136% leverage) when the worst-performing underlying appreciates
- Provides a 20% buffer against declines with 100% absolute return participation in the buffer zone
- Significantly reduces the probability of loss compared to direct investment in the worst-of underlying basket (18.50% vs 28.78%)
- Improves the 99% VaR by over 5 percentage points (-11.20% vs -16.63%)
How It Works
This "Dual Directional Buffered PLUS" is a 5-year structured product linked to the worst-performing of three major US equity indices: the Dow Jones Industrial Average (INDU), the Nasdaq-100 Index (NDX), and the Russell 2000 Index (RTY).
At maturity, the payoff depends on which scenario applies for the worst-performing index:
If the worst index appreciates, investors receive 136% of that appreciation.
Example: worst index up 10% → payoff = 113.6% of principal
If the worst index declines by up to 20%, investors receive the absolute value of that decline as a positive return.
Example: worst index down 15% → payoff = 115% of principal
If the worst index falls more than 20%, investors lose 1% for every 1% decline beyond 20%, with a maximum loss of 80%.
Example: worst index down 50% → payoff = 70% of principal
The product does not pay any interest or coupons during its term and has no early redemption features.
Key Terms
| Issuer | Morgan Stanley Finance LLC (guaranteed by Morgan Stanley) |
| Underlyings | Dow Jones Industrial Average (INDU), Nasdaq-100 Index (NDX), Russell 2000 Index (RTY) |
| Payoff Structure | Worst-of (depends on the poorest performing underlying) |
| Term | 5 years (May 2026 – May 2031) |
| Leverage Factor | 136% |
| Buffer Level | 20% |
| Maximum Loss | 80% of principal |
| Coupons | None |
| Early Redemption | None |
Structured Product Performance
| Metric | Value |
|---|---|
| Expected Total Return (5-year) | 48.16% |
| Expected Annualized Return | 6.81% |
| Median Annualized Return | 5.54% |
| Annualized Volatility | 8.51% |
| Probability of Loss | 18.50% |
| 99% VaR (1-year) | -11.20% |
| Probability of Outperforming Risk-Free Rate (3.72%) | 56.39% |
Underlying Performance Comparison
| Metric | Worst-of (Price) | Worst-of (TR) |
|---|---|---|
| Expected Annualized Return | 3.66% | 4.59% |
| Annualized Volatility | 8.94% | 8.59% |
| Probability of Loss | 32.41% | 28.78% |
| 99% VaR (1-year) | -18.84% | -16.63% |
Payoff Scenario Distribution
| Scenario | Probability |
|---|---|
| Upside (Leveraged appreciation) | 67.6% |
| Buffer Zone (Absolute return on decline up to 20%) | 13.9% |
| Downside (Loss beyond 20% buffer) | 18.5% |
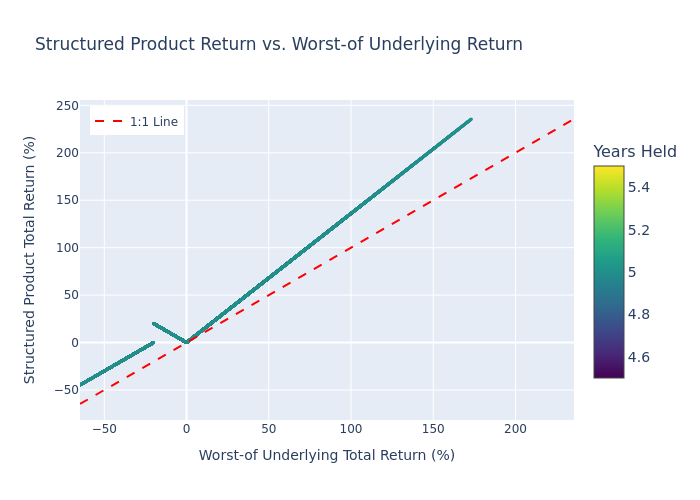
Scatter Plot: Structured Product Return vs Worst-of Underlying Return
The scatter plot compares each simulation's outcome. Points above the 1:1 line indicate the structured product outperformed the underlying; points below indicate underperformance. The product is always held to maturity (5 years).
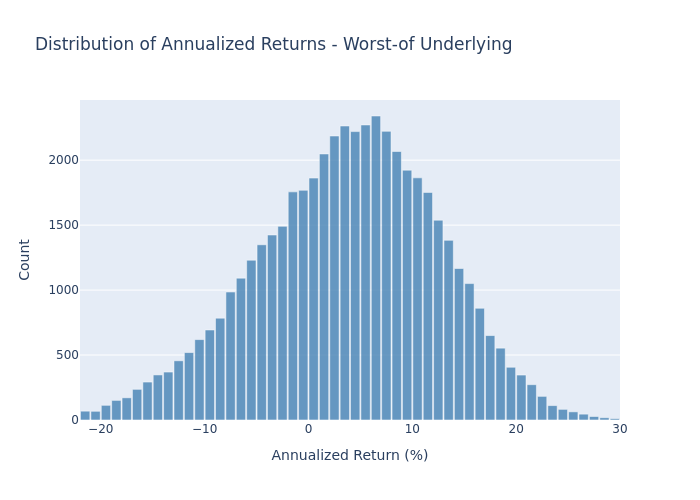
Histogram: Annualized Returns — Worst-of Underlying
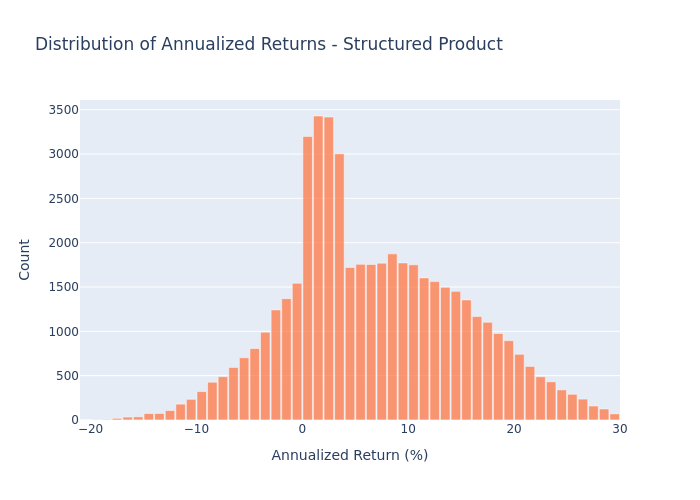
Histogram: Annualized Returns — Structured Product
The structured product histogram shows a right-skewed distribution with reduced probability of negative returns compared to the underlying, reflecting the buffer protection and leveraged upside.
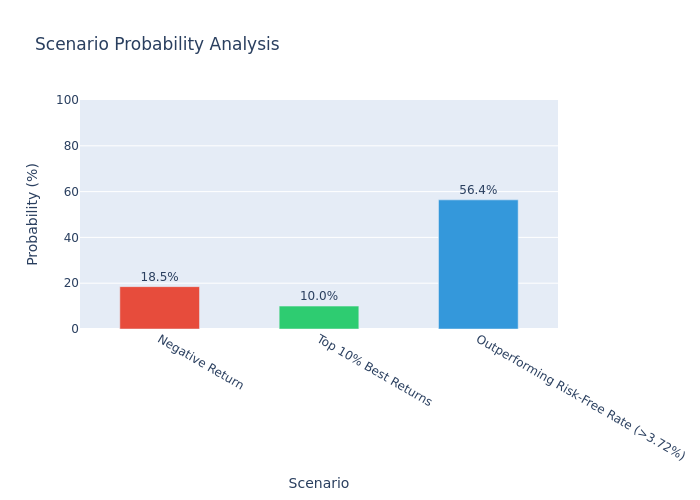
Scenario Probability Analysis
The structured product has an 18.50% probability of negative return, a 10% probability of being in the top decile of outcomes, and a 56.39% probability of outperforming the risk-free rate of 3.72%.
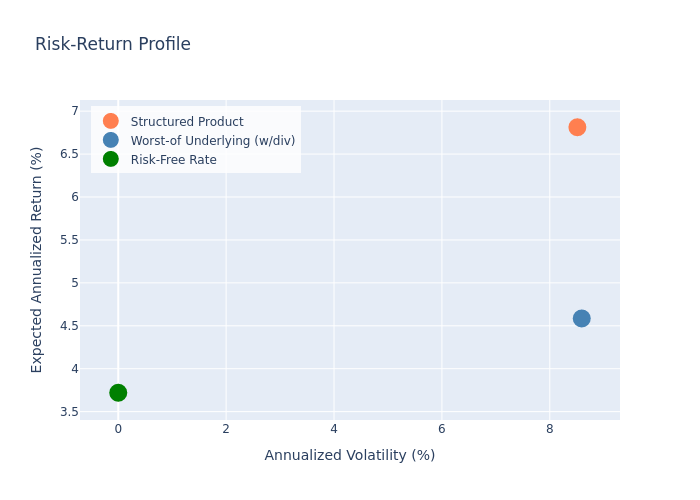
Risk-Return Profile
The structured product offers higher expected return (6.81%) than both the underlying with dividends (4.59%) and the risk-free rate (3.72%), with similar volatility to the underlying.
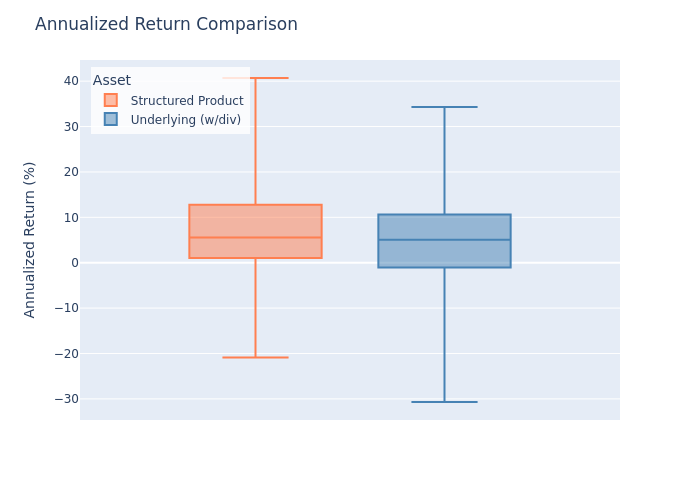
Box Plot Comparison
The box plot shows the structured product has a higher median return and a narrower interquartile range compared to the underlying with dividends, indicating a more favorable risk-return profile.
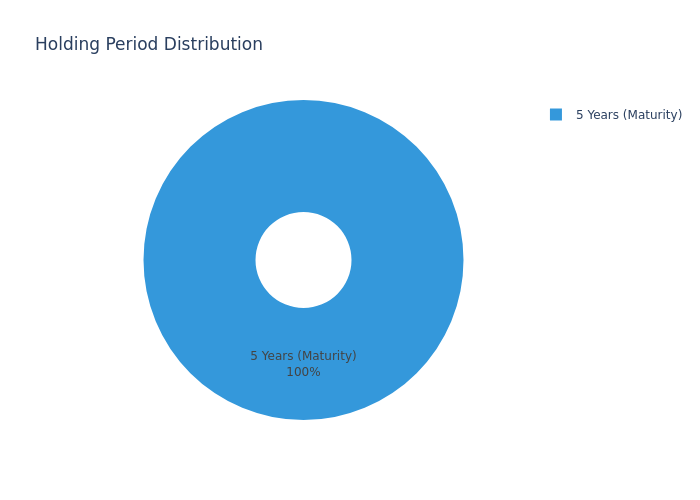
Holding Period Distribution
All simulations are held to the full 5-year maturity as the product has no early redemption feature.
Pros
- Enhanced upside participation: 136% leverage provides amplified returns when the worst-performing underlying appreciates
- Downside buffer: First 20% decline is protected with 100% absolute return participation, turning small declines into positive returns
- Improved risk profile: Expected annualized return of 6.81% significantly exceeds the risk-free rate of 3.72%
- Reduced loss probability: 18.50% probability of loss vs 32.41% for the worst-of underlying basket
- Lower tail risk: 99% VaR of -11.20% compared to -18.84% for the underlying
Cons
- Worst-of structure: Exposure to the worst-performing index increases risk compared to a single-index product
- Maximum loss of 80%: In severe market downturns, investors could lose up to 80% of principal
- No income: The product pays no interest or coupons during its 5-year term
- No early liquidity: No early redemption feature; investors are locked in for the full 5-year term
- Credit risk: Subject to the creditworthiness of Morgan Stanley Finance LLC and Morgan Stanley