
Morgan Stanley Worst-of INDU and SPX Market-Linked CDs
Headline Simulation Results
| Metric | Value |
|---|---|
| Expected annualized return | 4.83% |
| Probability of negative return | 0.00% |
| 99% confidence VaR (1 year) | 0.00% |
| Expected holding period | 5.0 years (held to maturity) |
Basic Product Information
- Type: Market-Linked Certificate of Deposit (CD), issued by Morgan Stanley Bank, N.A. (CUSIP 61779WAU4)
- Underlyings: Dow Jones Industrial Average (INDU) and S&P 500 Index (SPX) — worst-of payoff
- Term: Pricing Aug 26, 2026 → Maturity Aug 29, 2031 (~5 years); single observation on Aug 26, 2031
- Currency / Denomination: USD; $1,000 per CD
- Coupon / Interest: None — the CDs do not pay interest
- Early redemption: None — the CDs are designed to be held to maturity
- Upside: 100% participation, capped at the maximum payment at maturity ($1,420–$1,470 per CD; 42%–47% cap)
- Downside protection: Principal protected at maturity regardless of underlier performance
How It Works (in plain terms)
At maturity, the CD looks at which of the two indices (Dow Jones or S&P 500) performed worse over the 5-year term, measured from the pricing date to the observation date:
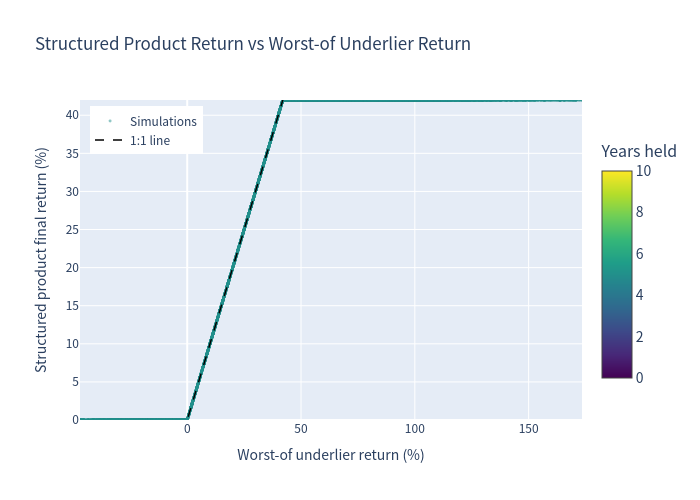
- If the worse index is up by less than the cap (~42%), you earn 100% of that gain (e.g., +20% worst index → receive $1,200 per CD).
- If the worse index is up by more than the cap, your gain is capped (e.g., +60% worst index → still receive only the maximum payment, $1,420 per CD).
- If the worse index is flat or down, you simply get your $1,000 back — no loss of principal at maturity.
There is no interest paid along the way, and the upside is limited. The product's weakness is that it depends on the weaker of the two indices — both must rise for you to participate.
Key Statistics
| Metric | Structured Product | Benchmark (50/50 INDU–SPX basket, total return) |
|---|---|---|
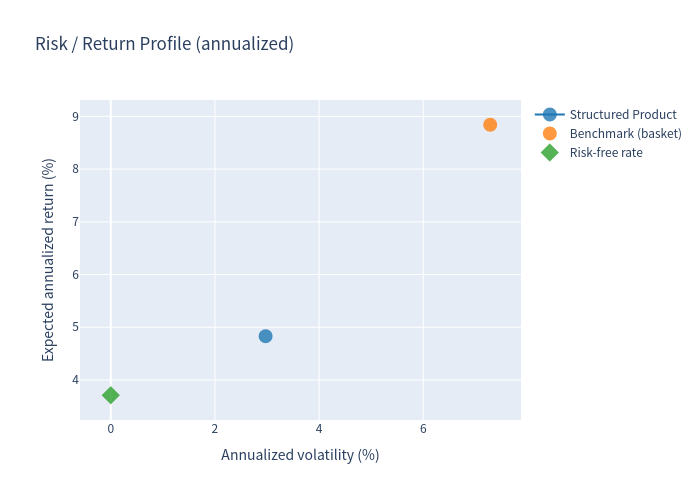
| Expected annualized return | 4.83% | 8.84% |
| Expected annualized volatility | 2.97% | 7.29% |
| Probability of loss | 0.00% | 11.89% |
| 99% VaR (1 year) | 0.00% | −9.04% |
| Expected total return (holding period) | 27.60% | 51.14% |
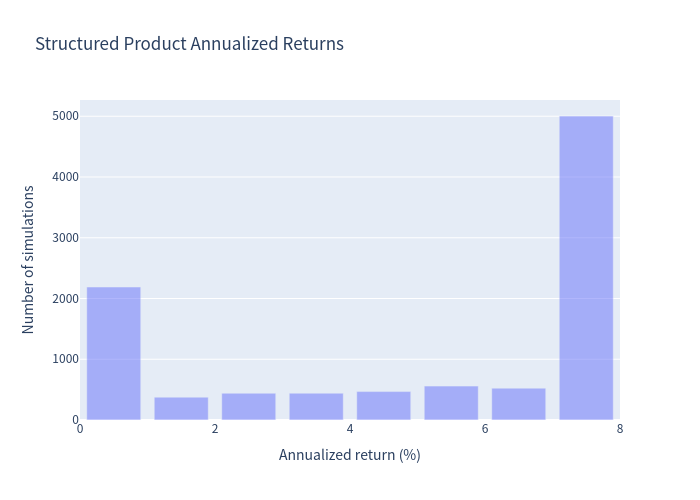
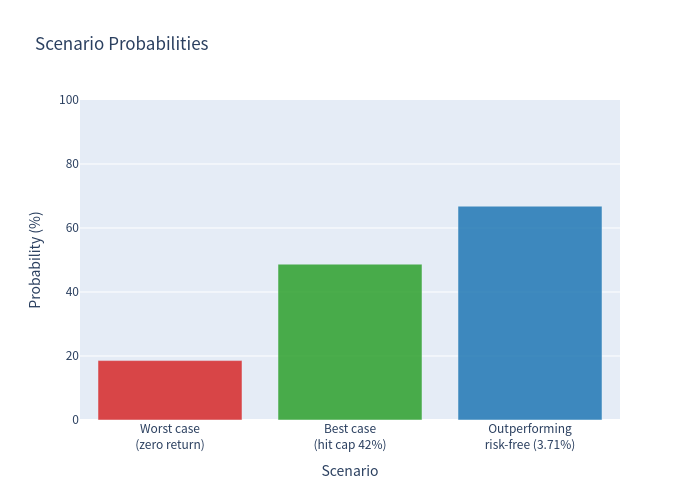
- Structured product: median total return 40.32%; capped at +42.00%; 48.70% of simulations hit the cap; 18.57% return only par (zero gain).
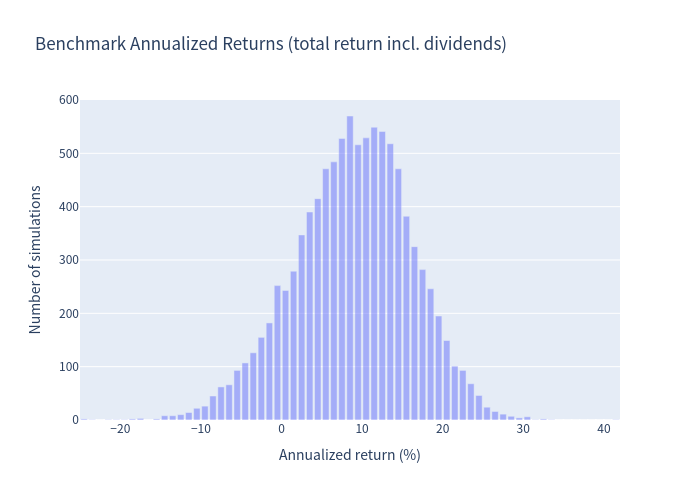
- Benchmark (equal-weight basket of the two indices): simulated price-return growth with an estimated average dividend yield of ~1.19% added for comparison. The benchmark carries meaningful downside (11.89% probability of loss) whereas the CD does not.
- Cap sensitivity: with the maximum payment set at $1,470 (47% cap) instead of $1,420 (42% cap), the expected annualized return rises to ~5.18%.
Charts
Simulation Outcomes: Product Return vs Worst-of Underlier Return
Scatter of simulated holding-period returns for the structured product against the worst-of underlier return.
Annualized Return Distribution — Underlying Benchmark (incl. dividends)
Distribution of simulated annualized returns for the 50/50 INDU–SPX equal-weight benchmark, including estimated dividends.
Annualized Return Distribution — Structured Product
Distribution of simulated annualized returns for the structured product, reflecting principal protection and the upside cap.
Scenario Probabilities
Probability of each payoff scenario for the structured product (return only par, partial gain, and capped gain).
Risk / Return Profile
Risk-return positioning of the structured product relative to the underlying benchmark.
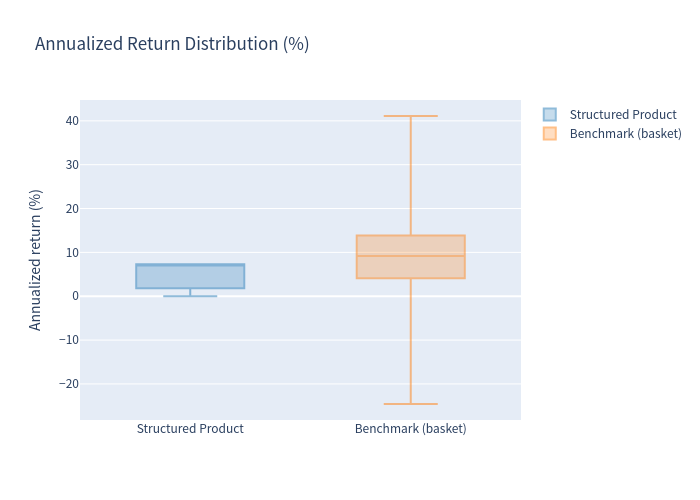
Annualized Return Comparison (Box Plot)
Distribution comparison of annualized returns between the structured product and the underlying benchmark.
Investment Commentary
Key characteristics to note:
- Downside protection: The CD guarantees return of principal at maturity (subject to issuer credit and FDIC insurance limits), so the simulated probability of a negative return is 0% and the 99% VaR is 0%. This is the product's defining feature.
- Predictable, low-volatility outcome: Annualized return volatility is only ~2.97%, with outcomes clustered between 0% and the cap.
- Capped upside: The maximum gain is 42%–47% over 5 years (~7.3% annualized at the cap). The simulated expected annualized return of 4.83% sits comfortably above the ~3.71% risk-free rate in ~67% of scenarios.
- Worst-of structure: Participation requires both indices to rise; the simulated expectation is dragged down because the weaker index drives the payoff. The equal-weight basket benchmark is expected to deliver meaningfully higher returns (8.84% annualized) but with substantial downside risk.
- No interim income: The CD pays no interest/coupon, so the entire return (if any) is realized at maturity.
- Estimated value below par: The estimated value of $945.40 per CD is below the $1,000 deposit amount, reflecting structuring costs and the cost of the embedded protection.