
Morgan Stanley SPXFP Callable Jump Notes due August 29, 2031
Headline Simulation Results
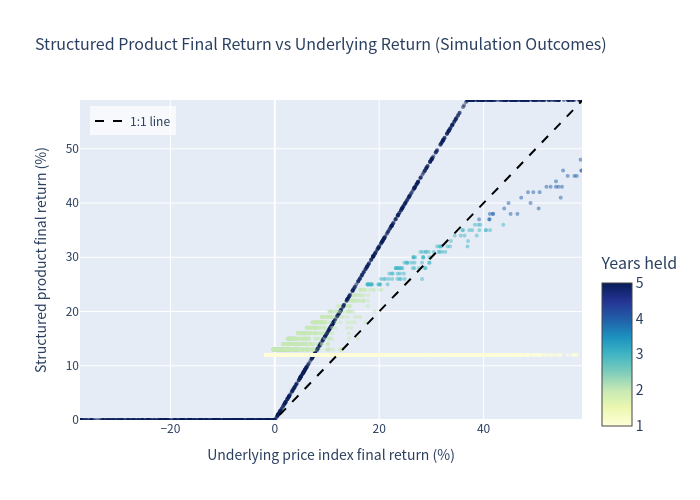
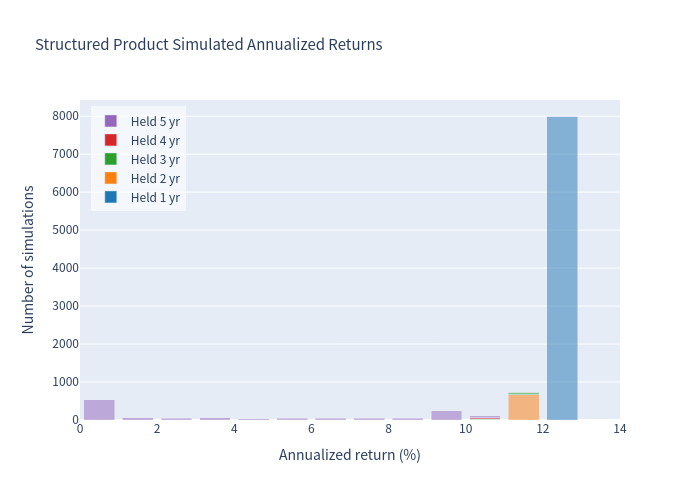
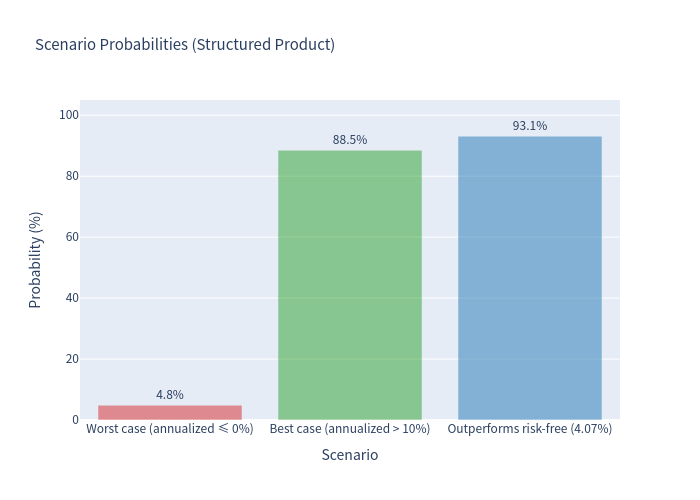
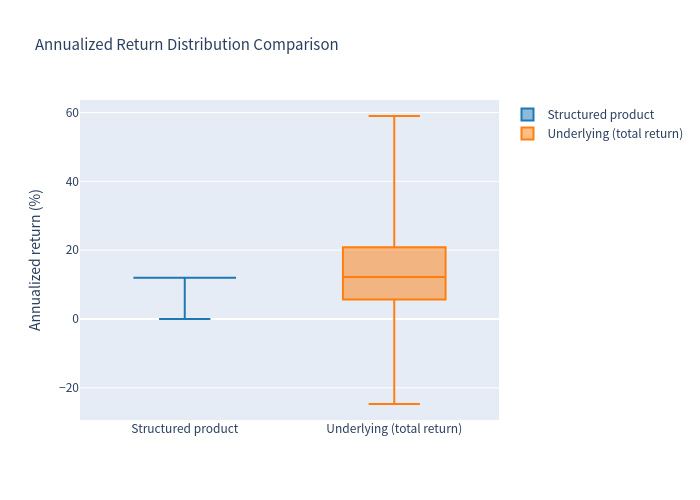
The note delivered a non-negative return in 100% of simulated scenarios — the worst simulated outcome was repayment at par ($1,000 per note, i.e., a 0% total return). Because the note is typically redeemed early (80% of simulations end in the first year at a fixed redemption amount of $1,120), total returns are modest but the holding period is short; the annualized figures above should be read together with the expected holding period. About 4.83% of simulations (mostly notes held to maturity with a flat/falling index) produce a near-zero annualized return.
Basic Product Information
| Issuer / Guarantor | Morgan Stanley Finance LLC / Morgan Stanley |
|---|---|
| Underlying (per term sheet) | S&P 500® Futures Excess Return Index (SPXFP) |
| Benchmark used in this analysis | S&P 500 index total return (incl. dividends) — used as proxy for SPXFP, which is not directly available on public data feeds |
| Issue / Maturity | Aug 26, 2026 → Aug 29, 2031 (5 years) |
| Currency | USD |
| Coupon | None (no interest payments) |
| Upside participation | 160% (uncapped at maturity) |
| Downside protection | Full principal protection at maturity |
| Call feature | Issuer-callable monthly from Aug 2027; fixed redemption payments $1,120 → $1,590 |
How it works (layman's explanation)
- You buy the note at $1,000. The note tracks the S&P 500 Futures Excess Return Index (an index of S&P 500 futures performance, net of the risk-free return on collateral).
- The note pays no coupons.
- If the index rises: at maturity you receive $1,000 + 160% of the index gain (e.g., +20% index → $1,320; +40% → $1,640). Upside is uncapped.
- If the index falls or is flat: at maturity you still receive your full $1,000 principal back (principal protected).
- Early redemption (the "call"): Morgan Stanley has the right to redeem the note early on any monthly redemption date, paying a fixed amount that increases from $1,120 (12 months after issue) by $10 per month up to $1,590 (month 59). The issuer exercises this right when a risk-neutral valuation model shows it is economically rational to do so — in practice, when the note's value exceeds the fixed redemption payment. In our simulation this happens when the index has performed well, so early redemptions lock in gains of roughly 12% (year 1) to 24% (year 2).
Key Statistics (Simulation)
| Metric | Structured Product | Benchmark (S&P 500 total return, incl. dividends) |
|---|---|---|
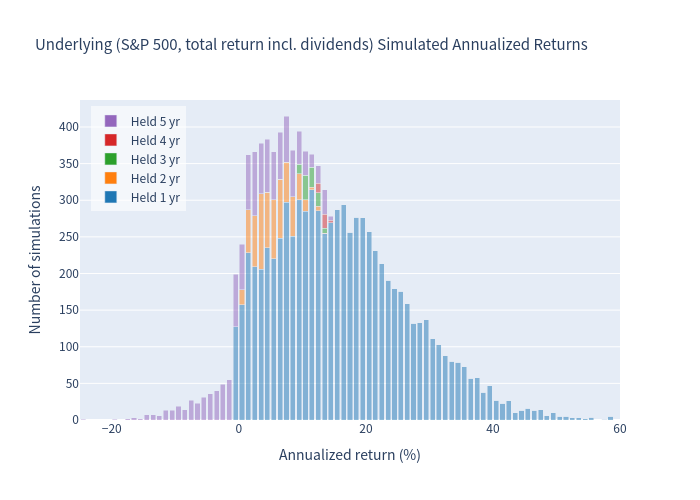
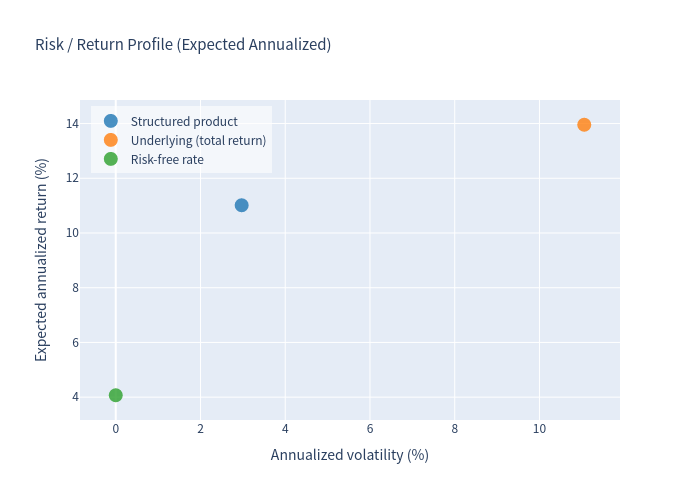
| Expected annualized return | 11.01% | 13.96% |
| Expected annualized volatility | 2.97% | 11.06% |
| Probability of loss | 0.00% | 5.48% |
| 99% VaR (1 year) | 0.00% | −7.50% |
The structured product offers a meaningfully lower expected return than a direct S&P 500 investment, but with dramatically lower risk: essentially zero downside on contractual payments (principal protection) and much lower volatility, because most outcomes are fixed redemption amounts rather than market-linked returns.
Holding-period outcomes
| Holding period | Share of simulations | Mean total return | Mean annualized return |
|---|---|---|---|
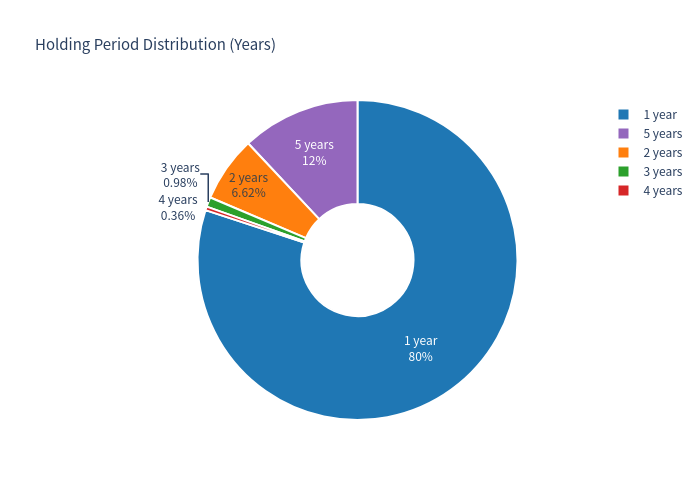
| 1 year | 80.0% | 12.00% | 12.00% |
| 2 years | 6.6% | 15.38% | 11.81% |
| 3 years | 1.0% | 29.34% | 11.10% |
| 4 years | 0.4% | 42.47% | 10.52% |
| 5 years (maturity) | 12.0% | 23.13% | 4.00% |
Charts
Simulation Outcomes Scatter
Scatter plot of simulated outcomes for the structured product versus the underlying index.
Benchmark Annualized Returns
Histogram of annualized returns for the S&P 500 total return benchmark.
Product Annualized Returns
Histogram of annualized returns for the structured product.
Scenario Probabilities
Probability of each simulated scenario category for the note.
Risk / Return Profile
Risk-return positioning of the structured product relative to the direct index investment.
Annualized Return Box Plot
Distribution of annualized returns for the product versus the benchmark.
Holding Period Distribution
Share of simulations ending at each holding period (early redemption or maturity).
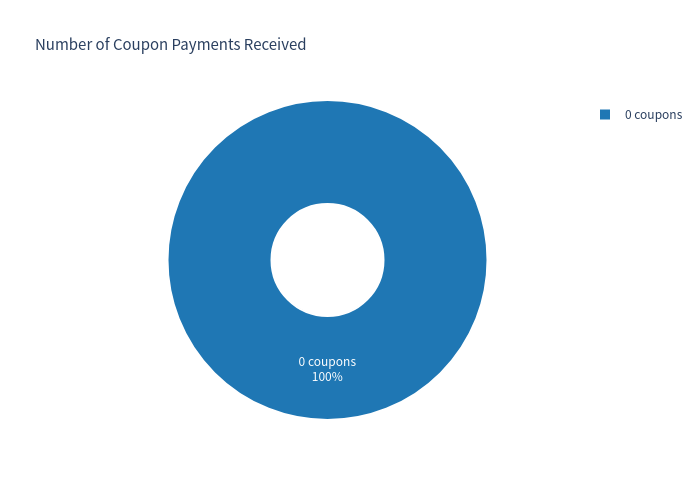
Coupons Received
Distribution of coupon payments received across simulated scenarios.
Investment Commentary
Strengths
- Full downside protection on contractual payments: the note never pays less than par at maturity or on redemption, regardless of how far the S&P 500 index falls — 0% probability of loss in simulation.
- Attractive early-redemption yields: when the issuer calls (the most common outcome, 80% in year 1), the investor earns 12% in the first year — a fixed return well above the ~4.07% risk-free rate.
- High certainty of outperforming cash: the note beat the risk-free rate in 93.14% of simulated scenarios.
- Meaningful upside participation: 160% uncapped participation if the note survives to maturity with a rising index, plus a large "jump" in the redemption schedule (first redemption already 12% above par).
- Low volatility of outcomes: expected annualized volatility of 2.97% versus 11.06% for the direct index investment.
Considerations
- Return is capped when called: because the issuer redeems when it is economically rational, the investor's upside is effectively limited to the fixed redemption amounts (12% in year 1, +1% per month thereafter) in the most common scenarios. The uncapped 160% participation only applies if the note is never called.
- Early redemption risk / reinvestment risk: 80% of simulations end after just one year; the investor must reinvest at prevailing rates, which may be lower.
- No coupon income: the note pays no interest, so total return depends entirely on the redemption/maturity payment.
- Opportunity cost: the expected annualized return (11.01%) is below the benchmark's expected return (13.96%) — the lower risk and downside protection are "paid for" through the issuer's call right.
- Issuer credit risk: all payments are subject to the creditworthiness of Morgan Stanley Finance LLC (guaranteed by Morgan Stanley).
- Model-driven call feature: the issuer's redemption decision depends on a proprietary risk-neutral valuation model; actual call behavior may differ from the assumption used here (call when the note's model value exceeds the fixed redemption payment).
- Secondary-market risk: although contractual payoffs are principal-protected, the note's market value before maturity can be below par (estimated value at issue: $934.50 per note).