
5.20% p.a. Multi Barrier Reverse Convertible — Simulation Report
Headline Simulation Results
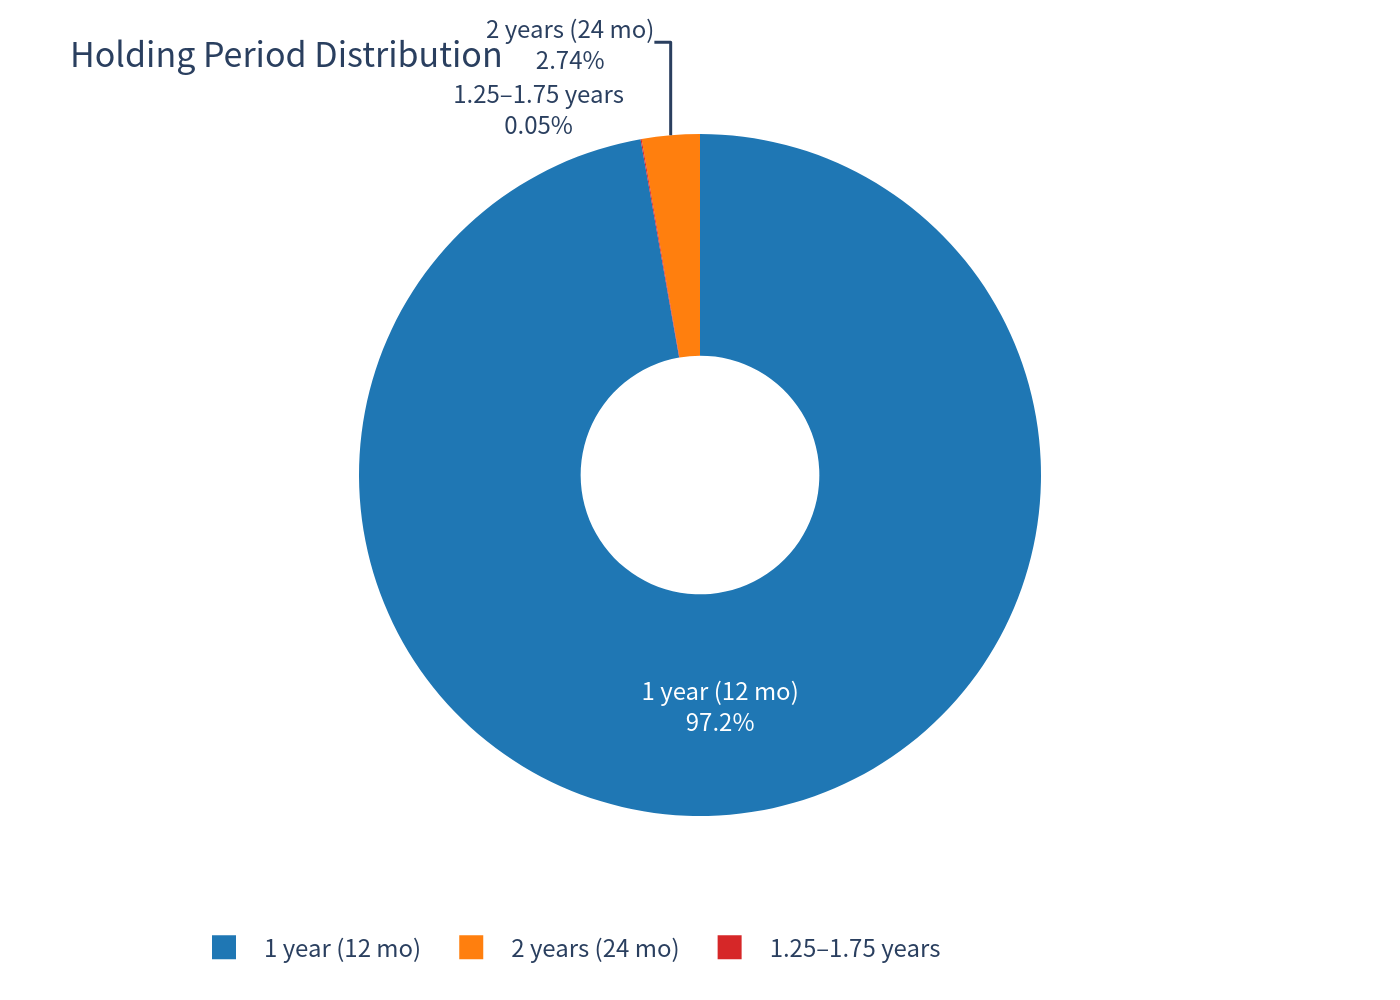
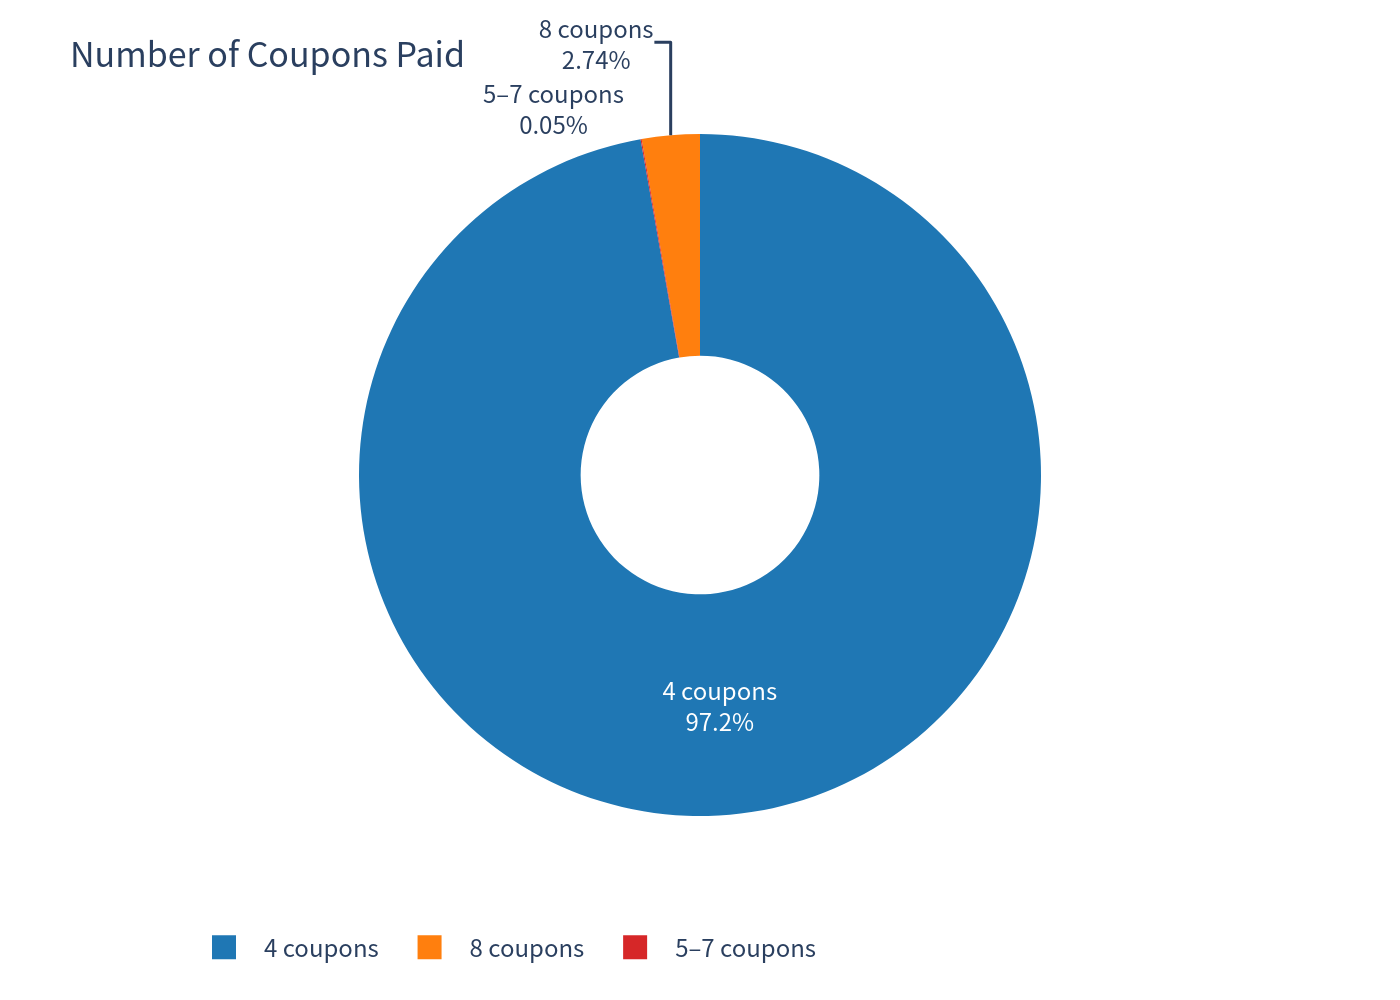
The product pays a 5.20% p.a. coupon (1.30% per quarter, i.e., 1.30 index points per coupon on a 100 notional) regardless of underlying performance. In 97.2% of simulated scenarios the issuer calls the product at the first observation date (month 12), returning par plus 4 coupons — a total return of +5.20% over one year. The product is only held to maturity (~2.7% of scenarios) when a barrier event has occurred and the worst-performing index has not recovered sufficiently before the final issuer-call date (month 21); these scenarios drive virtually all of the downside risk (worst-case total return ≈ -59%). A small subset of these maturity scenarios involves the worst index recovering above its strike by final fixing, in which case the investor receives par plus the full 8-coupon stack (≈ +10.4% total).
Basic Product Information
How it works (in plain terms)
- You receive a fixed coupon of 5.20% p.a., paid quarterly (CHF 13.00 per CHF 1,000 product), for as long as the product is outstanding — regardless of how the three indices perform.
- The issuer can call the product early (at months 12, 15, 18 or 21). If called, you get your CHF 1,000 back plus the coupon due on that date, and the product ends. In today's low Swiss-rate environment the issuer has an economic incentive to call early whenever the indices are not under stress.
- Protection: as long as no underlying index ever falls to or below 64% of its initial level (continuous observation until final fixing), you receive your full CHF 1,000 back at maturity — the coupon is "free".
-
If a barrier event occurs (any index trades at or below 64% of its
starting level at any time on any exchange business day), your maturity payoff depends on the
worst-performing index:
- Worst performer above 100% of its initial level at final fixing → full CHF 1,000 back.
- Worst performer below 100% → you receive CHF 1,000 × (worst performance), i.e., you share in the loss of the worst index.
- Because the product is Quanto CHF, the EUR- and USD-denominated index moves are paid in CHF without any currency exposure for the investor.
Key contract features
- Coupon: 5.20% p.a. (30/360), 8 quarterly payments of 1.30% of denomination; coupons are paid "in any case" and also on early redemption dates.
- Barrier: 64% of initial fixing level, any of the 3 indices, continuous observation (04/09/2026 – 01/09/2028).
- Early redemption: issuer-callable on 4 observation dates (months 12/15/18/21); redemption = par + coupon due.
- Upside is capped — the maximum gain is the accumulated coupon stream (10.40 index points if held to maturity).
- Redemption at maturity: par if no barrier event; otherwise par × worst performance (if worst < strike) or par (if worst ≥ strike).
Key Statistics — Structured Product vs Underlying Benchmark
| Metric | Structured Product | Underlying Benchmark (equal-weight, total return) |
|---|---|---|
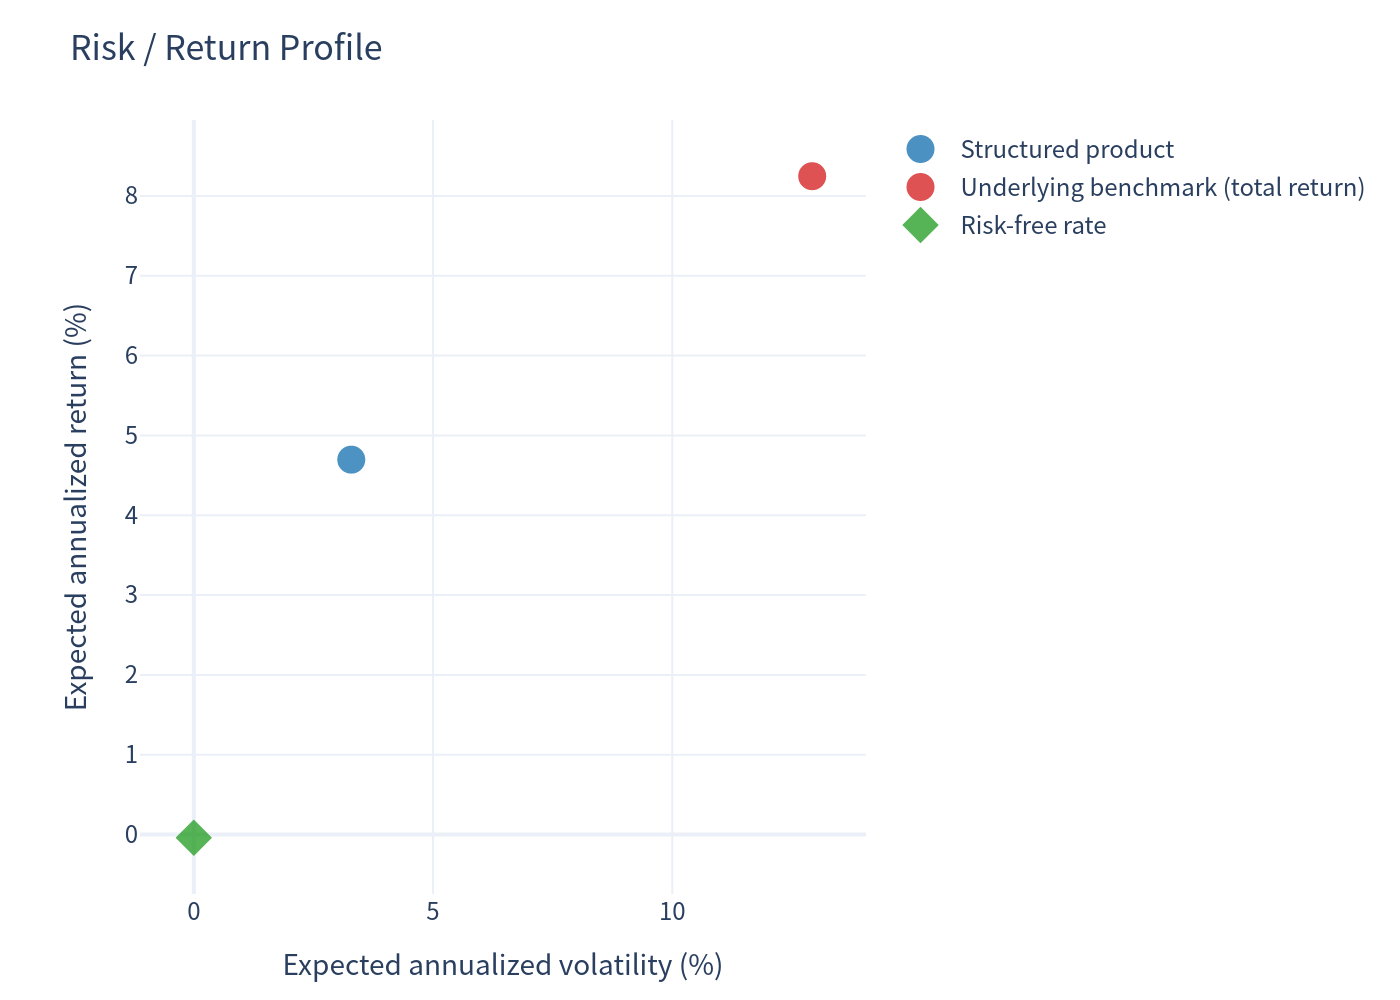
| Expected annualized return | 4.70% | 8.25% |
| Expected annualized volatility | 3.29% | 12.92% |
| Probability of loss | 2.60% | 31.71% |
| 99% confidence VaR (1 year) | -15.83% | -19.77% |
| Expected total return (realized horizon) | 4.40% | 5.97% |
The benchmark is an equal-weight basket of the three indices (price returns plus average dividend yield ≈ 2.01%), measured over the same holding period as each simulation.
Charts
Simulation Outcomes — Product Return vs Underlying Return
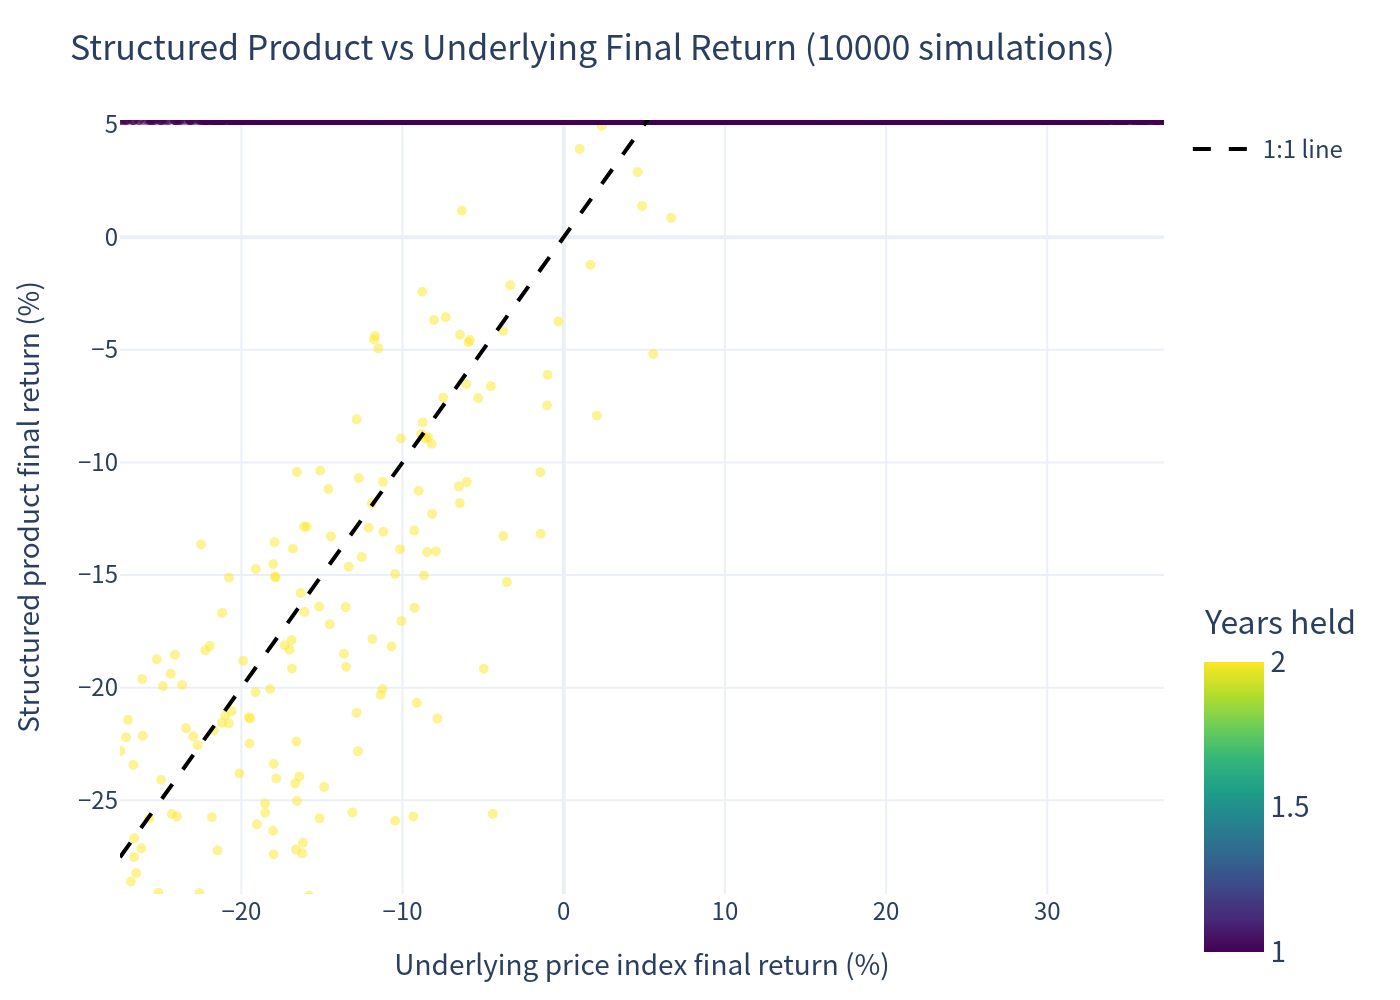
Each dot is one simulated outcome (10,000 simulations). The horizontal spread reflects the underlying basket's final return; the vertical position is the product's final return. The dashed line is the 1:1 line. Most outcomes sit on the +5.2% horizontal band (called at month 12), while the tail below reflects barrier-event scenarios held to maturity.
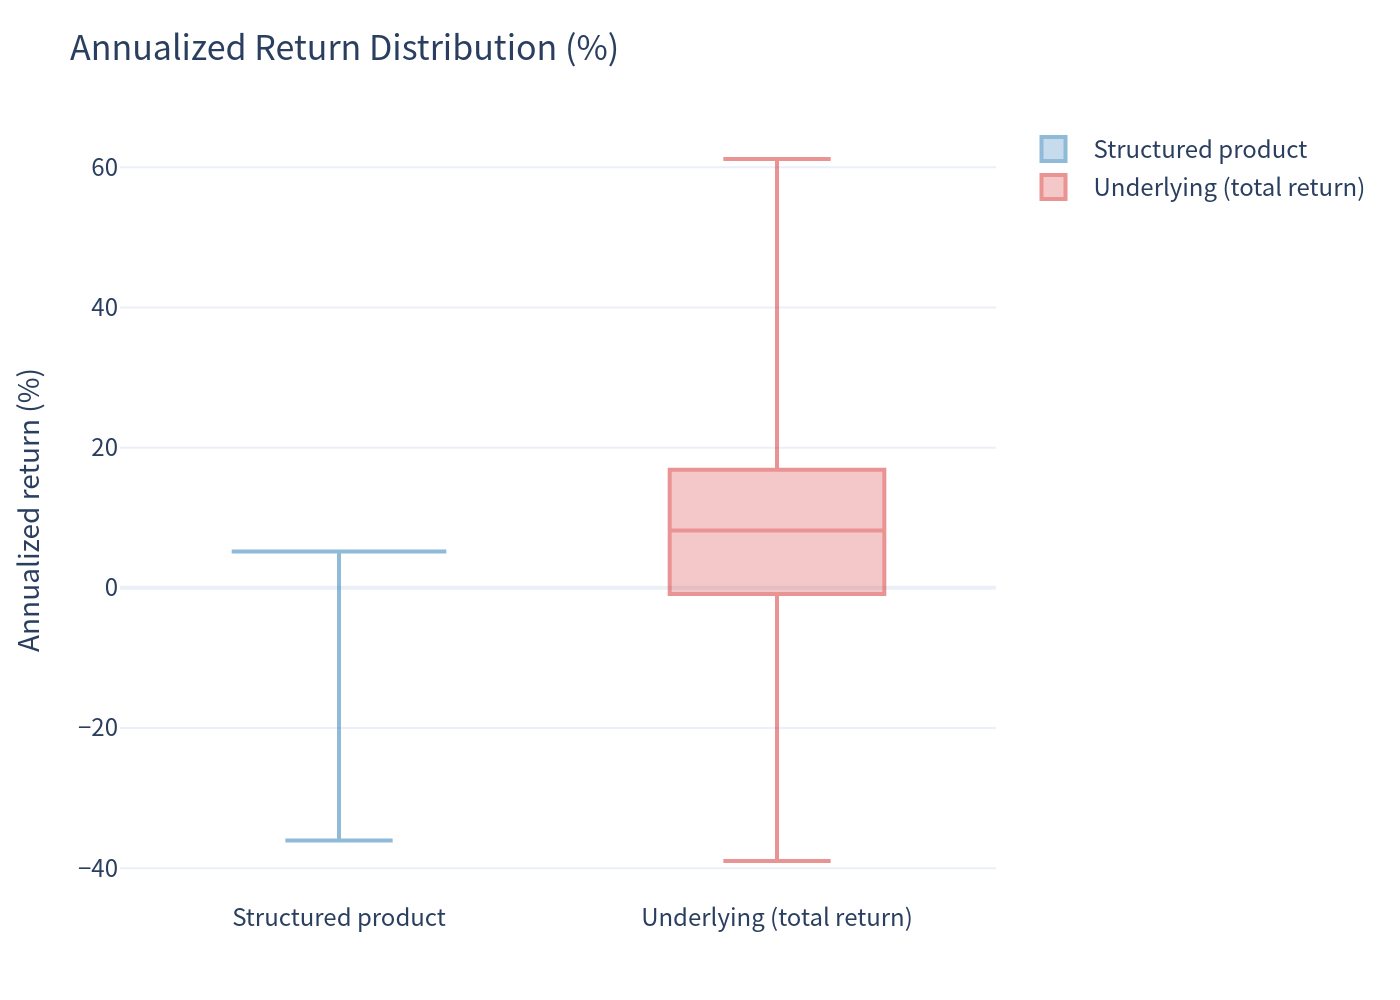
Annualized Return Distributions (1% bins)
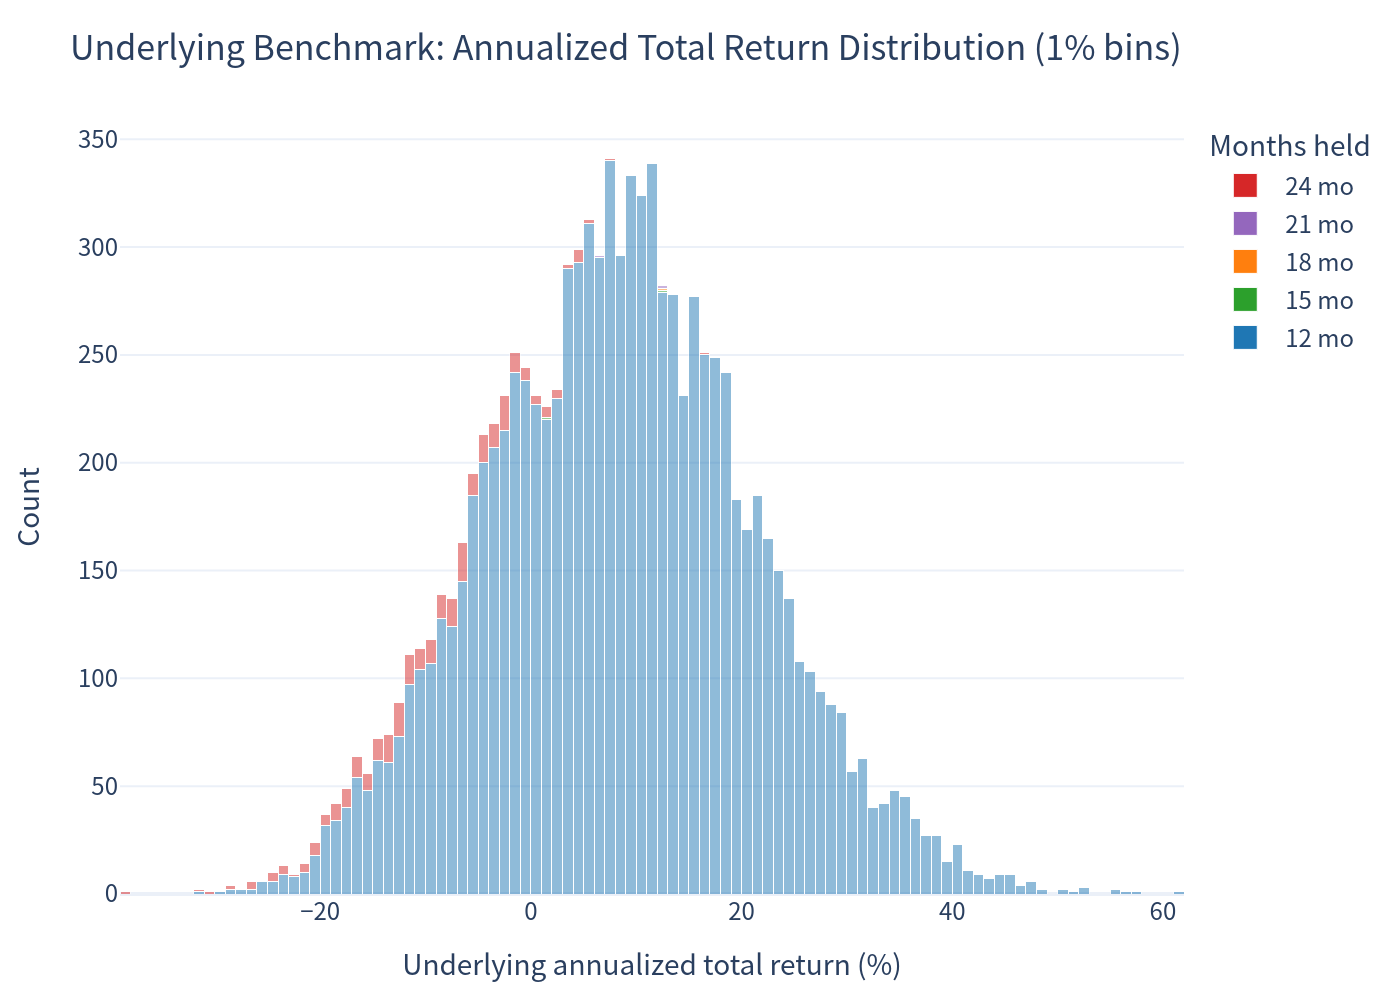
Underlying basket — annualized return distribution (1% bins).
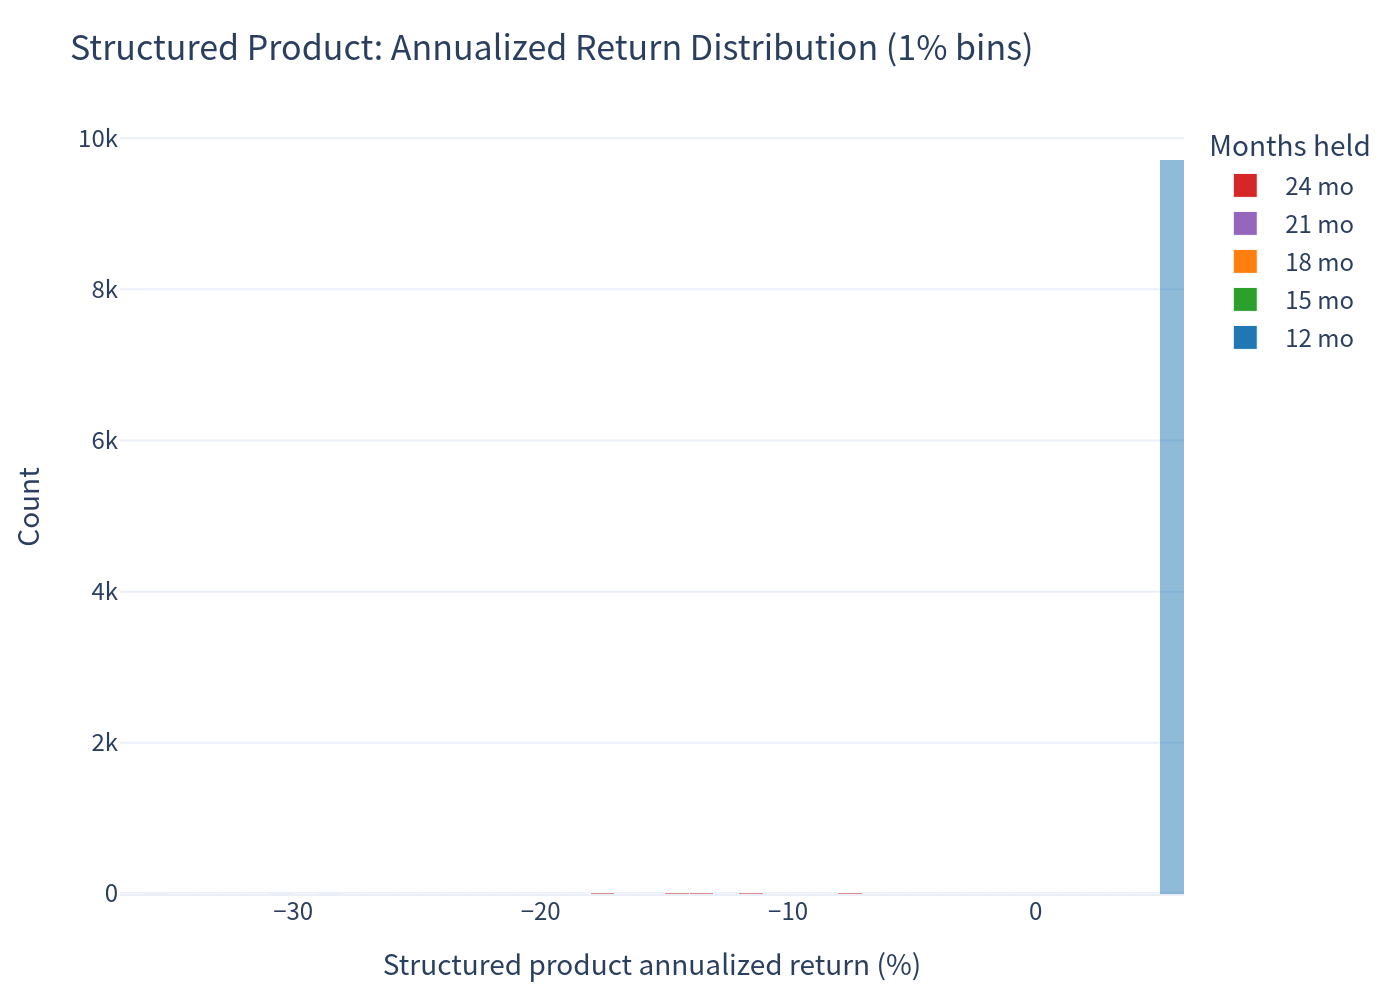
The product's distribution is tightly clustered at ~+5% annualized (the dominant 12-month call outcome), with a left tail of negative outcomes concentrated in the small fraction of maturity scenarios. The underlying basket shows a much wider, roughly symmetric distribution.
Scenario Probabilities
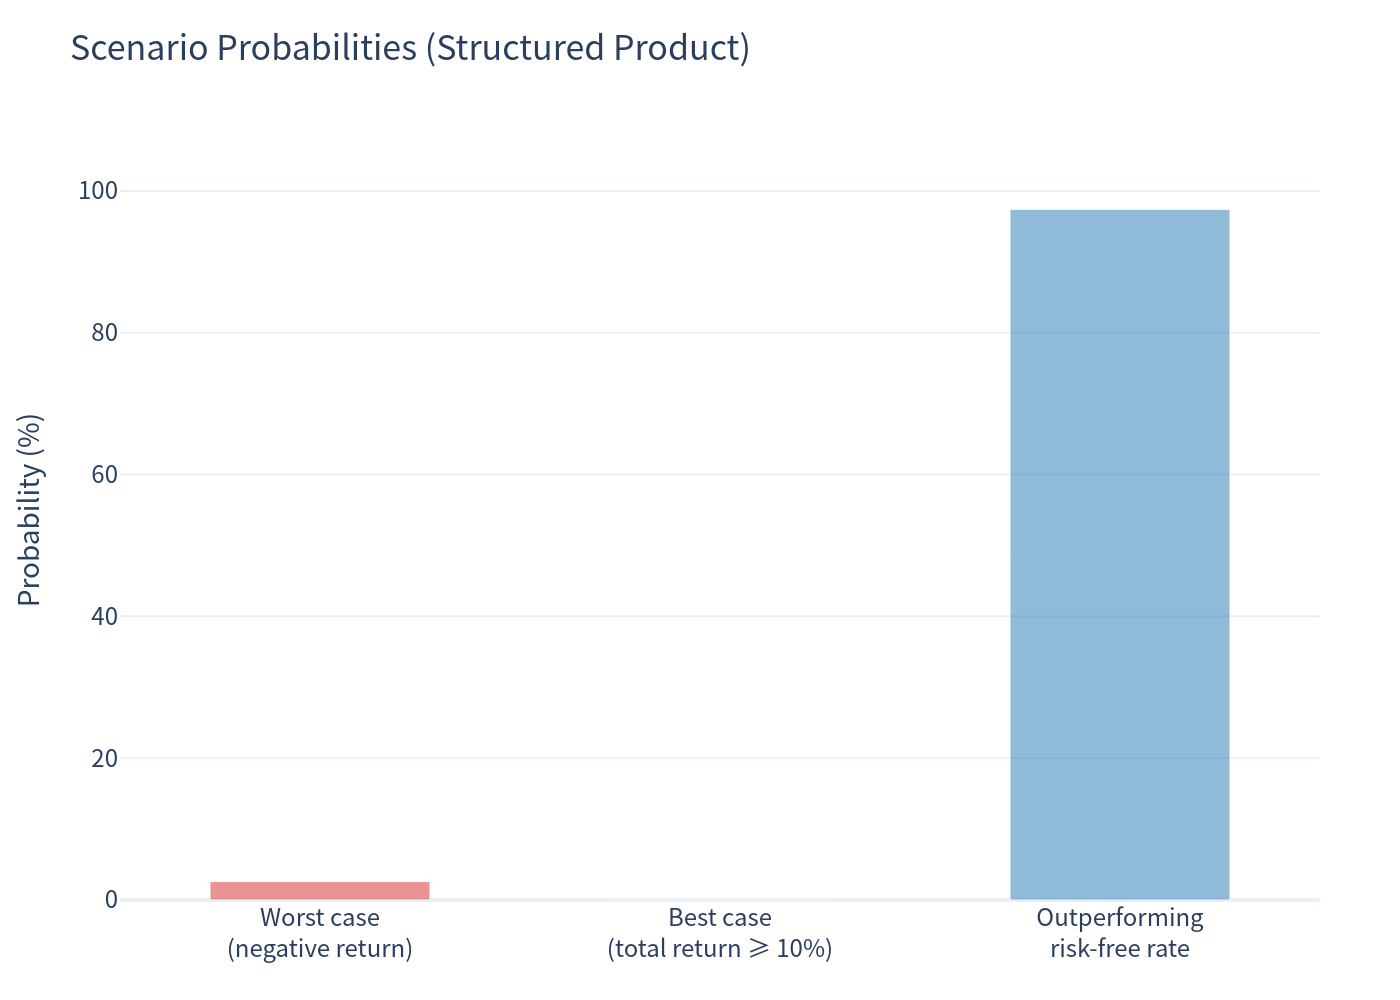
- Worst case (negative total return): 2.60% of scenarios.
- Best case (maximum coupon stack, ≥10% total return): 0.02% — requires the rare combination of a barrier event followed by full recovery by final fixing.
- Outperforming the risk-free rate: 97.40% of scenarios (risk-free ≈ -0.04% in CHF).
Risk / Return Profile
Annualized Return Comparison (Box Plot)
Holding Period & Coupon Distribution
| Outcome | Share |
|---|---|
| Held 1 year (12 months, 4 coupons) | 97.21% |
| Held 1.25–1.75 years (5–7 coupons) | 0.05% |
| Held 2 years (24 months, 8 coupons) | 2.74% |
Investment Commentary
Attractive features
- High probability of a positive outcome: 97.4% of scenarios outperform the (near-zero) CHF risk-free rate, and 97.2% realize the full one-year coupon stack of 5.20% plus par.
- Strong downside protection vs. direct equity investment: only 2.60% probability of loss versus ~31.7% for the underlying basket, with far lower volatility (3.29% vs 12.92% annualized).
- Steady income: coupons of 1.30% per quarter are paid irrespective of index performance, and also on early-redemption dates.
- Quanto CHF protection: no currency risk on the EUR and USD indices.
- Expected annualized return of 4.70% with very low expected volatility — attractive on a risk-adjusted basis versus the underlying basket.
Considerations / Risks
- Upside is capped: the investor forgoes the full upside of the three indices; the underlying basket's expected annualized return (8.25%) exceeds the product's (4.70%) because the coupon is the only compensation.
- Tail risk from the barrier: in the small probability of a barrier event with a persistently weak index, the investor can lose up to ~59% (worst simulated case), and the 99% VaR is -15.83%.
- Early call risk: because the issuer is likely to call at month 12, the investor may be forced to reinvest sooner than expected; the "high" 5.20% coupon may only be earned for one year.
- Credit risk: the product is an unsecured obligation of the issuer (Leonteq Securities AG, Guernsey Branch, rated BBB-).
This report is a quantitative evaluation based on simulated market scenarios and does not constitute investment advice or a suitability assessment.
Key modeling assumptions: issuer call exercised when the present value of remaining obligations (future coupons + expected redemption) exceeds par, at the CHF risk-free rate; barrier observed continuously via a Brownian-bridge adjustment on monthly simulated paths; equal-weight underlying benchmark includes average index dividend yield (2.01%).