
Structured Product Analysis — 12.60% p.a. Multi Barrier Reverse Convertible (Callable)
Headline Simulation Results
mean per-simulation CAGR over an expected holding period of 12.60 months
What the Product Is and How It Works
This is a capital-at-risk, callable reverse convertible issued in Swiss francs. It pays a fixed 12.60% p.a. coupon (CHF 31.50 per CHF 1,000 quarterly) regardless of how the two underlying shares perform, as long as the product is still alive. The product references the worse of two Swiss stocks — Burkhalter Holding (BRKN) and R&S Group (RSGN) — and protects capital down to a 59% barrier below the starting levels.
In plain terms
- While nothing goes badly wrong, you collect an attractive quarterly cash coupon and, at maturity, get your CHF 1,000 back (par).
- Protection (59% barrier): full par is returned as long as neither share ever trades at or below 59% of its starting level during the whole ~18-month life (continuously observed). If the barrier is never touched, you get par back even if the shares end lower.
- The catch — worst-of downside: if the barrier is breached at any point and the worst share finishes below its starting level, protection is lost and you effectively receive the worst-performing share's upside-down return (physical delivery of that share), i.e., you wear the full fall in the weaker name.
- Issuer call: the issuer may redeem the note early (quarterly, from month 6) at par plus the then-current coupon. When this happens, future coupons stop — you are taken out of the trade and do not receive the remaining quarterly coupons.
- Upside is capped: you never receive more than par plus the fixed coupons, no matter how high the shares rise.
Key Statistics — Product vs Benchmark
The benchmark is an equal-weight basket of the two shares (total return, i.e., including dividends of roughly 3.53% combined). Figures are over the simulation horizon.
| Metric | Structured Product | Benchmark (EW basket, total return) |
|---|---|---|
| Expected annualized return | 9.64% | 17.58% |
| Expected annualized volatility | 8.67% | 27.47% |
| Probability of loss (total return < 0) | 9.93% | 30.01% |
| 99% VaR (1-year, annualized) | −24.66% | −25.36% |
| Expected total return (holding period) | 9.11% | 9.38% |
| Expected holding period | 12.60 months | — |
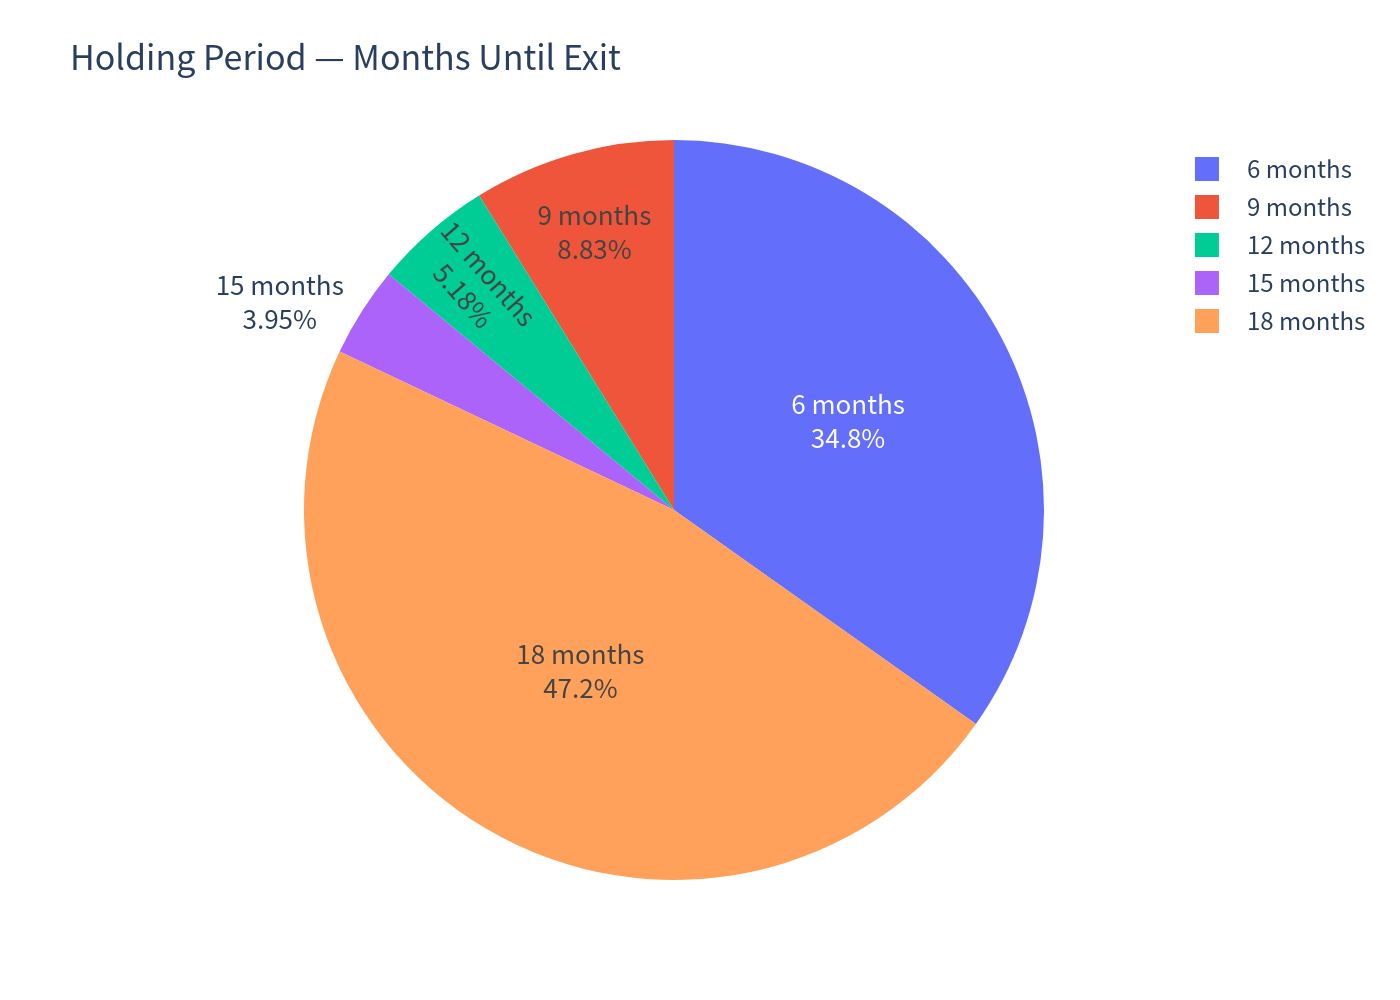
Because the note can be called early, holding periods vary widely — about 34.81% exit after 6 months, and the remainder exit at 9, 12, 15 or 18 months. Very short exits inflate per-simulation annualized figures (a 6-month coupon return is scaled up toward an annual rate), which is why the benchmark's annualized figure (17.58%) is well above its realized-holding-period total return (9.38%). On a total-return basis over the realized holding period the two are close (product 9.11% vs benchmark 9.38%), but the product delivers that with far lower volatility and a much smaller chance of loss.
Charts
Outcome scatter — product vs benchmark
Each dot = one simulation, colored by years held.
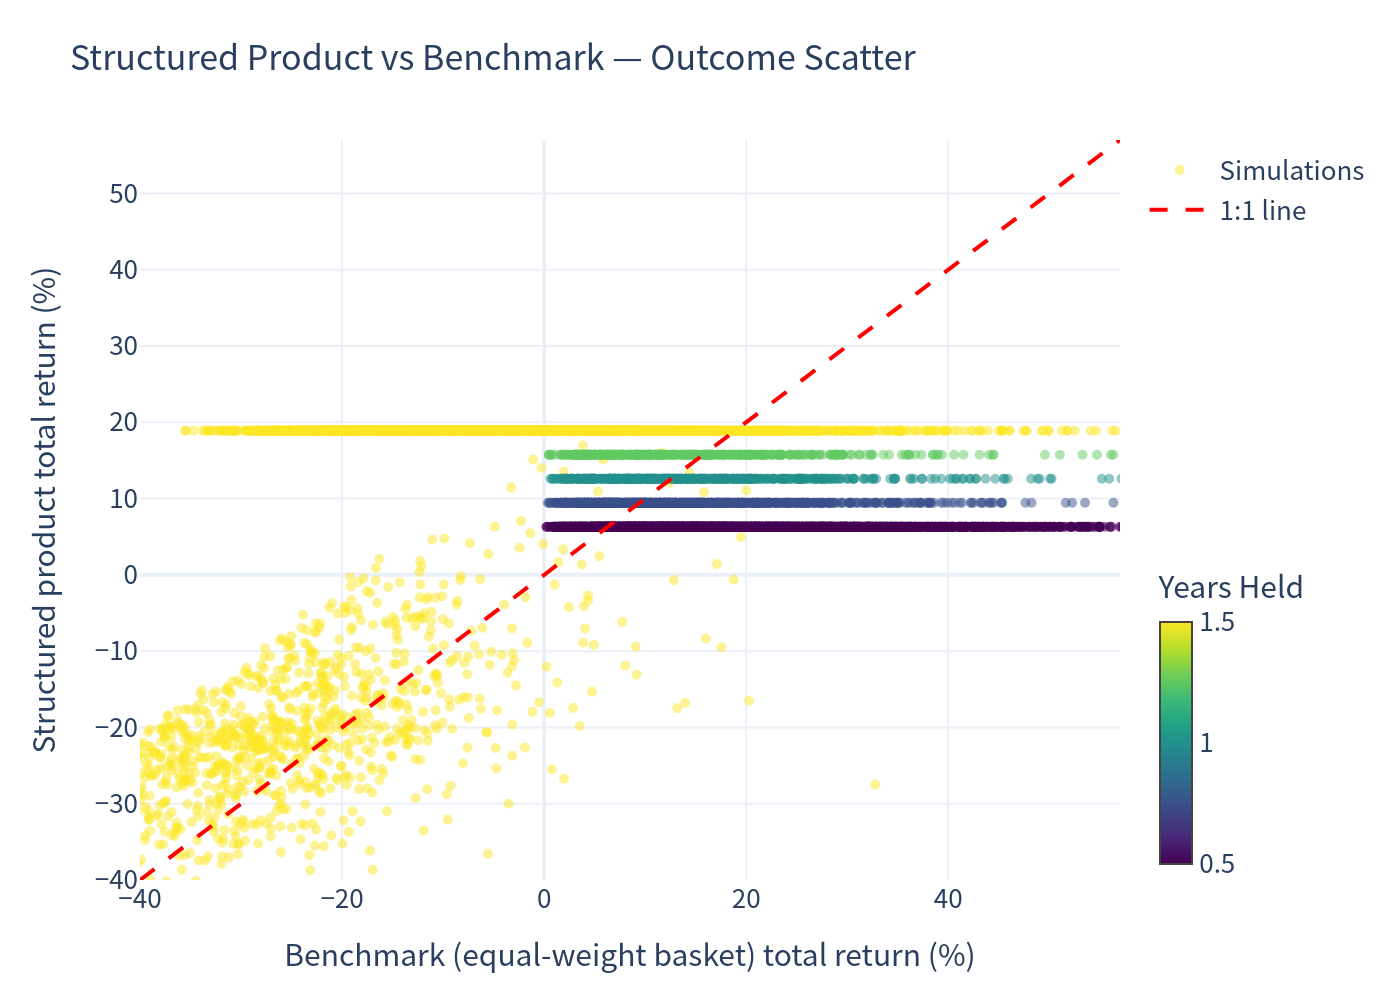
The bulk of simulations cluster in the upper region (positive product returns with the benchmark near flat-to-up), illustrating the coupon-driven payoff. The red 1:1 line shows that in strong benchmark rallies the product return is capped (dots fall below the line), while in sharp sell-offs the product sits above the line as the coupon cushions moderate falls — until the barrier breach tail where losses track the downside.
Annualized return distribution — structured product
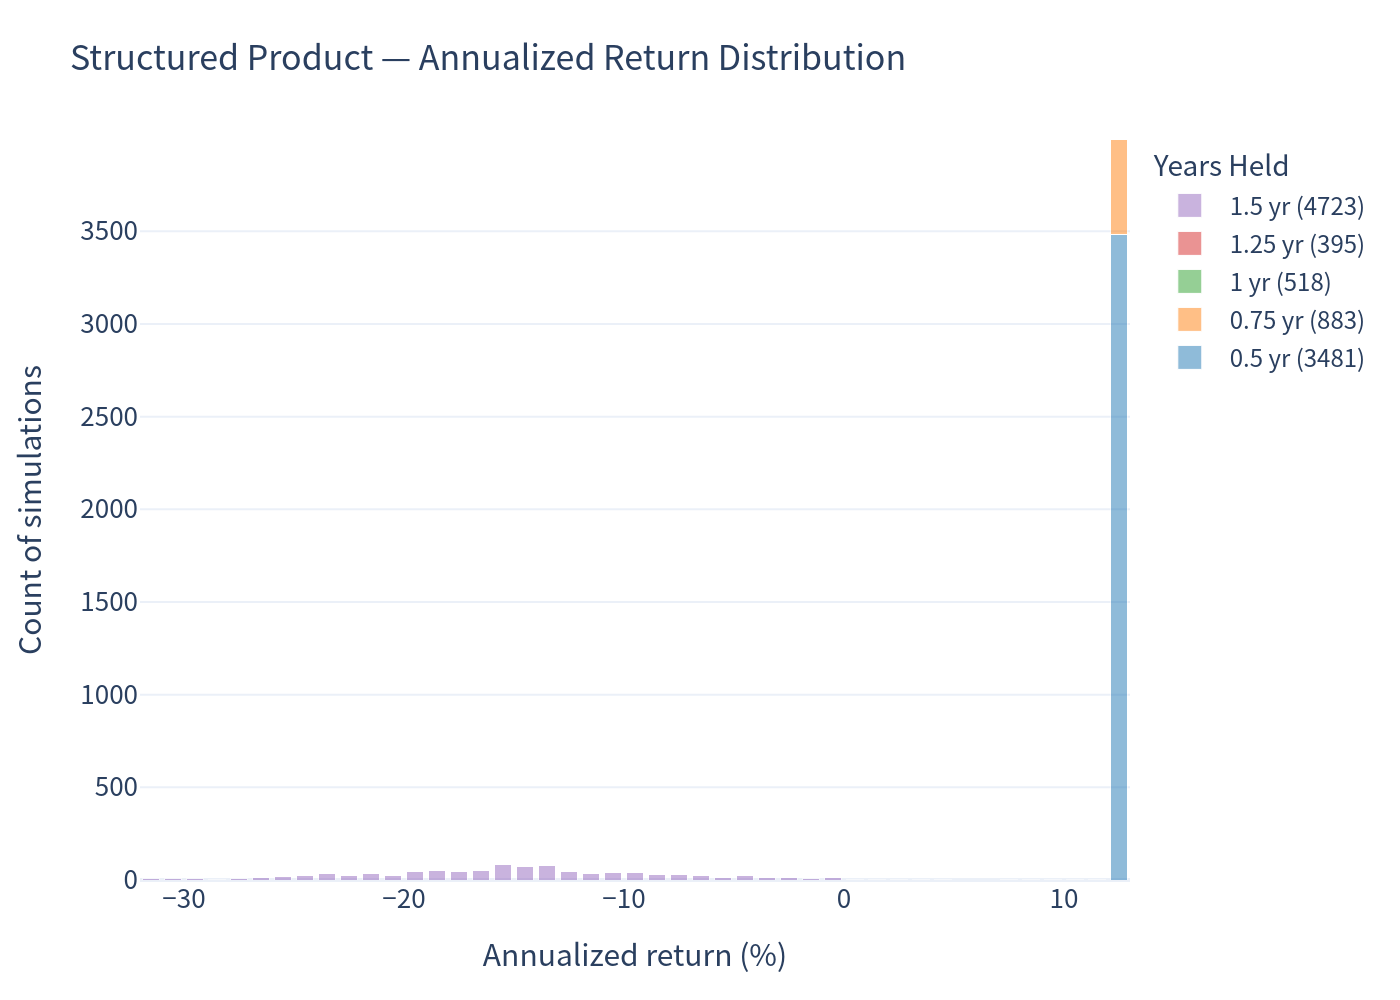
The distribution is strongly concentrated around +12% annualized (the coupon-plus-par outcomes, whether called early or held to maturity), with a distinct left tail of roughly 10% of simulations that suffer material losses after a barrier breach.
Annualized return distribution — benchmark
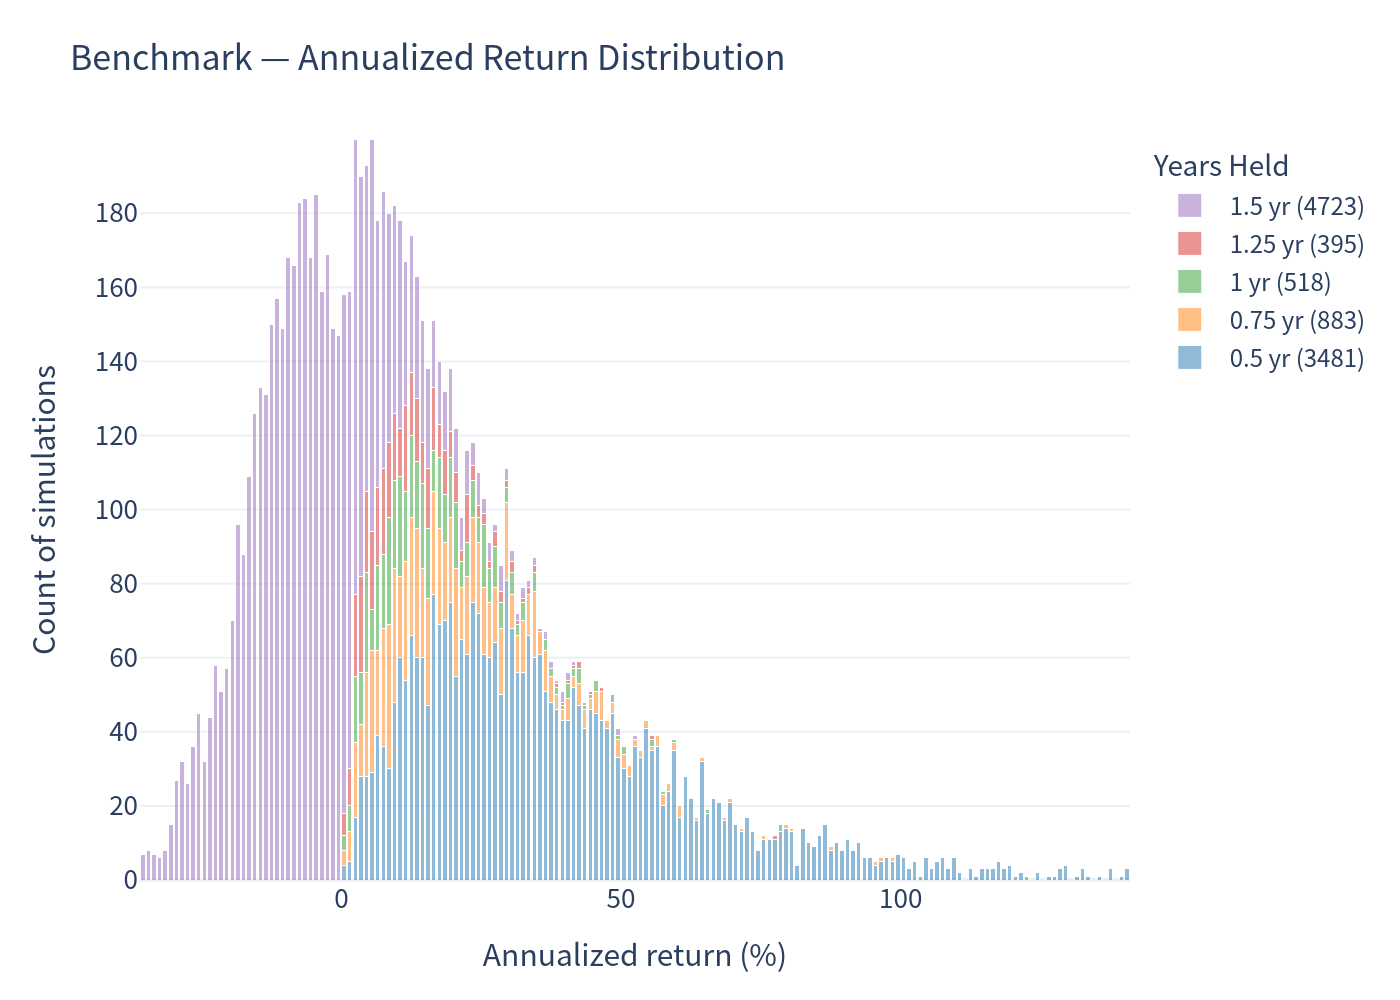
A much wider, more symmetric-to-right-skewed spread reflecting full equity participation and the high volatility of the two small caps (Burkhalter ≈26%, R&S Group ≈38% annualized).
Risk / return profile
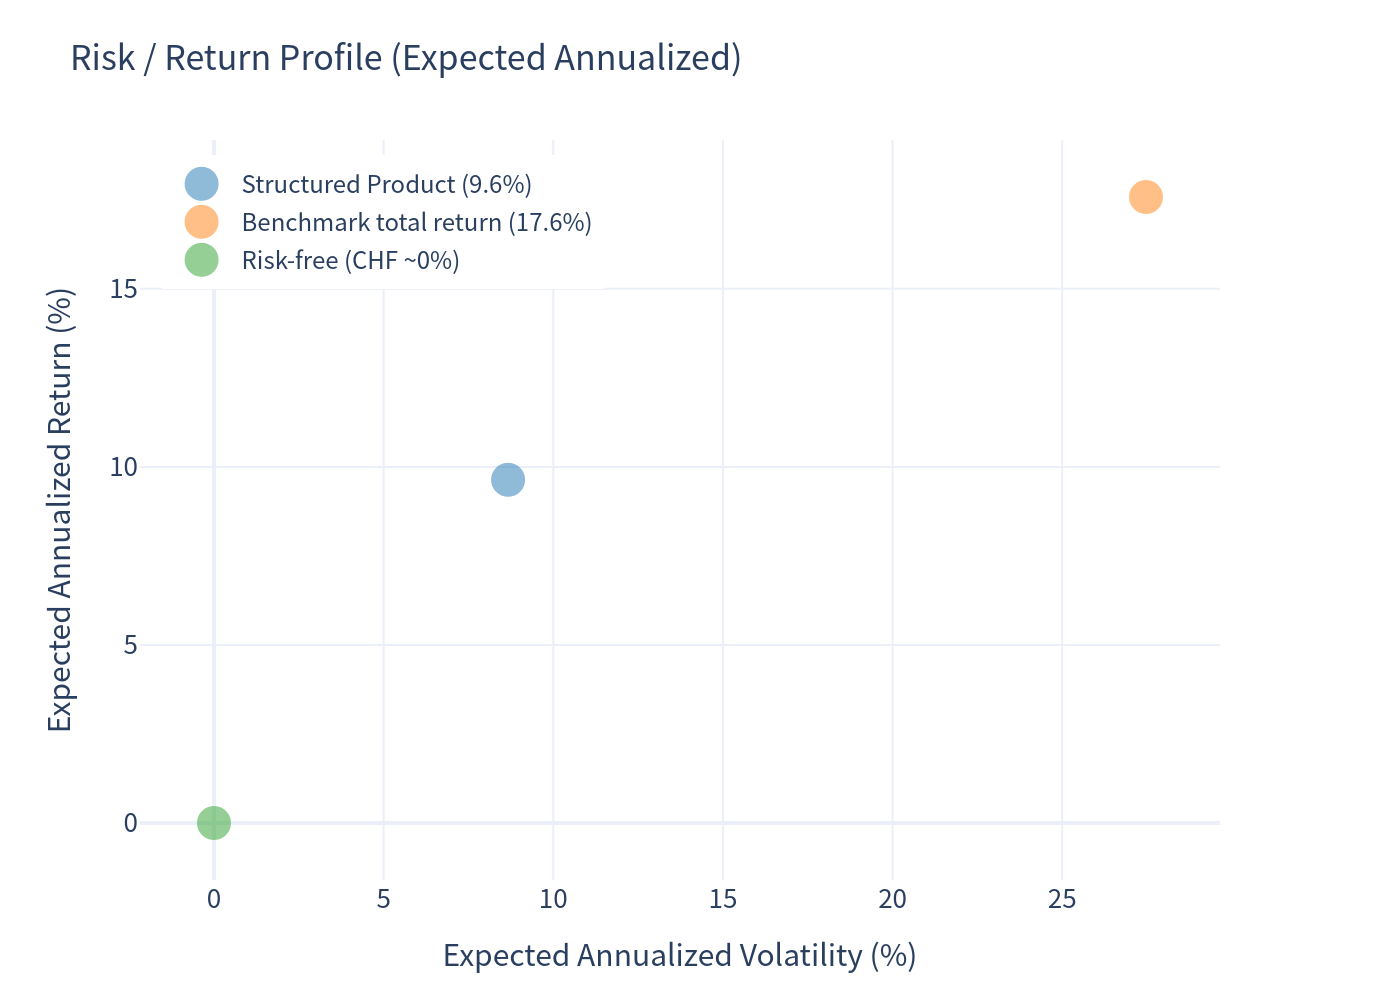
The product plots with considerably lower expected volatility than the benchmark while capturing a comparable share of return on a total-return basis, translating into a materially better risk-adjusted position; CHF cash sits at the origin.
Annualized return box plot — product vs benchmark
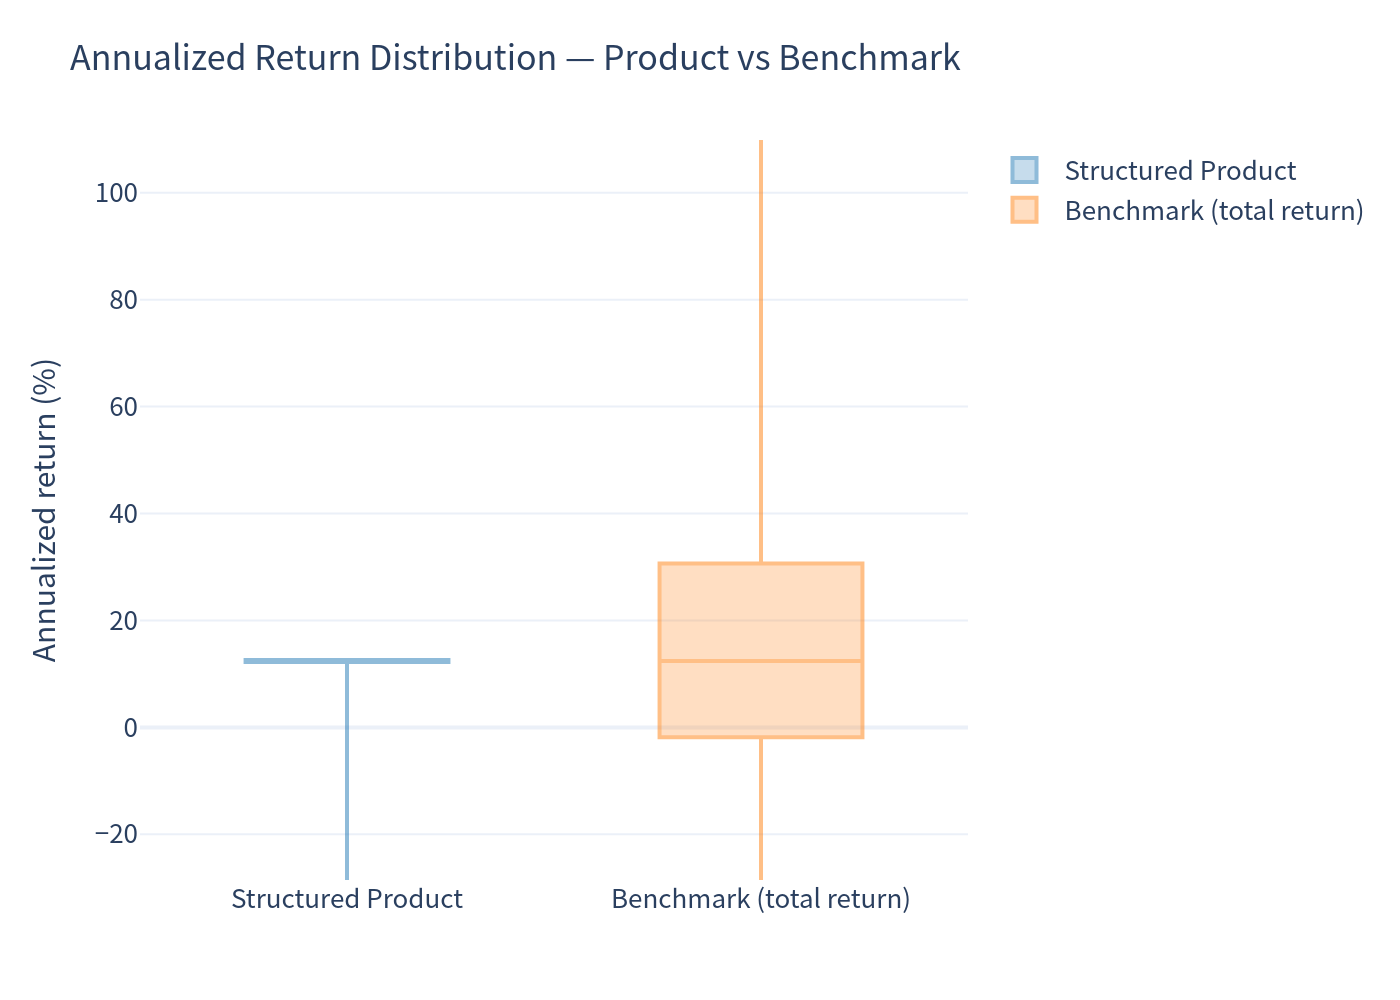
The product's interquartile range is tight and its median sits near +12%, versus a far wider benchmark box — the visual signature of a coupon note with a capped upside and a protected (until breached) downside.
Scenario probabilities
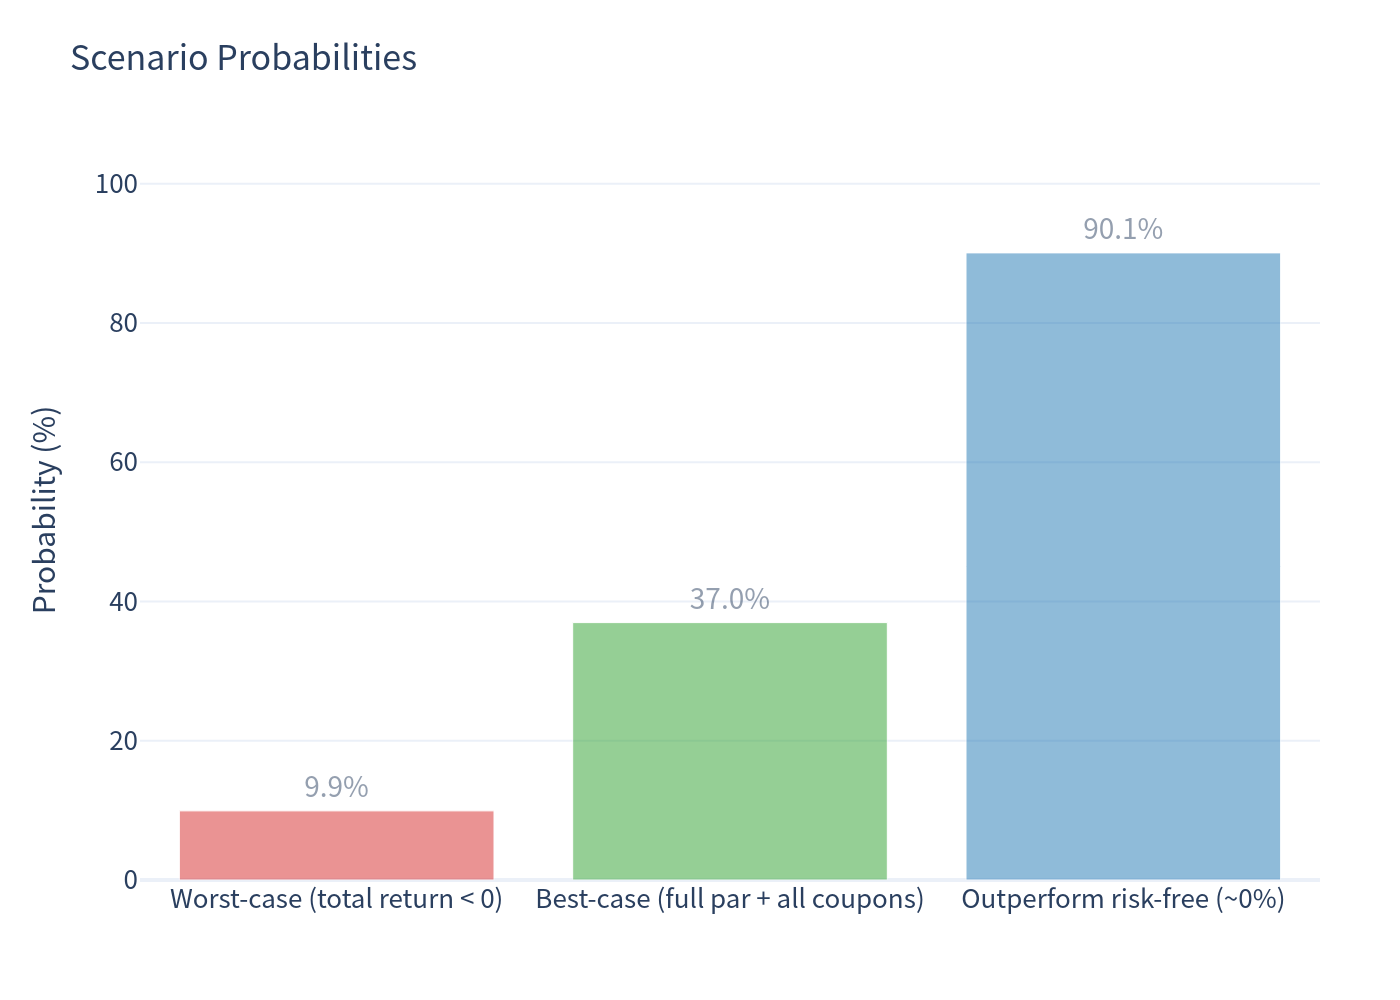
- Worst-case (lose money): 9.93%
- Best-case (full par + all six coupons, ≈+18.90% total): 36.97%
- Outperform risk-free cash (≈0%): 90.07%
How long the product is held
Number of coupons received
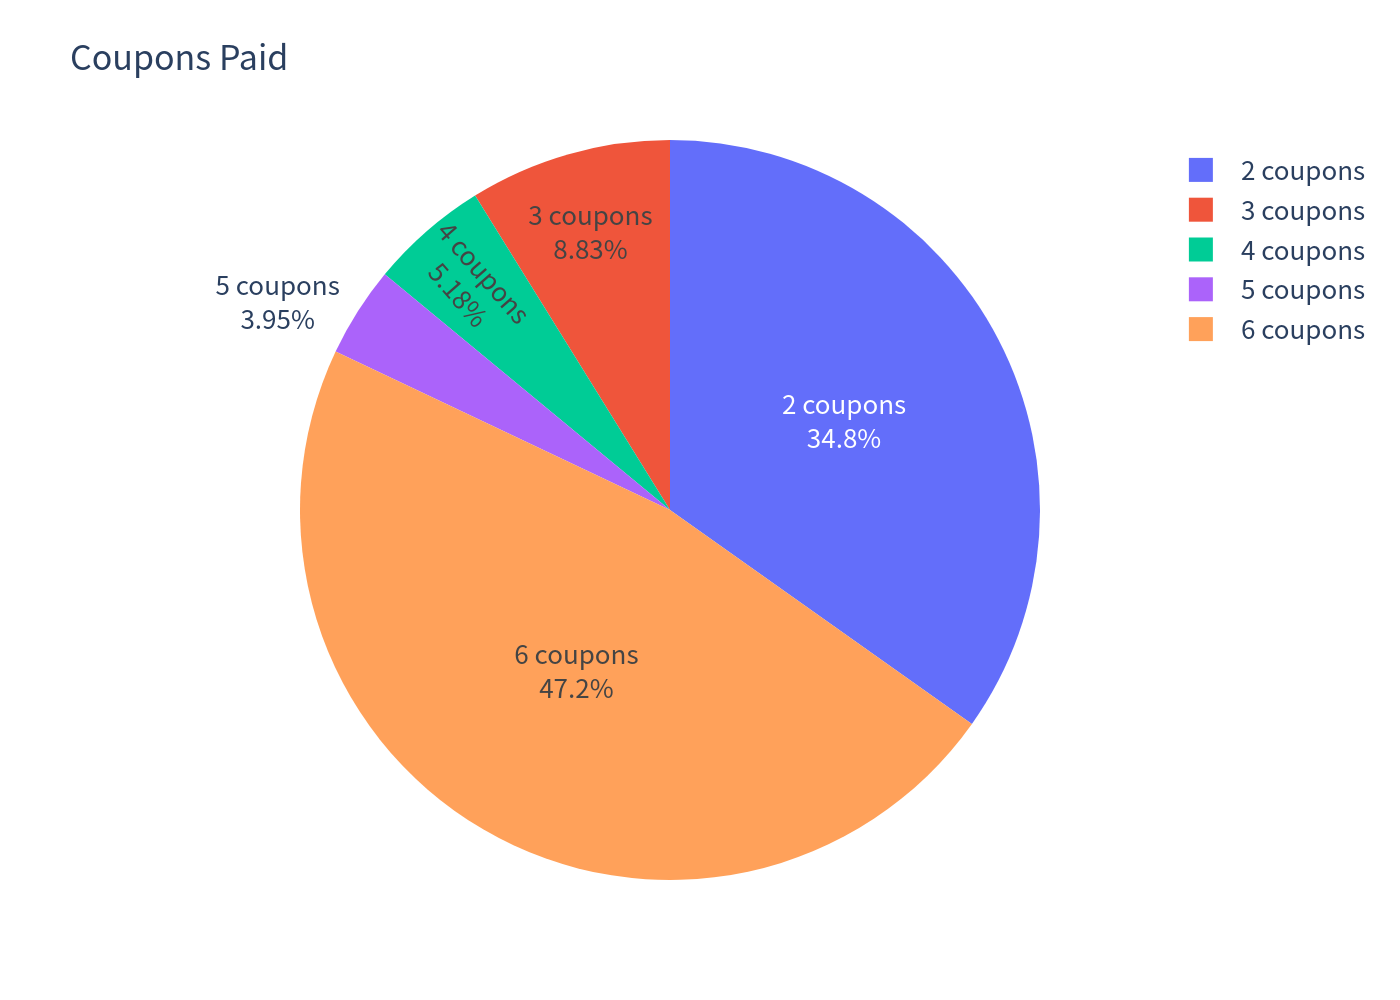
Early calls concentrate outcomes: the most likely early-call exit is 6 months with 2 coupons (~34.81%); overall, however, the single most likely outcome is running to maturity (~47.23%), collecting all 6 coupons.
Investment Commentary
Strengths
- High, dependable income: a 12.60% p.a. coupon is far above CHF cash (~0%); coupons are paid in any case while the note is alive, independent of underlying performance.
- Favourable loss profile vs. direct equity: the 59% barrier cuts the probability of a loss to ~9.93% (versus ~30% for the basket) and roughly a third of the benchmark's volatility (8.67% vs 27.47%).
- High win rate: ~90% of simulations outperform cash, and ~37% deliver the maximum outcome (full par plus every coupon).
- Yield pickup via worst-of structure: the worst-of linkage on two moderately-correlated Swiss names boosts the coupon relative to a single-name note.
Considerations / risks
- Capped upside and early call: returns are limited to par plus coupons, and the issuer's quarterly call (frequently triggered after strong early performance) truncates the coupon stream — in ~35% of paths you are called after just 6 months with only two coupons.
- Barrier-contingent downside: if either share breaches 59% (continuously observed) and the worst name ends below its start, protection is lost and you take the worst-of fall (simulated losses reach roughly −55% total in the tail; 99% VaR ≈ −24.66%).
- Single-name blow-up risk: the worst-of mechanic means one weak name drives the payoff even if the other performs well; R&S Group is a smaller, higher-volatility company with a shorter trading history.
- Issuer credit risk: redemption and coupons depend on the issuer's ability to pay (Leonteq, rated BBB−).
This analysis is quantitative and informational only and does not constitute financial advice or a suitability assessment.