
Structured Product Evaluation
Headline Simulation Results
Under a risk-neutral commodity framework (zero commodity risk premium, consistent with the current near-zero CHF rate of -0.04%), the product's simulated expected payoff sits below par — the fixed 8% coupon does not fully compensate for the continuous worst-of downside. The distribution is negatively skewed: roughly half of all scenarios lose money, and the left tail is severe (1-in-100 annualized return of -39.51%).
How the Product Works (plain language)
- The investor is paid a fixed 8.00% annual coupon, quarterly (CHF 20.00 per CHF 1,000 note; six payments over the 18-month maximum term), regardless of how the metals move.
- Principal is at risk only if a "barrier event" occurs: if any one of the four metals (the "worst-of" logic) ever trades at or below 69% of its starting price at any moment during the ~18-month life (continuous observation), the protection is removed.
- At maturity, if the barrier was breached and the worst-performing metal finishes below its start, the investor is repaid the worst performer's ending percentage (absorbing that loss) plus coupons already collected. If no barrier event occurs — or the worst performer finishes at or above its start — the investor gets 100% of principal back.
- The issuer may call (redeem early) quarterly when the metals rally (modelled: when the worst-of is at/above its starting level). This caps the upside at the coupon.
- Economically, the investor sells a worst-of down-and-in put (strike 100%, continuous barrier 69%) and is paid the 8% coupon as premium.
Key Statistics — Structured Product vs. Equal-Weight Metal Basket
| Metric (annualized) | Structured Product | Equal-Weight Basket |
|---|---|---|
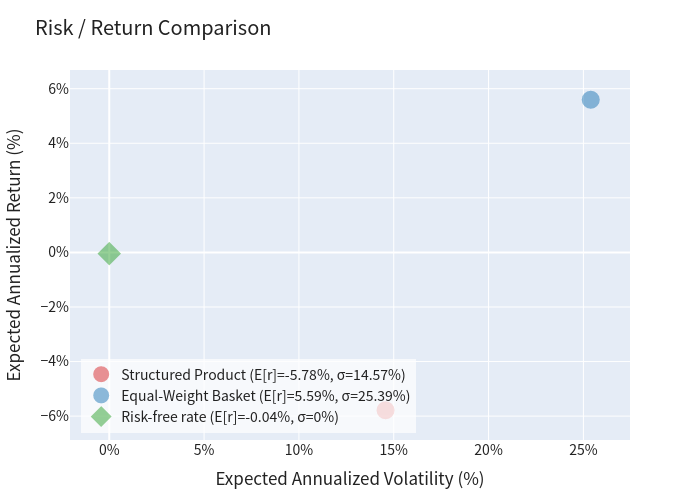
| Expected annualized return | -5.78% | 5.59% |
| Expected annualized volatility | 14.57% | 25.39% |
| Probability of loss (total return < 0) | 52.21% | 50.94% |
| 99% confidence VaR (1 year) | -39.51% | -32.57% |
| Risk-free rate (CHF, 1-yr average) | -0.04% | -0.04% |
Note on the basket figures: the basket is shown over each simulation's realized holding period (same horizon as the product). Because early redemption happens only when all metals have rallied, those short periods annualize into large positive numbers, lifting the basket's mean/volatility. Held over the full 18 months, the equal-weight basket's expected annualized return under zero drift is ≈ 0% with ≈ 17% volatility. Either way, the 1-in-100 downside (−32.6%) and the loss probability are comparable, so the comparison is fair on risk and unambiguous on return.
Outcome split (10,000 paths): ≈28.9% are called early (par + coupons; total return +4% to +10%); ≈16.1% reach maturity with no barrier breach and earn the full +12% (par + all six coupons); ≈54.4% reach maturity with the barrier breached and the worst metal finishing below its start, taking the worst-of loss (average total return ≈ −24%); and ≈0.6% breach the barrier but the worst metal recovers to/above its start, still receiving par + coupons (+12%).
Charts
Simulated outcomes vs. the worst-of underlying
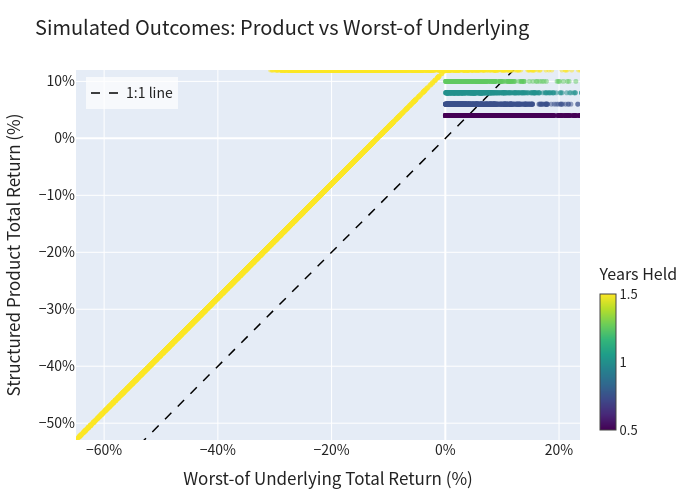
Each point is one simulation. Where the worst-of stays above −31% (no barrier breach) the product pays the full +12% (points above the 1:1 line); where the worst-of trades up, the product's return is capped (points below the 1:1 line at the right). The dangerous region is the lower-left: once the 69% barrier is breached and the worst metal stays below its start, the product tracks the worst performer down.
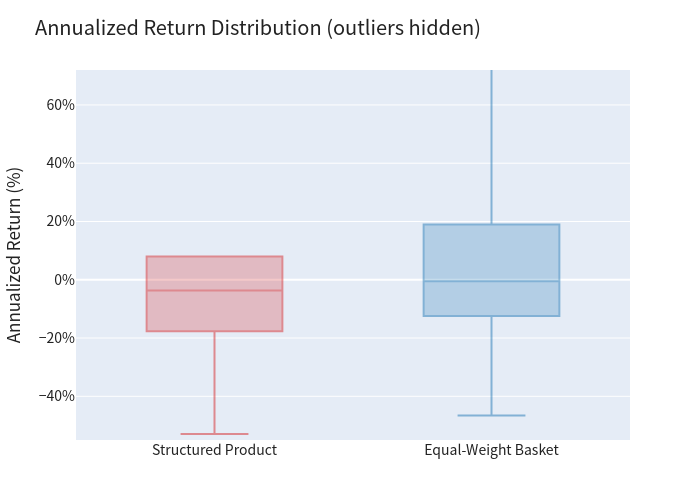
Annualized return distributions
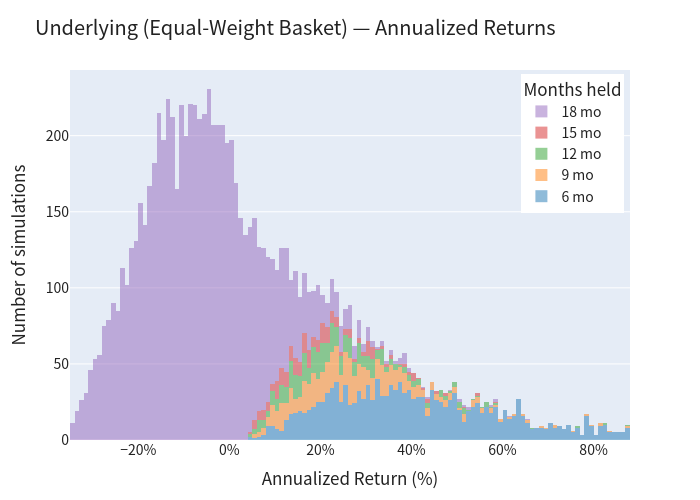
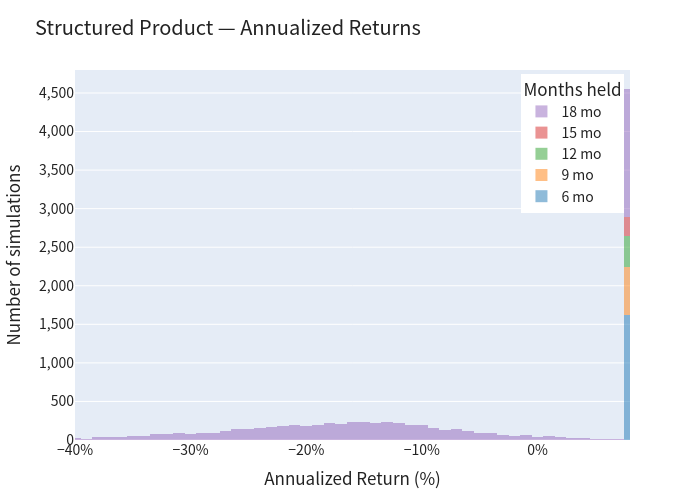
The product's return distribution is concentrated between −40% and +8% and hard-capped at +8% annualized (no upside), with a fat left tail. The underlying basket spans a wider range on both sides.
Scenario probabilities
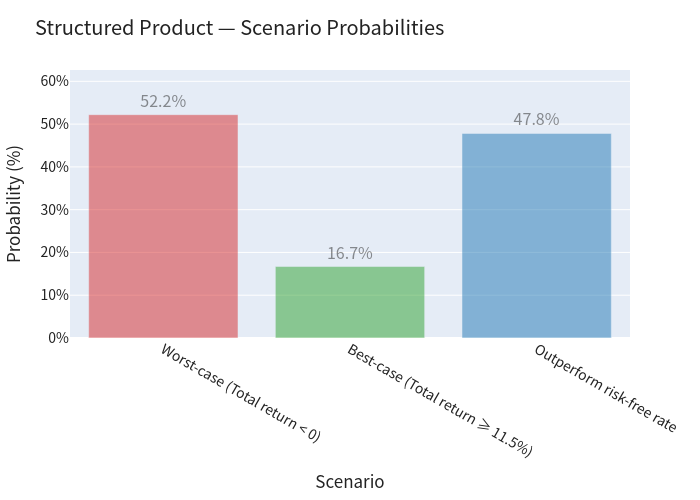
≈52.2% chance of losing money; ≈16.7% chance of the maximum payout (par + all coupons — either no breach, or breach-but-recovered); ≈47.8% chance of beating the risk-free rate.
Risk / return comparison
Annualized return box plot
Holding period and coupon-count distribution
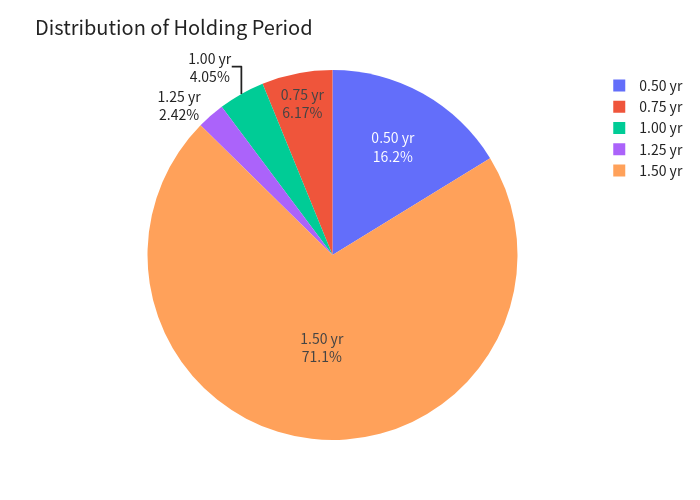
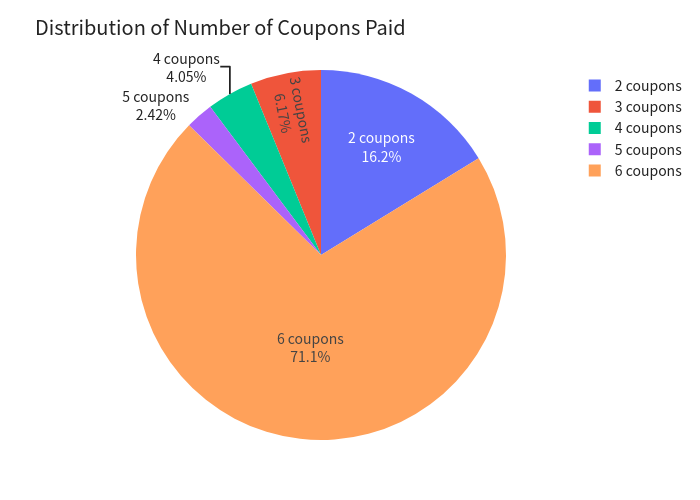
≈71% of paths run to the 18-month maturity (6 coupons); the remainder are called earlier (most at month 6, i.e. 2 coupons).
Investment Commentary
Strengths
- Attractive headline coupon (8.00% p.a.) paid quarterly in any case (subject to early redemption), independent of metal performance — a meaningful yield in a near-zero CHF rate environment.
- 31% downside buffer: principal is fully protected unless one of the metals breaches 69% of its start — the protective zone is wide relative to the metals' typical 1–2 month moves.
- Diversification across four precious metals (Gold, Palladium, Platinum, Silver) with modest-to-moderate correlations reduces the chance any single name alone triggers the barrier.
- Defined, short maximum tenor (18 months) and the issuer's quarterly call means the note can return capital quickly in a rally.
Weaknesses / risks
- Negative expected value under a risk-neutral framework: the simulated expected payoff (~90 per 100) sits below par — the coupon appears thin relative to the risk taken; the product behaves like an expensively-priced worst-of put.
- Worst-of linkage is punishing: because the payoff follows the weakest metal, the effective downside is much larger than an equal-weight basket. The 99% VaR (−39.5%) is worse than simply holding the basket (−32.6%).
- Continuous 69% barrier: "any time on any Exchange Business Day" observation means a brief intraday spike below 69% on any one metal removes protection permanently (≈60% of simulations see at least one breach at some point).
- Capped upside: returns are limited to the coupon; the investor forgoes any metal rally beyond it — precisely the scenarios that drive the basket's best outcomes.
- High loss probability (~52%) and a fat left tail; when the barrier is breached and the worst metal stays below its start, average total return is ≈ −24%.
Figures are model-based simulations (10,000 paths) and are illustrative, not a forecast or investment advice. All metrics are gross of fees and taxes.