
tokenengine.ai
Structured Product Evaluator | info@tokenengine.ai
Step-Up Jump Market-Linked CD with Auto-Callable Feature — Investment Analysis
Headline Simulation Results
| Metric | Value |
|---|---|
| Expected annualized return | +7.17% |
| Probability of a negative return | 0.00% |
| 99% confidence VaR (1 year) | 0.00% |
| Expected total return over the realized holding period | +13.92% |
| Expected holding period | 3.12 years |
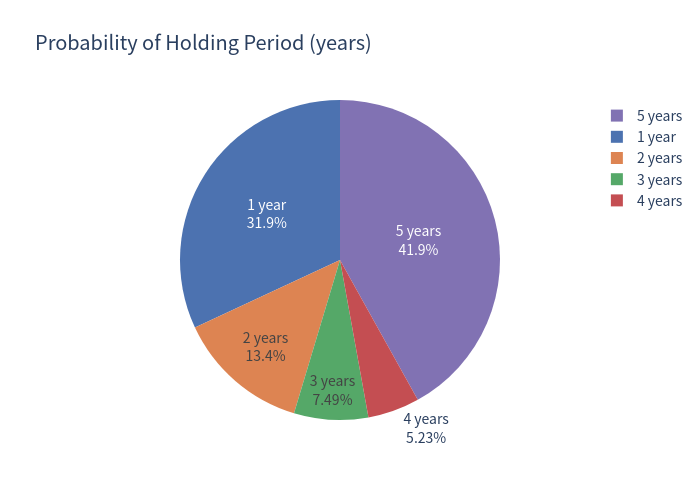
| Probability the CD is auto-called early (years 1–4) | 58.08% |
| Risk-free rate (1-year U.S. Treasury, 1-yr average) | 3.89% |
Because the CD is principal protected, every simulated outcome returned at least the deposit amount: the loss probability and the 1-year 99% VaR are both 0.00%. The expected annualized return of 7.17% represents a spread of roughly +3.28% over the risk-free rate.
Basic Product Information
This is a 5-year, principal-protected, auto-callable "step-up" market-linked Certificate of Deposit linked to the worse of two technology stocks (NVDA and TSLA). It pays no regular interest.
How it works (plain language)
- Early redemption (auto-call): Once a year (years 1–4) the CD checks whether both stocks are at least at a rising trigger (102% of starting level in year 1, 103% in year 2, 104% in year 3, 105% in year 4). If both clear the trigger, the CD is redeemed early for a fixed step-up payment of $1,125 / $1,250 / $1,375 / $1,500 per $1,000 (+12.5% / +25.0% / +37.5% / +50.0%).
- If never called, at maturity (5 years): if both stocks finish above their starting levels, the investor receives principal plus 100% of the worse performer's gain (uncapped upside). If either stock finishes at or below its starting level, the investor receives only the principal back.
- Principal safety: the deposit amount is protected and insured by the FDIC up to applicable limits; there is no knock-in barrier and no downside leverage.
The payoff hinges on the worst of the two stocks — holding two names provides no diversification: weak performance by either one caps or eliminates the return.
Key Statistics (annualized)
| Metric | Structured CD | Underlying basket (total return) |
|---|---|---|
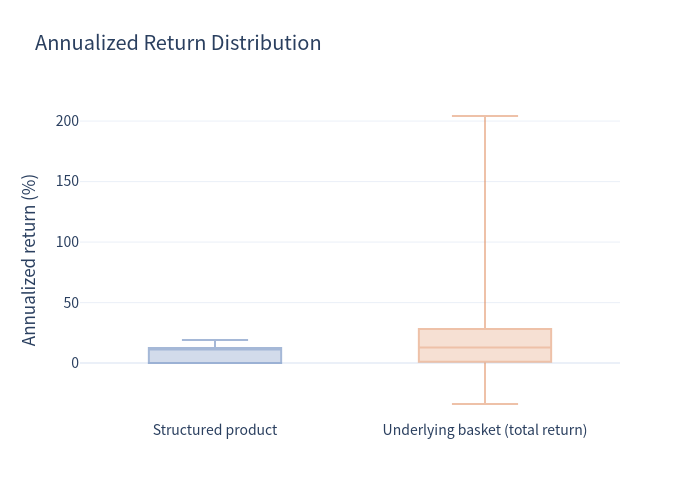
| Expected annualized return | 7.17% | 17.53% |
| Expected annualized volatility | 5.82% | 24.32% |
| Probability of loss | 0.00% | 23.23% |
| 99% confidence VaR (1 year) | 0.00% | −19.47% |
The benchmark is a 50/50 equal-weight basket of NVDA and TSLA (with dividends included, ≈0.22% weighted yield).
Simulation Charts
Product vs. underlying return
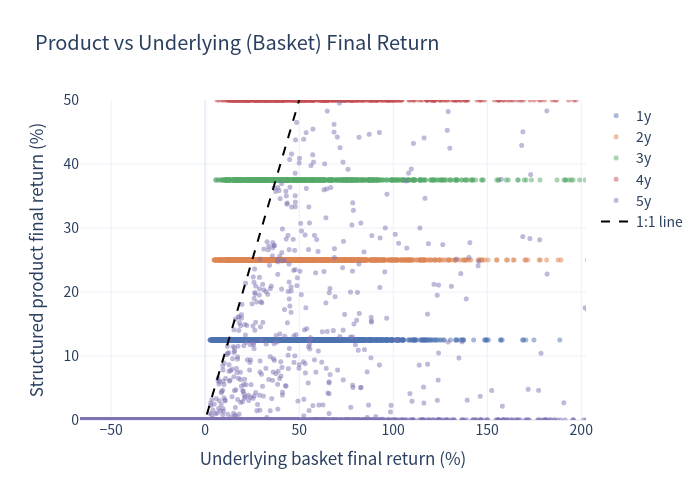
Each dot = one simulation; colour = years held. All product outcomes sit on or above the zero line; the horizontal banding reflects the fixed step-up payments at each call date.
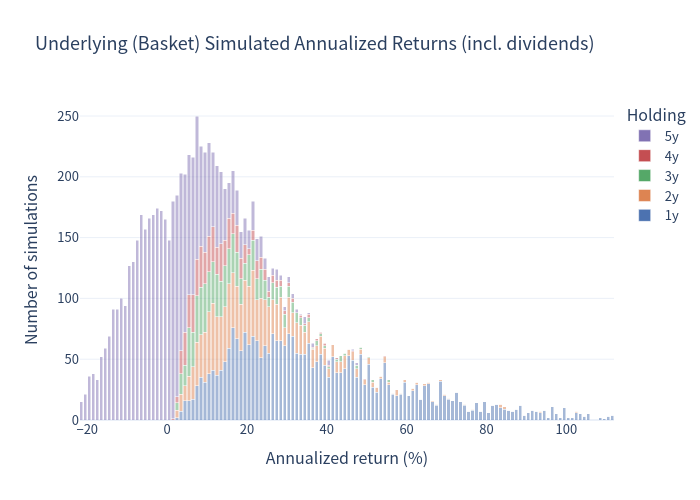
Underlying basket — simulated annualized returns
Bins of 1%, stacked by holding period.
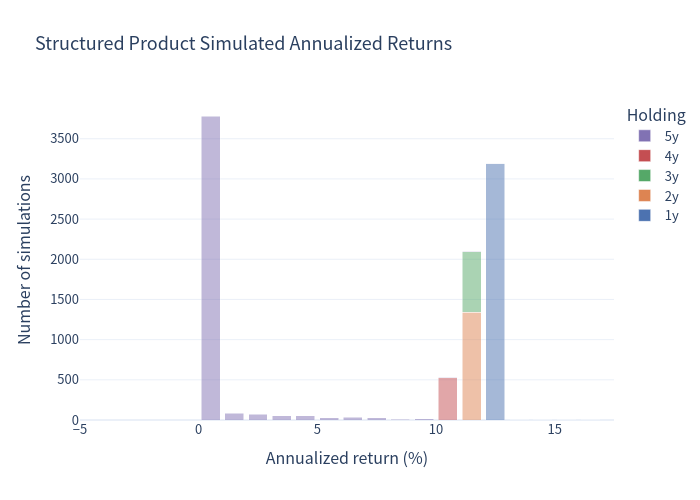
Structured CD — simulated annualized returns
Bins of 1%, stacked by holding period. The large cluster at 0% corresponds to CDs held to maturity that returned only principal.
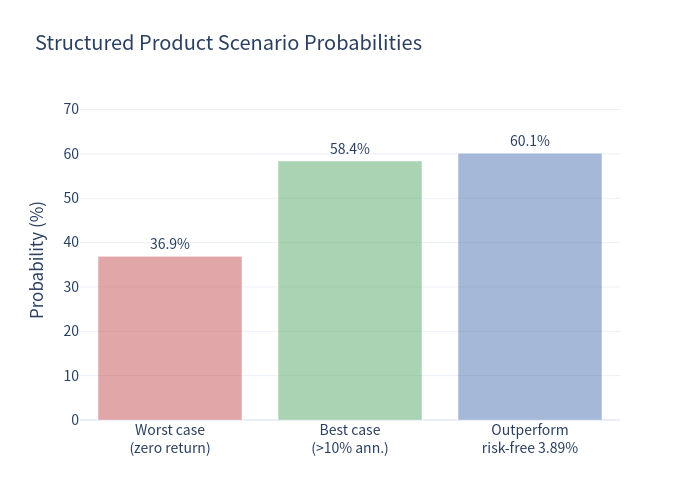
Scenario probabilities
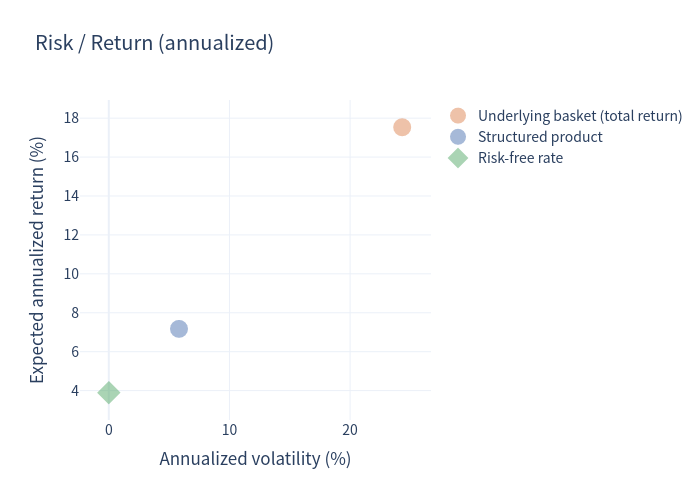
Risk / return profile
Expected annualized return vs. volatility.
Annualized return distribution comparison
Probability of holding period
Investment Commentary
Potential advantages
- Capital protection: every simulated path returned at least the deposit amount, so the CD delivered a 0.00% probability of loss and a 0.00% VaR. Principal is FDIC-insured up to applicable limits, and amounts above the limit carry issuer credit risk only.
- Attractive step-up income when called: the CD is auto-redeemed early in 58.08% of simulations, and those redemptions lock in a fixed 12.5%–50.0% total return (approximately +10.7% to +12.5% annualized) regardless of how far the stocks then run.
- Uncapped upside at maturity: when both stocks finish above their starting levels, the investor captures 100% of the worse performer's gain with no cap.
- Positive expected spread: the 7.17% expected annualized return exceeds the 3.89% risk-free rate by about 3.3 percentage points while offering a materially lower risk profile (volatility of 5.82% vs. 24.32% for the stocks).
Points to weigh
- Upside is truncated by the auto-call. The CD is most likely to be redeemed exactly when the stocks have rallied. In the ~32% of cases redeemed after year 1, the CD returns +12.5% while the equal-weight basket averaged about +40% over the same period — a substantial amount of upside given up.
- The single most common outcome is a zero return. About 36.90% of simulations were held the full five years and returned only the principal (at least one stock at or below its starting level), i.e. a 0% nominal return over five years.
- Worst-of linkage. Returns are driven entirely by the weaker of NVDA and TSLA; strong performance by one name does not help.
- Capped income in a strong rally. The step-up payments top out at +50% (about 10.7% annualized if redeemed in year 4); a large move in the stocks beyond the trigger is not shared.
Both underlying stocks are high-volatility, single-name technology equities, and the analysis is based on simulated (not actual) future outcomes. This commentary describes risk/return characteristics and is not investment advice or a suitability assessment.