
Callable Multi Barrier Reverse Convertible on Adecco, Galderma & Glencore
ISIN CH1593785525 · SIX Symbol AHUATQ · Coupon 15.60% p.a. · Quanto CHF · Listed on SIX Swiss Exchange
1. Headline Simulation Results
| Metric | Value |
|---|---|
| Expected annualized return | 8.53% |
| Expected total return over the realised holding period | 8.77% |
| Expected holding period | 13.28 months (≈ 1.11 years) |
| Probability of a negative return (annualized) | 19.12% |
| 99% confidence VaR (1 year) | −34.00% |
Results are based on 10,000 Monte Carlo simulations of the three underlyings over the 15-month maximum life of the note.
In one line: the note offers a high, frequent coupon (over 80% of outcomes return close to the full annualised coupon rate), a below-market probability of any loss, and lower volatility than the shares — but it caps upside completely and carries a fatter left tail than simply owning the shares.
2. How the Product Works (plain language)
This is a yield-enhancement note (a "reverse convertible") linked to the worst-performing of three shares: Adecco Group, Galderma Group and Glencore.
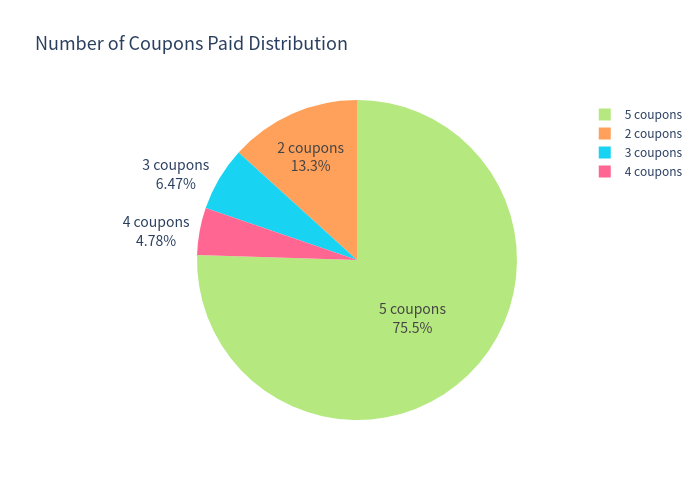
- You are paid a fixed coupon of 15.60% per year (3.90% each quarter) no matter what the shares do. The coupons are paid in cash on each quarterly date and do not depend on the underlyings' performance.
- Upside is capped. If everything goes well you simply receive your CHF 1,000 back at maturity — you never participate in a further rise in the shares.
- The downside protection is conditional — there is a "barrier". If at any time during the ~15-month life any one of the three shares trades at or below 59% of its starting level, the protection is switched off permanently.
- If that barrier is hit and the worst-performing share is below its starting level at maturity, you do not get par back: you receive that worst-performing share (or its cash equivalent) and therefore take the loss on the capital.
- The issuer can call the note early on three scheduled observation dates (roughly months 6, 9 and 12). If called, you get your capital back plus the coupon for that date and nothing more.
It is the barrier and the redemption amount — not the coupon — that depend on the worst of the three shares.
3. Basic Product Information
| Field | Value |
|---|---|
| Product type | Callable Multi Barrier Reverse Convertible (worst-of), Quanto CHF |
| Underlyings | Adecco Group AG, Galderma Group AG, Glencore PLC |
| Coupon | 15.60% p.a., paid quarterly (5 × 3.90%) |
| Barrier level | 59.00% of initial level, observed continuously |
| Strike / conversion | 100.00% (physical delivery of the worst-of share) |
| Early redemption | Issuer callable at ~months 6, 9 and 12 |
| Maximum term | ~15 months (Final Fixing 17 Dec 2027) |
| Currency | CHF (quanto — FX risk hedged) |
4. Key Statistics — Structured Product vs Underlying Basket
The benchmark is an equally-weighted basket of the three underlyings, measured on a total-return basis (price return plus dividends).
| Metric | Structured Product | Underlying Basket (Total Return) |
|---|---|---|
| Expected annualized return | 8.53% | 10.70% |
| Expected annualized volatility | 14.48% | 17.99% |
| Median annualized return | 15.32% | 8.56% |
| Probability of loss | 19.12% | 29.69% |
| 99% confidence VaR (1 year) | −34.00% | −22.37% |
| 5th percentile (annualized) | −24.90% | −14.79% |
| 95th percentile (annualized) | 15.60% | 43.72% |
Outcome probabilities for the note:
| Outcome | Probability |
|---|---|
| Called early by the issuer (par + coupon returned) | 24.51% |
| Survives to maturity with no barrier breach (par returned) | 55.90% |
| Barrier breached, worst-of finishes at/above strike (par returned) | 0.01% |
| Barrier breached and worst-of finishes below strike (capital loss) | 19.60% |
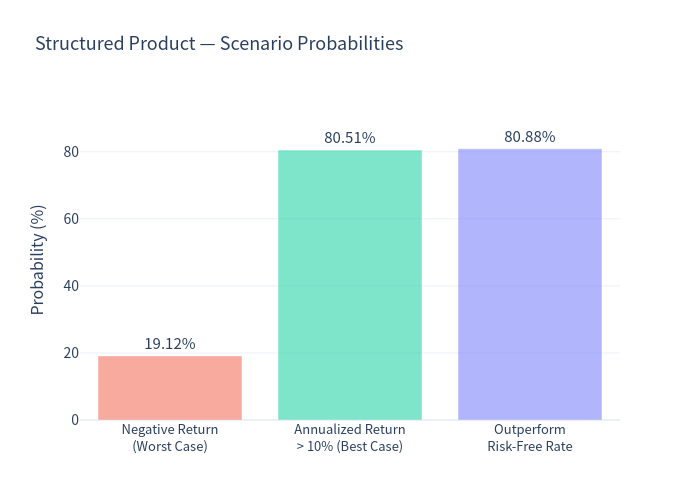
| Annualized return above 10% | 80.51% |
| Beats the risk-free rate (≈ −0.05%) | 80.88% |
| Beats buying the underlying basket | 48.75% |
5. Charts
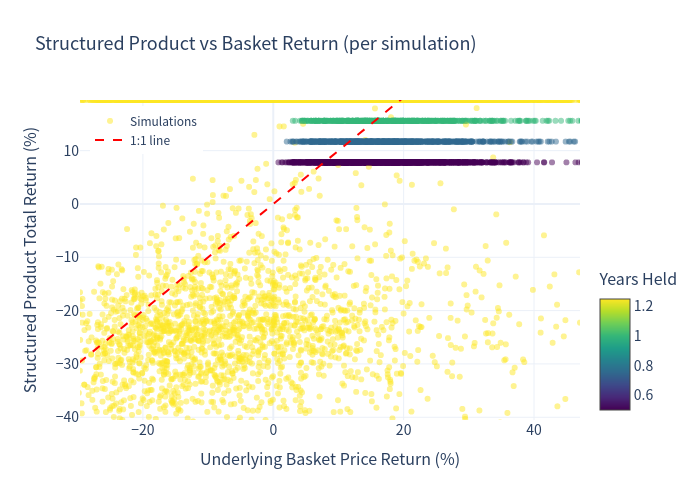
Product outcome vs underlying (each point = one simulation)
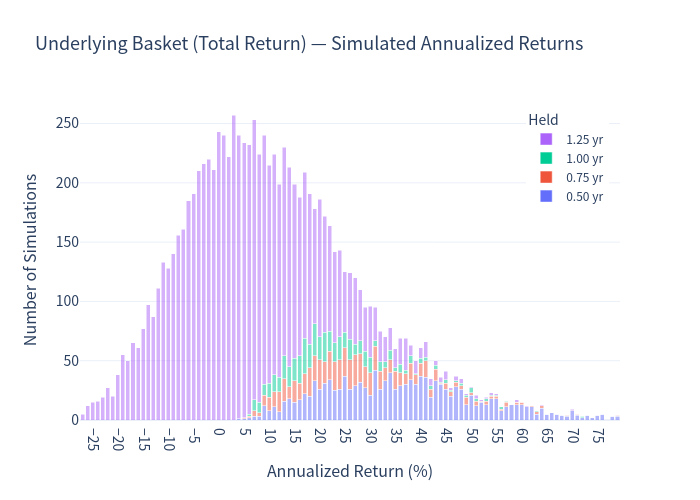
Distribution of annualized returns — Underlying Basket (total return)
Distribution of annualized returns — Structured Product
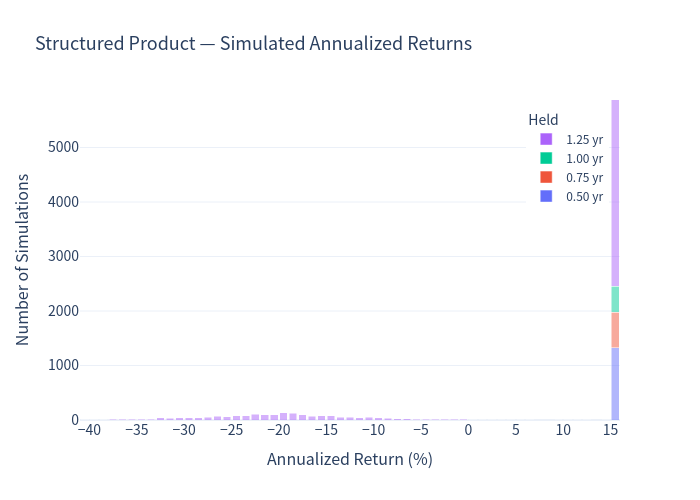
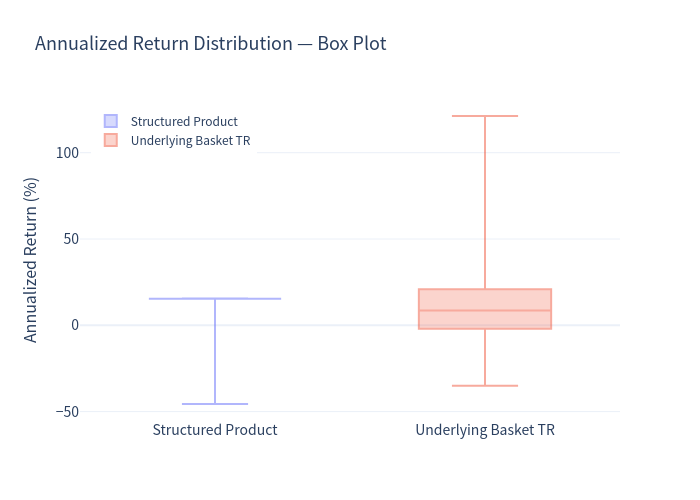
The product histogram is dominated by two spikes around 15.3%–15.6%: whenever the barrier is not breached (or the note is called early), the note simply pays its fixed coupon, so most outcomes converge on the same annualized figure. By contrast, the basket has a broadly spread, right-skewed distribution that reaches much higher (its 95th percentile is 43.72%) — the upside the note gives up.
Scenario probabilities
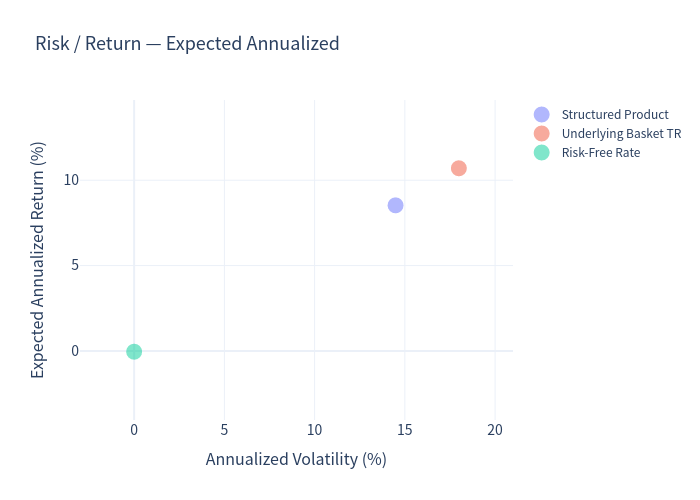
Risk / Return
Annualized return distribution — box plot
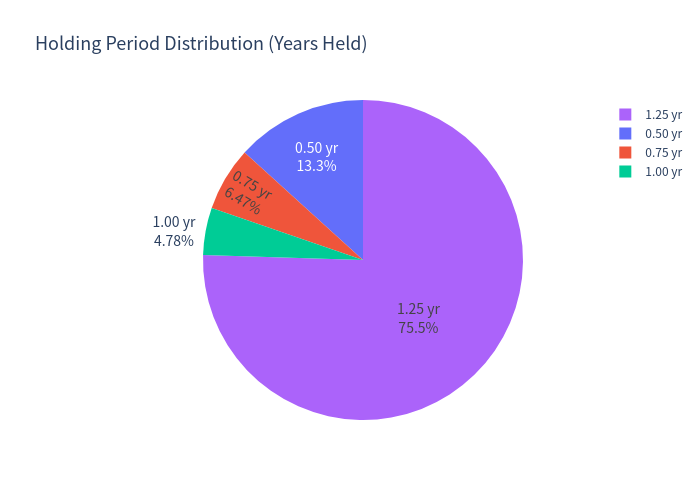
Holding-period and coupon distributions
6. Investment Commentary
Why the figures look the way they do. 15.60% p.a. is an attractive headline coupon for a ~15-month note, and 80.5% of simulated paths deliver an annualized return above 10%. The note also smooths the ride versus owning the shares directly: its volatility (14.48%) is roughly a fifth lower than the basket's (17.99%), and the chance of ending with a loss (19.12%) is materially below the basket's (29.69%), because the coupons keep accruing even when prices fall.
The trade-offs. The higher coupon is paid for with (i) a complete cap on upside — you never receive more than par plus coupons, so the note captures none of the basket's strong rallies — and (ii) a worse severe-loss profile. Once the 59% barrier is breached and the worst share finishes below its starting level, there is no protection and the payout tracks the worst share down. That is why the note's 99% VaR (−34.00%) is deeper than the basket's (−22.37%) even though its day-to-day volatility and probability of loss are lower. Roughly one path in five (19.60%) suffers a capital loss, and the average annualized return (8.53%) trails the basket's total return (10.70%).
Points worth highlighting
- A high, quarterly-paid coupon that accrues regardless of market direction.
- Lower volatility and a lower probability of loss than holding the equivalent basket of shares.
- A meaningful cushion: the barrier at 59% means the worst share can fall ~41% before protection is lost.
- Issuer call optionality works against the holder: when the shares rise, the note is likely to be redeemed early, so strong markets deliver the coupon for only a few quarters (24.51% of paths are called before maturity).
- Best suited to a view that the three shares will be broadly flat to moderately higher and that none will fall more than ~41%; the coupon is compensation for accepting worst-of downside and capped upside.
Annualised figures are sensitive to holding period: about 13% of paths are held only six months, where linear annualisation can exaggerate the headline rate. The expected total return over the realised holding period (8.77%) and the expected holding period (13.28 months) should be read alongside the annualised number.