
Structured Product Analysis Report
Morgan Stanley SPXFP Market-Linked Notes due June 28, 2030
Principal-protected market-linked notes linked to the S&P 500 Futures Excess Return Index ("SPXFP"), issued by Morgan Stanley Finance LLC and guaranteed by Morgan Stanley. CUSIP 61781FT52. The note is expected to be held to maturity (48 months) in 100% of simulations — it has no early-redemption feature.
Headline Simulation Results
| Metric | Structured Product | Underlying (S&P 500 proxy, total return) |
|---|---|---|
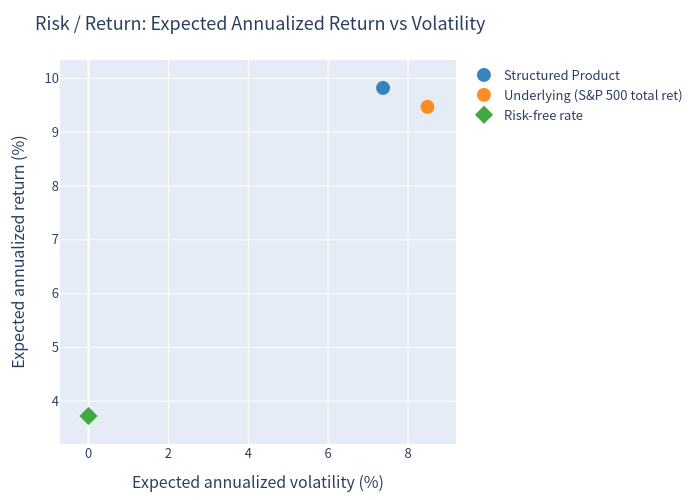
| Expected annualized return | 9.82% | 9.47% |
| Expected total return over 4-year holding | 49.46% | 47.46% |
| Probability of a negative return | 0.00% | 13.37% |
| 99% confidence VaR (1-year) | 0.00% | -12.80% |
| Expected annualized volatility | 7.37% | 8.49% |
The note is expected to be held to maturity (48 months) in 100% of simulations — it has no early-redemption feature.
Basic Product Information
| Type | Principal-protected market-linked note linked to the S&P 500 Futures Excess Return Index ("SPXFP"), issued by Morgan Stanley Finance LLC and guaranteed by Morgan Stanley. |
| Term | ~4 years (priced June 2026, matures June 28, 2030). Single final observation at maturity. |
| Coupon | None (the notes do not pay interest). |
| Upside participation | 106.50% of any positive index move (final rate to be set within 106.50%–111.50%; this analysis uses the 106.50% lower bound). No upside cap. |
| Downside protection | 100% principal protection — at maturity the investor receives at least the stated principal amount regardless of how far the index falls. |
| Payments subject to | Issuer/guarantor credit risk. |
Instead of buying the S&P 500 futures index directly, the investor lends $1,000 (per note) and receives back a payoff at maturity that depends only on the index level on one date (the observation date, ~4 years later). If the index is up, the investor receives par plus 106.50% of the percentage gain. If the index is flat or down, the investor receives exactly the $1,000 back — the downside is fully cushioned, but there is no coupon and no interim payments along the way.
Key Statistics
| Statistic | Structured Product | Underlying (total return incl. dividends) |
|---|---|---|
| Expected annualized return | 9.82% | 9.47% |
| Median annualized return | 9.57% | 10.04% |
| Expected annualized volatility | 7.37% | 8.49% |
| Probability of loss | 0.00% | 13.37% |
| 99% VaR (1-year) | 0.00% | -12.80% |
| 5th percentile annualized | 0.00% | -5.38% |
| 95th percentile annualized | 22.49% | 22.42% |
| Probability of positive annualized return | 84.42% | 86.63% |
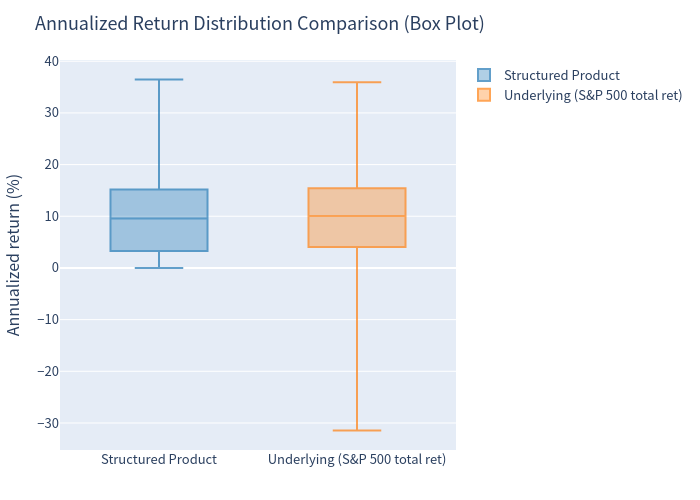
The principal-protection floor removes the entire left tail of the return distribution: the worst outcome is a 0.00% total return (par), whereas a direct investment in the underlying can lose about -12.80% per year at the 99% VaR level. In exchange for that protection the note does not pay the ~1% dividend stream of the equity index, and its participation is applied only to price gains.
Scenario Probabilities (Structured Product)
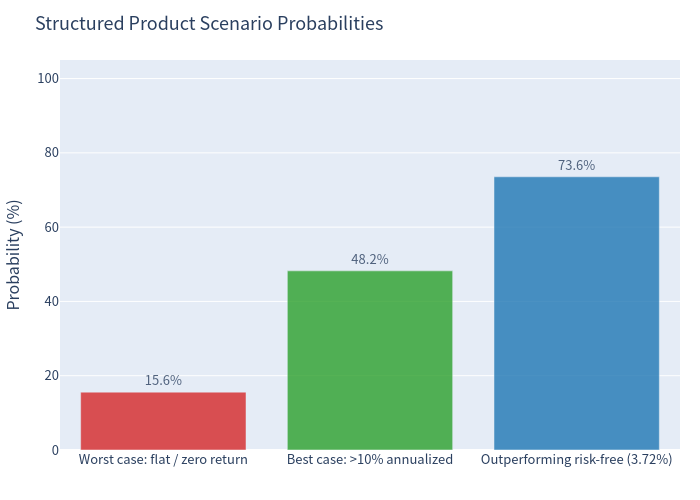
- Probability of a flat / zero return (index ends at or below its initial level): 15.58%
- Probability of a high return (>10% annualized): 48.23%
- Probability of outperforming the risk-free rate (3.72%): 73.55%
Charts
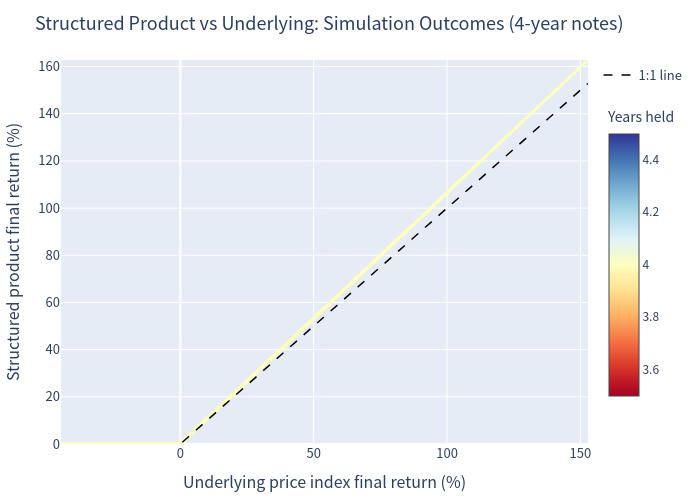
Simulation Outcomes Scatter
Distribution of simulated outcomes across the scenario space for the structured product and the underlying index.
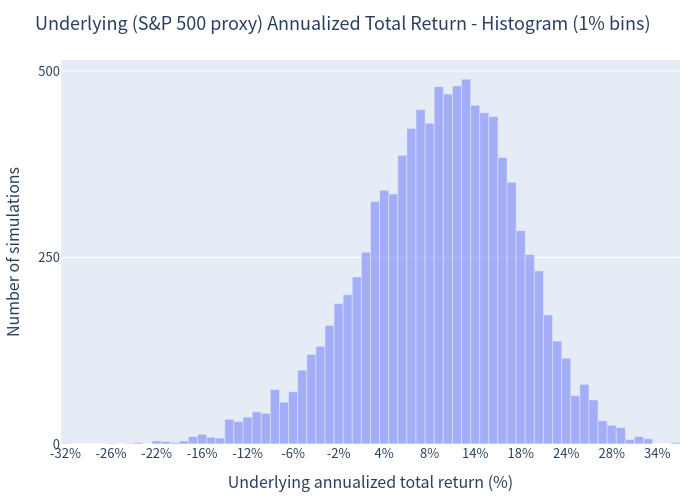
Underlying Annualized Return Histogram
Distribution of simulated annualized returns for a direct investment in the underlying (total return incl. dividends).
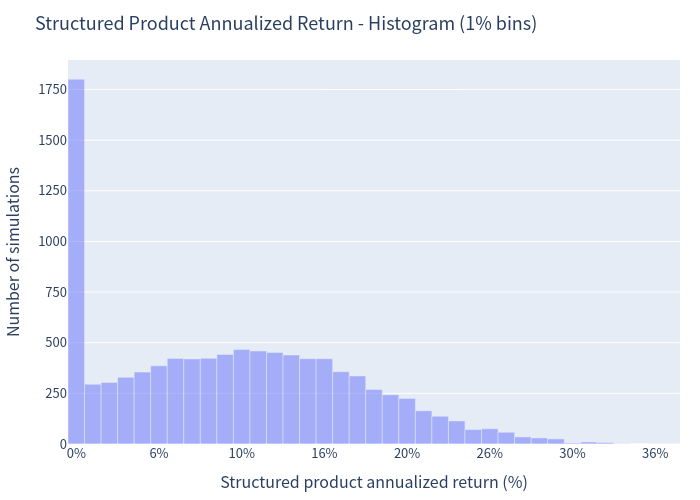
Product Annualized Return Histogram
Distribution of simulated annualized returns for the structured product — note the absence of a left tail due to the principal-protection floor.
Scenario Probability Bar Chart
Probability of key scenario outcomes: zero return, high return (>10% annualized) and outperformance of the risk-free rate.
Risk / Return Scatter
Trade-off between expected annualized return and volatility for the structured product versus the underlying index.
Box Plot Comparison
Distributional comparison of annualized returns between the structured product and the underlying index (median, interquartile range, and extremes).
Investment Commentary
- Full 100% principal protection at maturity removes market downside risk entirely; the probability of losing money is 0% by construction.
- Meaningful upside capture: expected annualized return of ~9.82% exceeds the ~3.72% risk-free rate in ~73.55% of scenarios, with ~48.23% of scenarios delivering more than 10% per year.
- Over the 4-year horizon the expected total return (~49.46%) slightly exceeds that of a direct index investment (~47.46%) while carrying far less tail risk — a favorable asymmetry driven by the downside floor.
- No coupon or interim income; all return is realized only at maturity (4 years later), and the payoff depends on the index level on a single observation date.
- The participation applies to the price appreciation of a futures excess-return index — it does not capture equity dividends or cash-collateral interest, so when the index is flat or falling the note pays only par (0.00% total return over 4 years in ~15.58% of scenarios).
- The result is capped at neither the upside nor downside, but the "opportunity cost" of the protection shows up as lower median returns than the dividend-paying index in rising markets.
- All payments are subject to the credit risk of Morgan Stanley Finance LLC / Morgan Stanley; the note is not equivalent to owning the index.
- Analysis uses the 106.50% participation lower bound; if the final participation rate is set higher (up to 111.50%), results would be modestly better.
This report is a quantitative illustration based on simulated market scenarios and does not constitute investment advice or a suitability assessment.