
15.40% p.a. Multi Barrier Reverse Convertible — Hugo Boss / Kering / Zalando
Headline Results
Basic Product Info
How it works (layman's explanation)
- The investor lends EUR 1,000 and receives a high quarterly coupon of 3.85% (4 payments totalling 15.40% p.a.), paid regardless of how the three stocks perform.
- Issuer call: At month 6 and month 9 the issuer can redeem the product early for par + that quarter's coupon. The issuer is assumed to call only when all three stocks are at or above their initial level — in which case the investor pockets the coupons received so far plus their money back, and the product ends.
- Downside protection (barrier): As long as none of the three stocks ever falls to 59% or below its initial level during the observation period (a continuous "multi-barrier" check on all three), the investor receives 100% of capital back at maturity.
- If the barrier is breached: repayment at maturity depends on the worst-performing stock. If the worst stock finishes at or below its initial level (100%), the investor receives that stock's shares instead of cash (loss proportional to the fall). If the worst stock finishes above its initial level, capital is repaid in full.
- Upside is capped: the investor never participates in stock gains beyond par; returns come from the coupon stream.
Key Statistics — Structured Product vs Underlying
| Metric | Structured Product | Underlying Basket* |
|---|---|---|
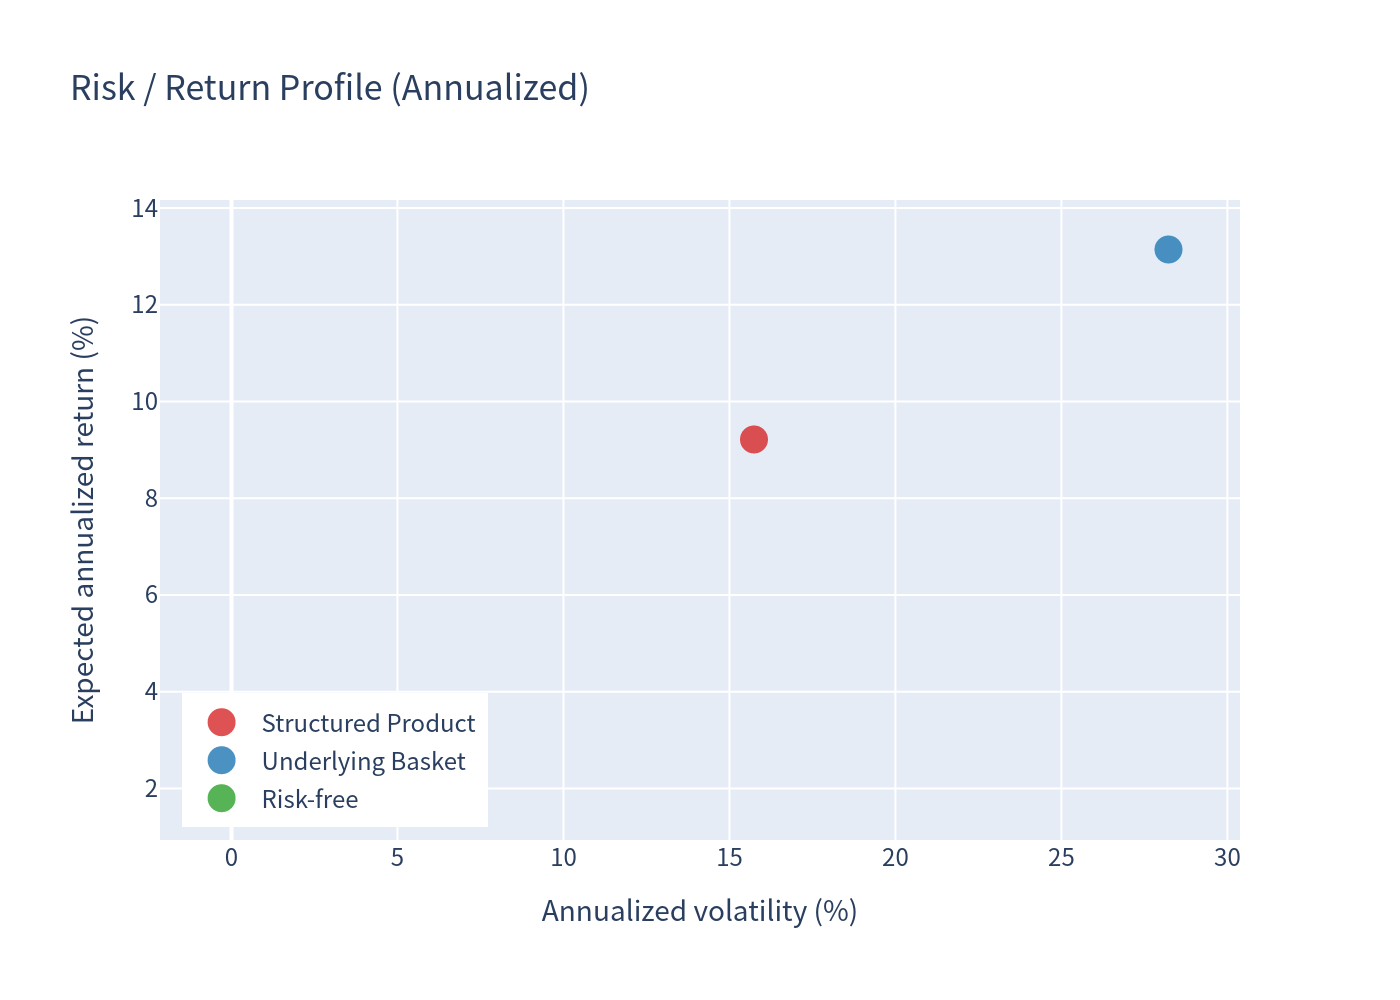
| Expected annualized return | 9.22% | 13.14% |
| Expected annualized volatility | 15.74% | 28.23% |
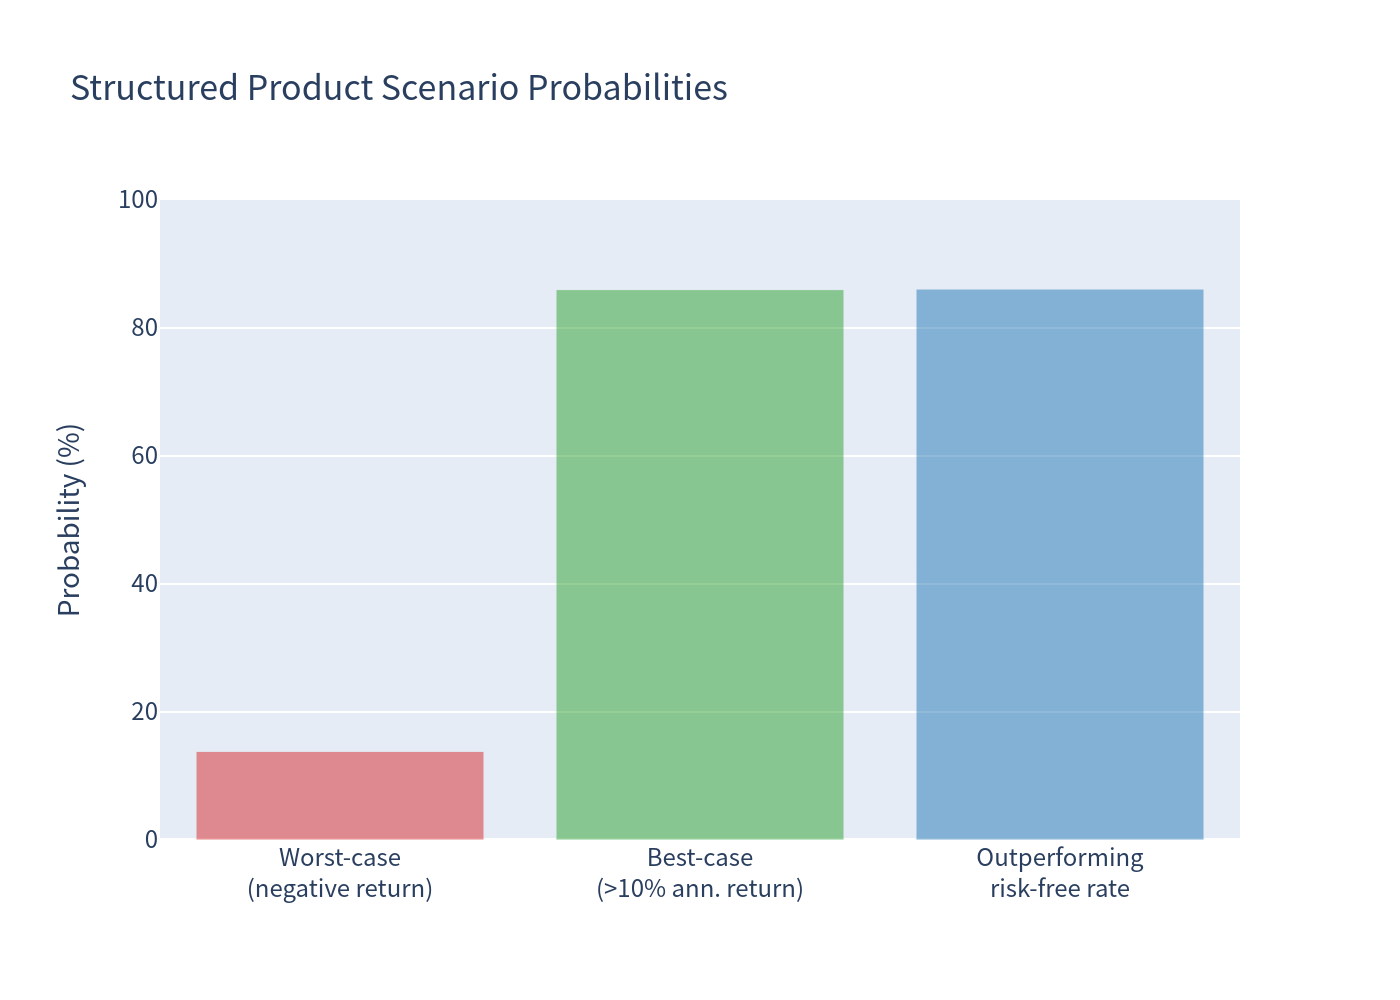
| Probability of loss | 13.85% | 35.74% |
| 99% VaR (1 year) | -42.50% | -37.40% |
*Equal-weight basket of Hugo Boss, Kering and Zalando, total return (price + dividends, ~0.39% dividend yield).
The structured product delivers a lower expected return than the direct basket (9.22% vs 13.14% annualized) but with materially lower volatility (15.74% vs 28.23%) and a much lower probability of loss (13.85% vs 35.74%). The trade-off is a capped upside (max ~15.40%) against a large left tail in the worst barrier-hit scenarios (99% VaR -42.50%).
Simulation Outcomes
Scatter Plot — Product vs Underlying Final Return
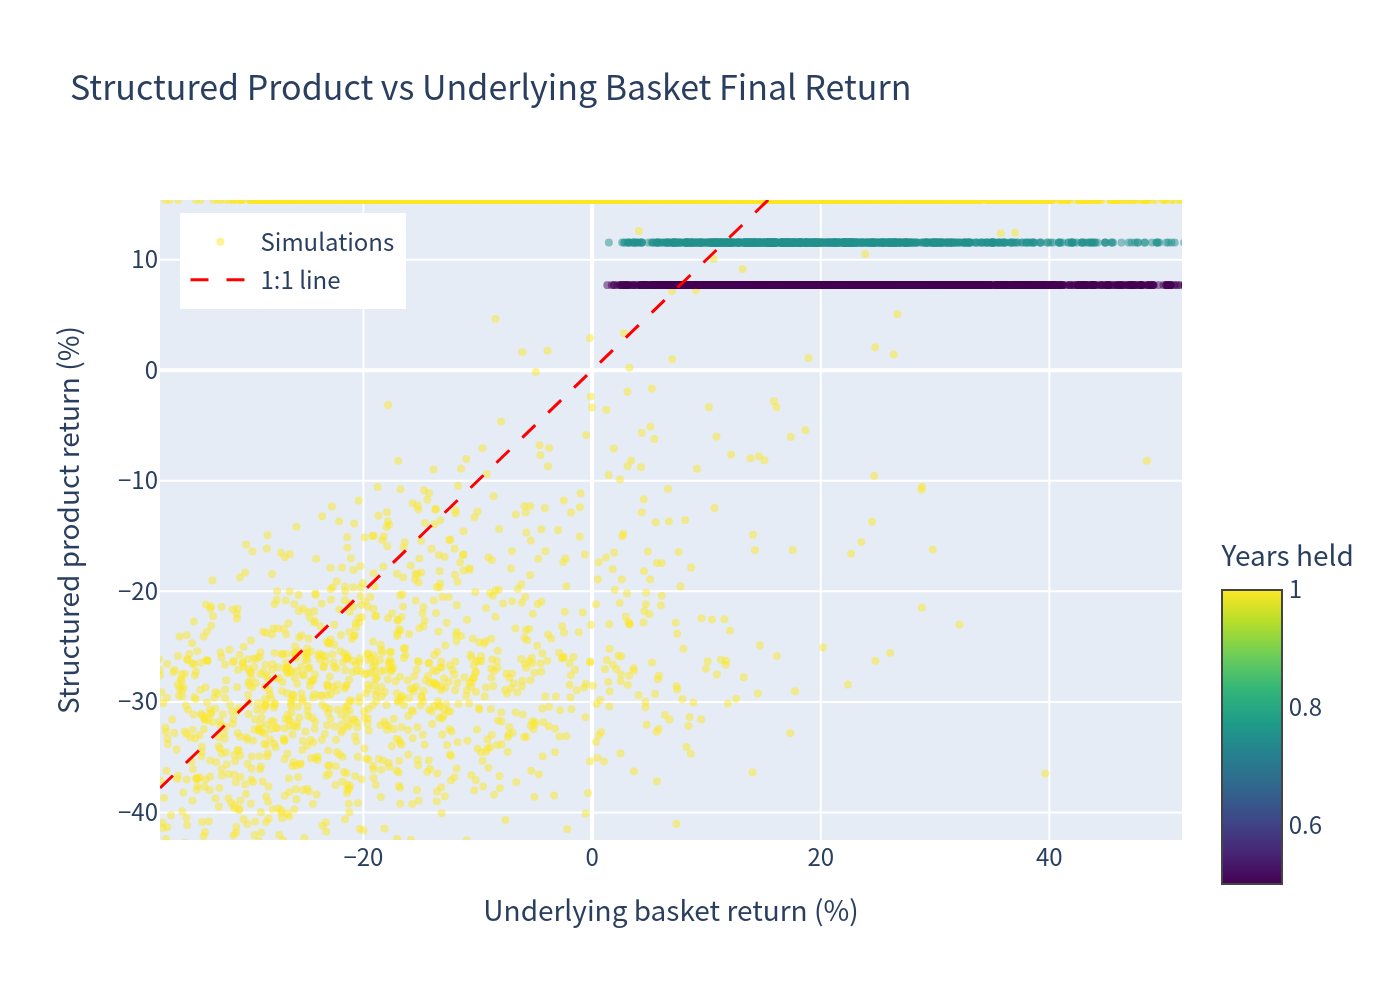
Each dot is one simulated path, coloured by holding period. The red dashed line is the 1:1 reference. The horizontal band near the top shows the capped upside (returns cluster around +15.4% for redeemed/par paths); the downward fan shows barrier-hit paths that received the worst-performing stock.
Annualized Return Distributions
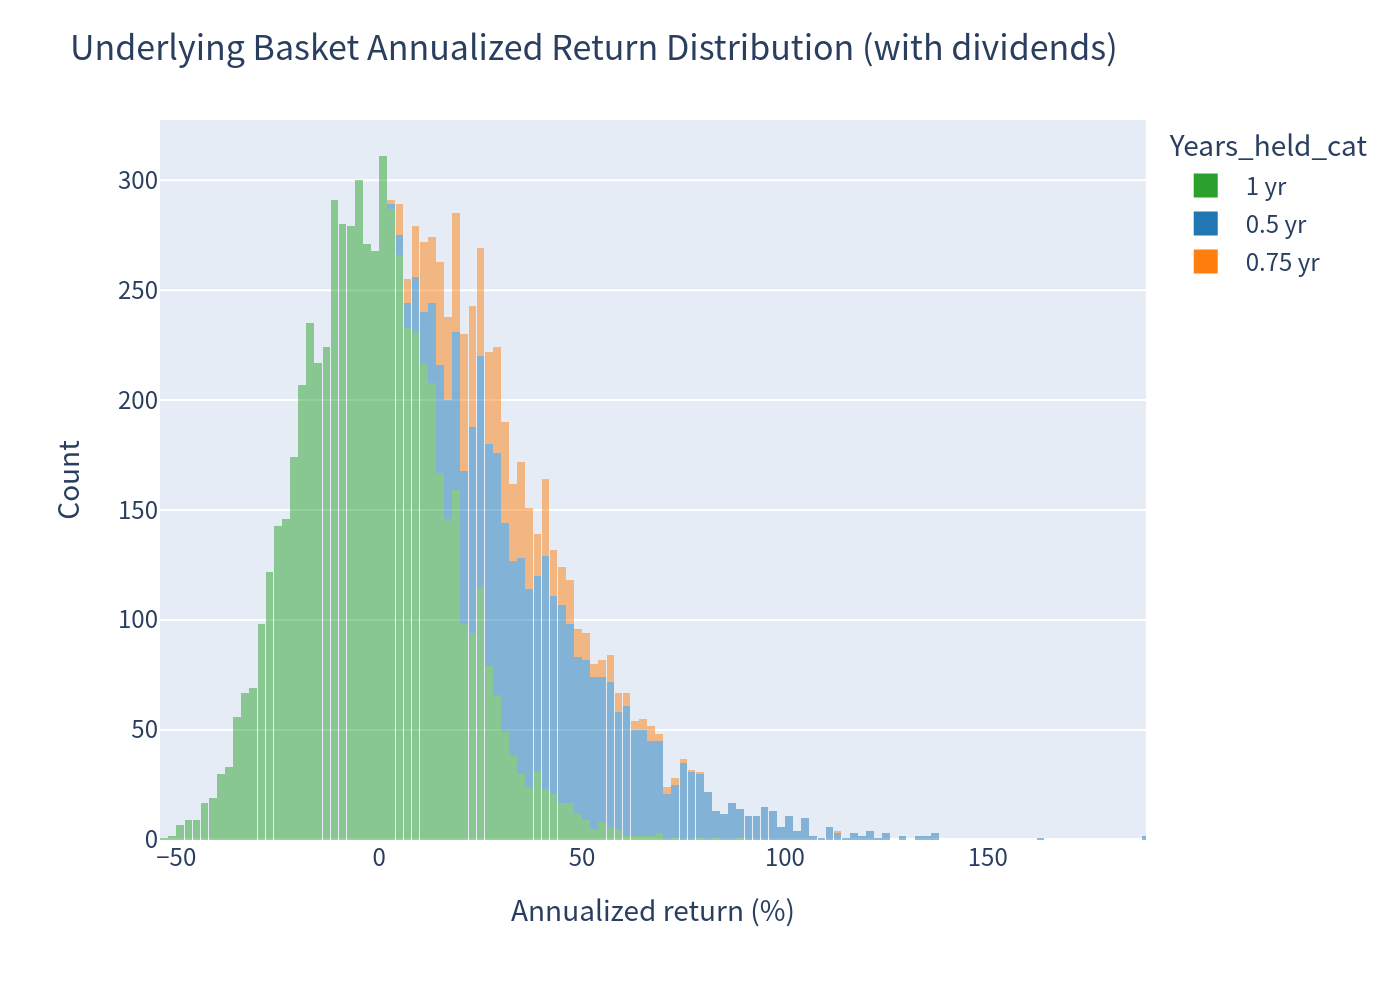
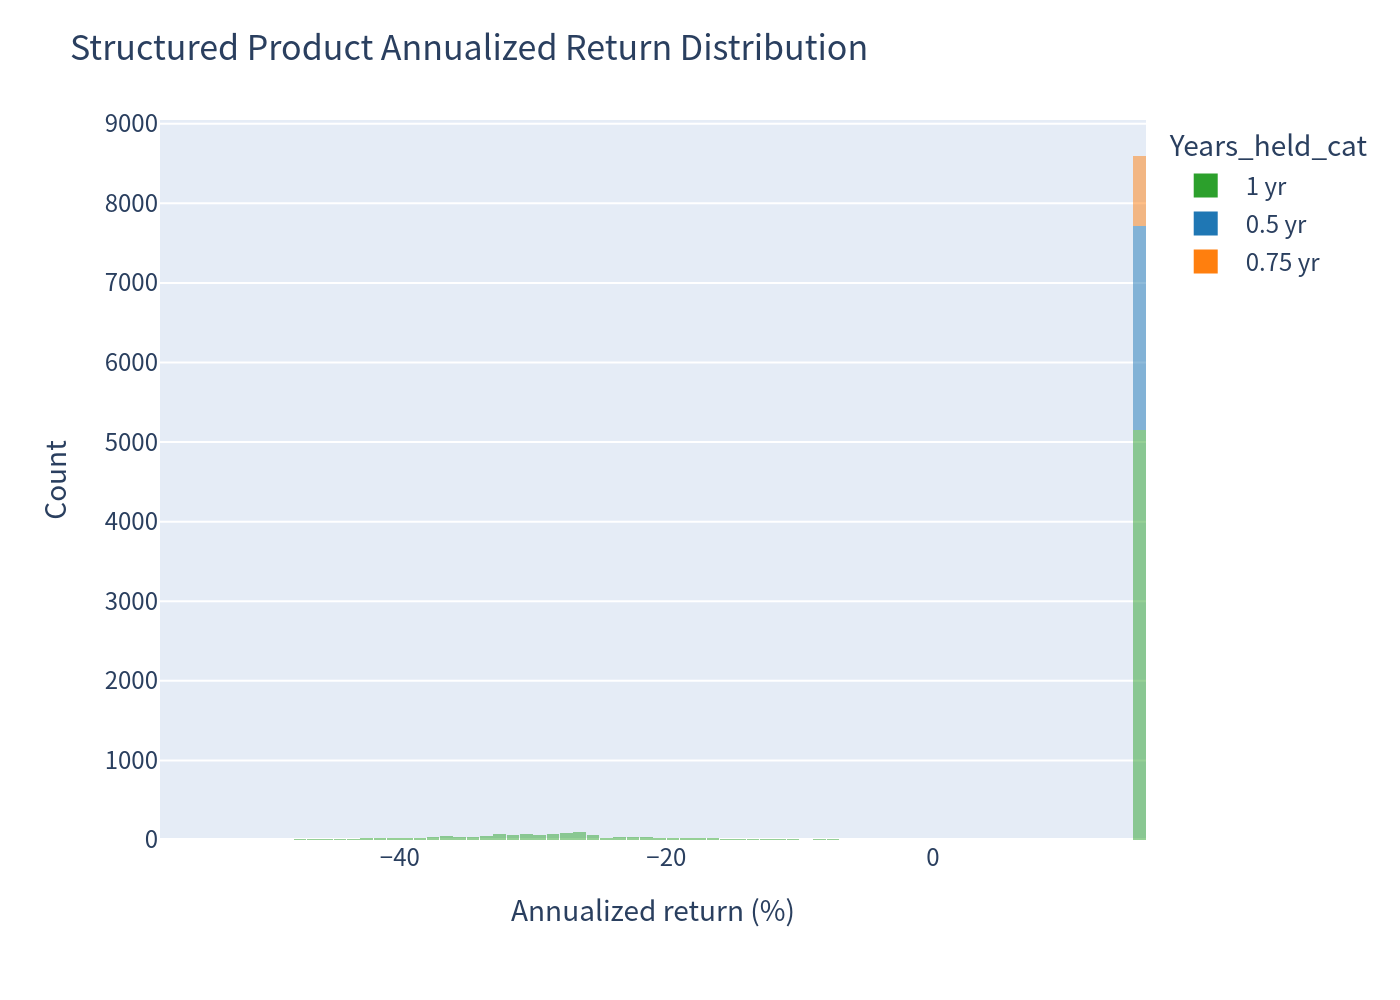
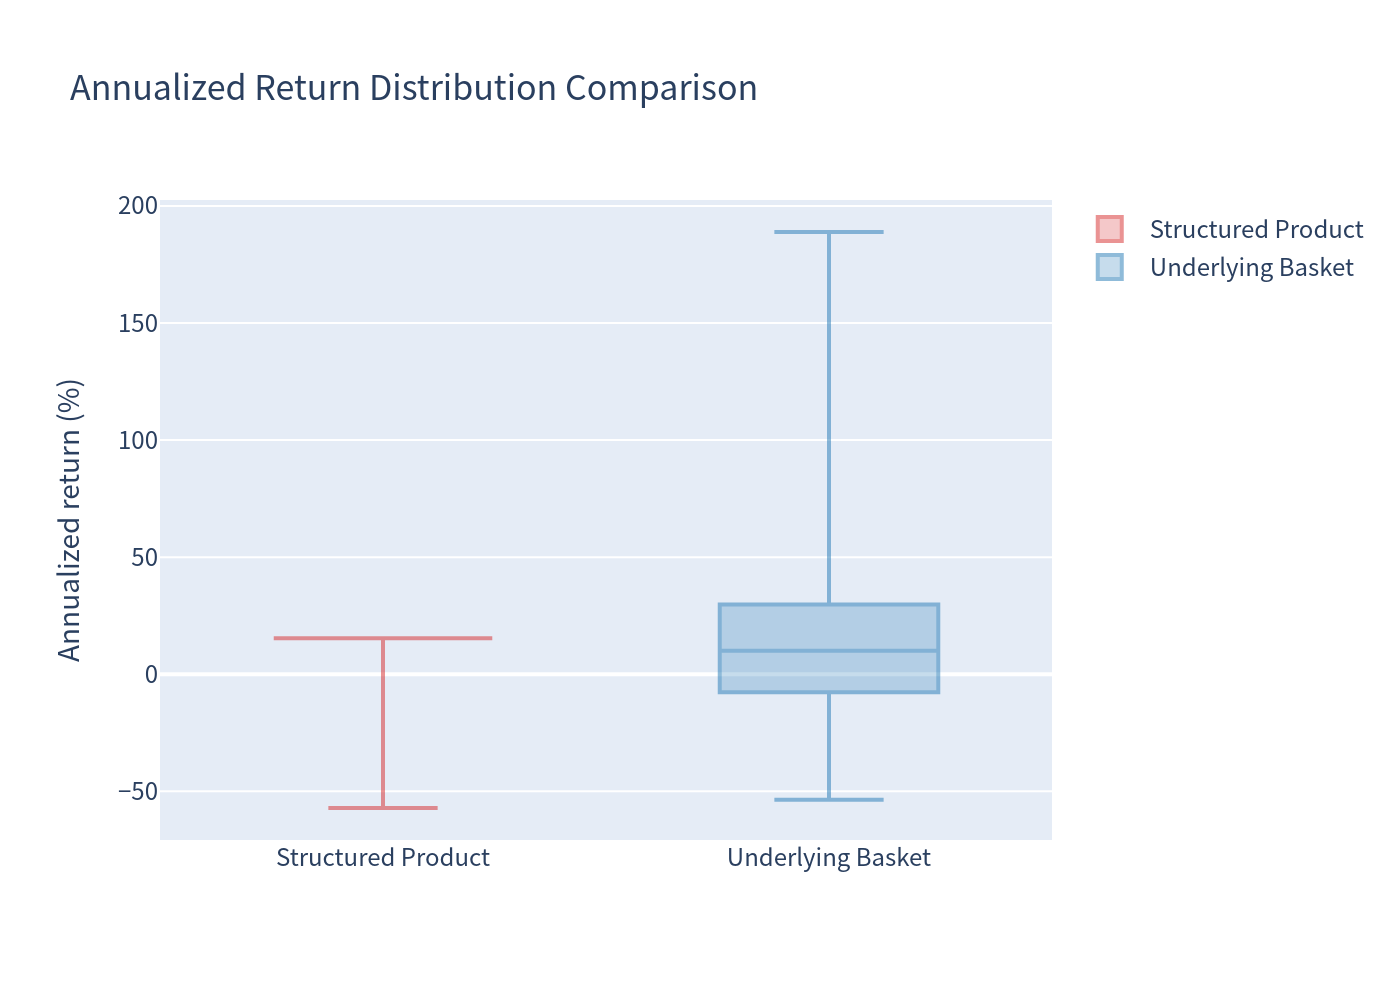
The underlying basket has a wide, roughly symmetric distribution of annualized returns, whereas the product shows a large mass of paths at the +15.4% cap with a left tail of barrier losses.
Scenario Probabilities
Risk / Return Profile
Return Distribution Comparison (Box Plot)
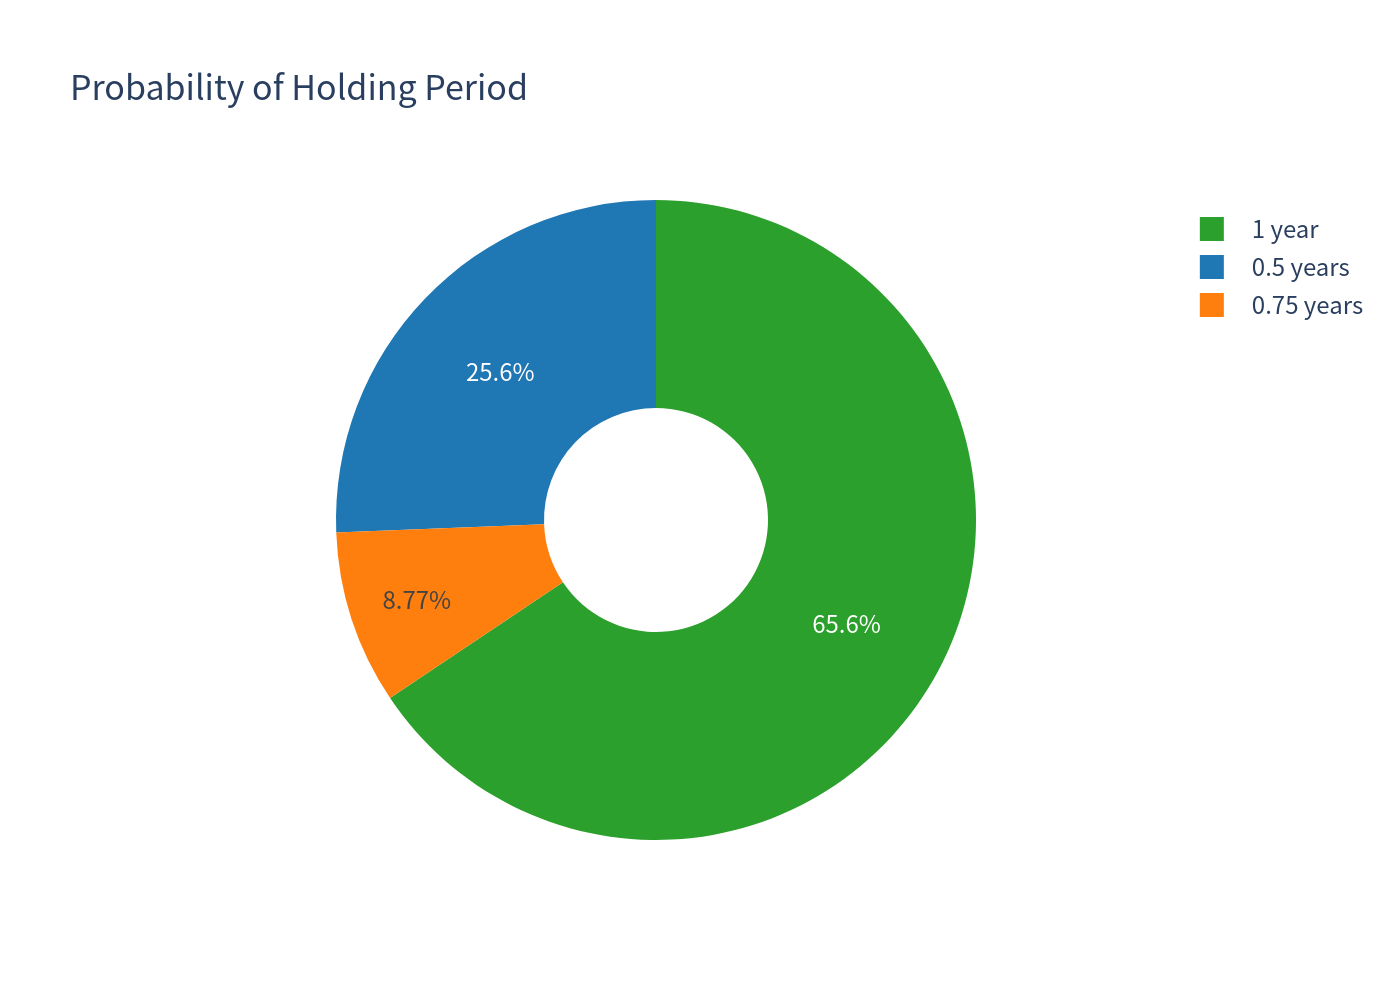
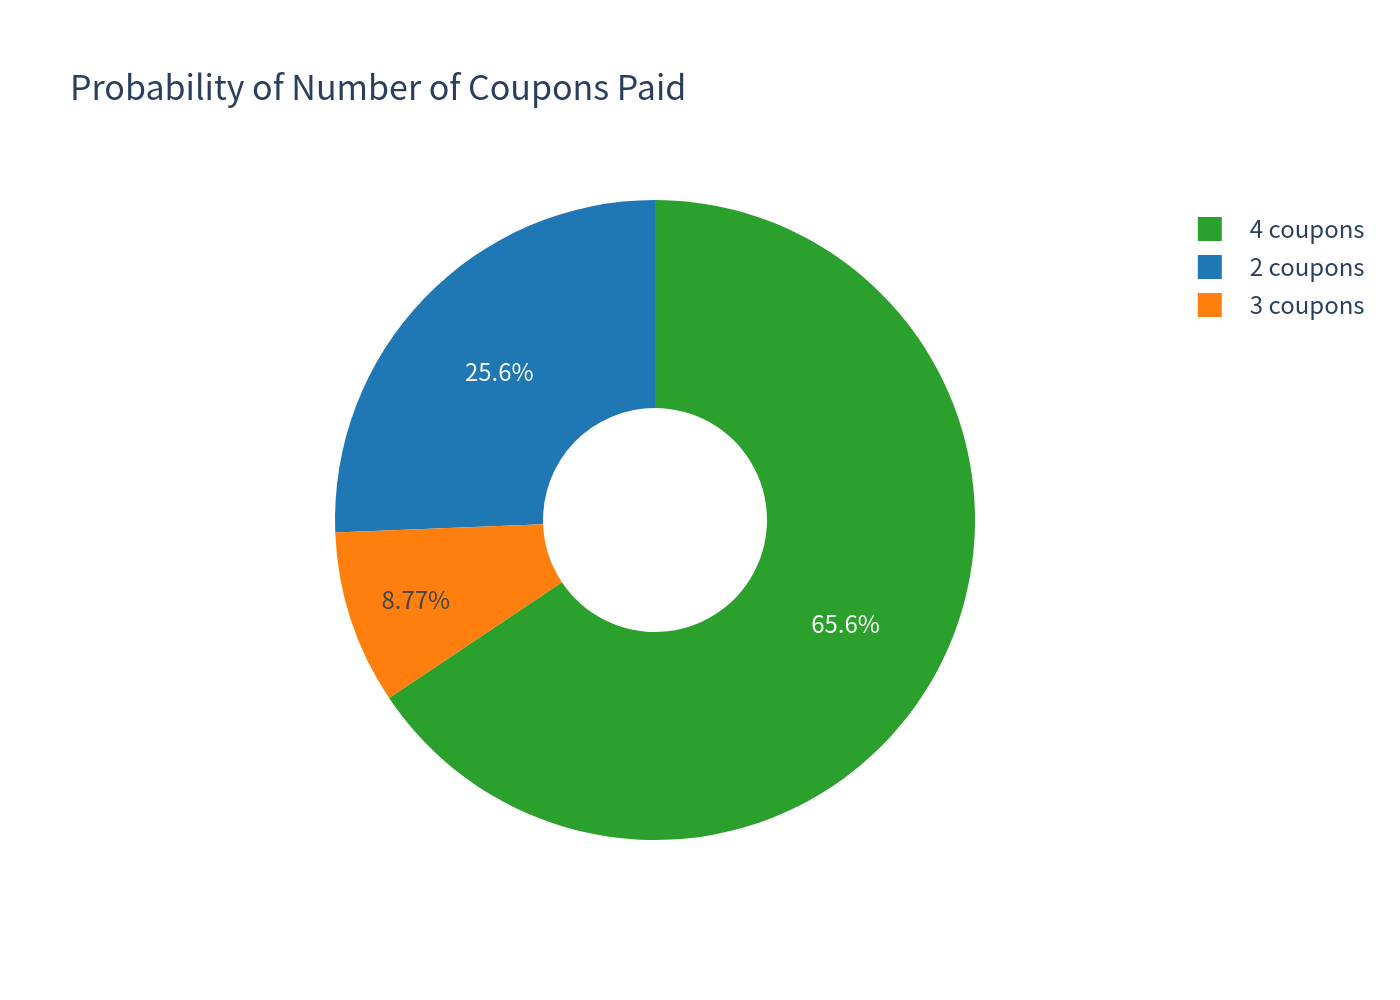
Holding Period & Coupon Outcomes
The product ends early in ~34% of simulations (25.6% at 6 months, 8.8% at 9 months). Correspondingly, investors receive 2 coupons in 25.6% of cases, 3 coupons in 8.8%, and all 4 coupons in 65.6% of cases.
Investment Commentary
What works well
- High coupon income: 15.40% p.a. paid quarterly regardless of underlying performance — a substantial yield in the current ~2% EUR rate environment.
- Conditional capital protection: if no stock breaches the 59% barrier, capital is returned in full together with the coupons received to date — this happens in the majority of scenarios (~79% of maturity paths and all early-redemption paths).
- Reduced loss frequency vs. direct equity exposure: probability of a negative outcome is 13.85% versus 35.74% for holding the basket directly, with roughly half the annualized volatility.
- Attractive risk-adjusted payoff: in a majority of scenarios the product delivers its maximum ~15.4% return, outperforming the risk-free rate in ~86% of simulations.
Points to weigh
- Capped upside: returns never exceed ~15.40%; the investor forgoes any equity upside beyond par.
- Issuer call risk: when all stocks are above their initial levels the issuer may redeem early, shortening the income stream (average holding period 10.2 months rather than 12).
- Worst-of barrier risk: the barrier is breached if any one of the three stocks falls to 59% of initial, and losses at maturity are driven by the worst performer — a 21.4% chance of physical delivery of the weakest stock on maturity paths, with an average loss of ~28.6% in those cases and a 99% VaR of -42.50%.
- Credit risk: this is an unsecured debt instrument of the issuer (Basler Kantonalbank).