
11.60% p.a. Multi Barrier Reverse Convertible on Alcon, Bachem & Holcim (CHF)
Headline simulation results
| Metric | Value |
|---|---|
| Expected annualised return | +4.03% |
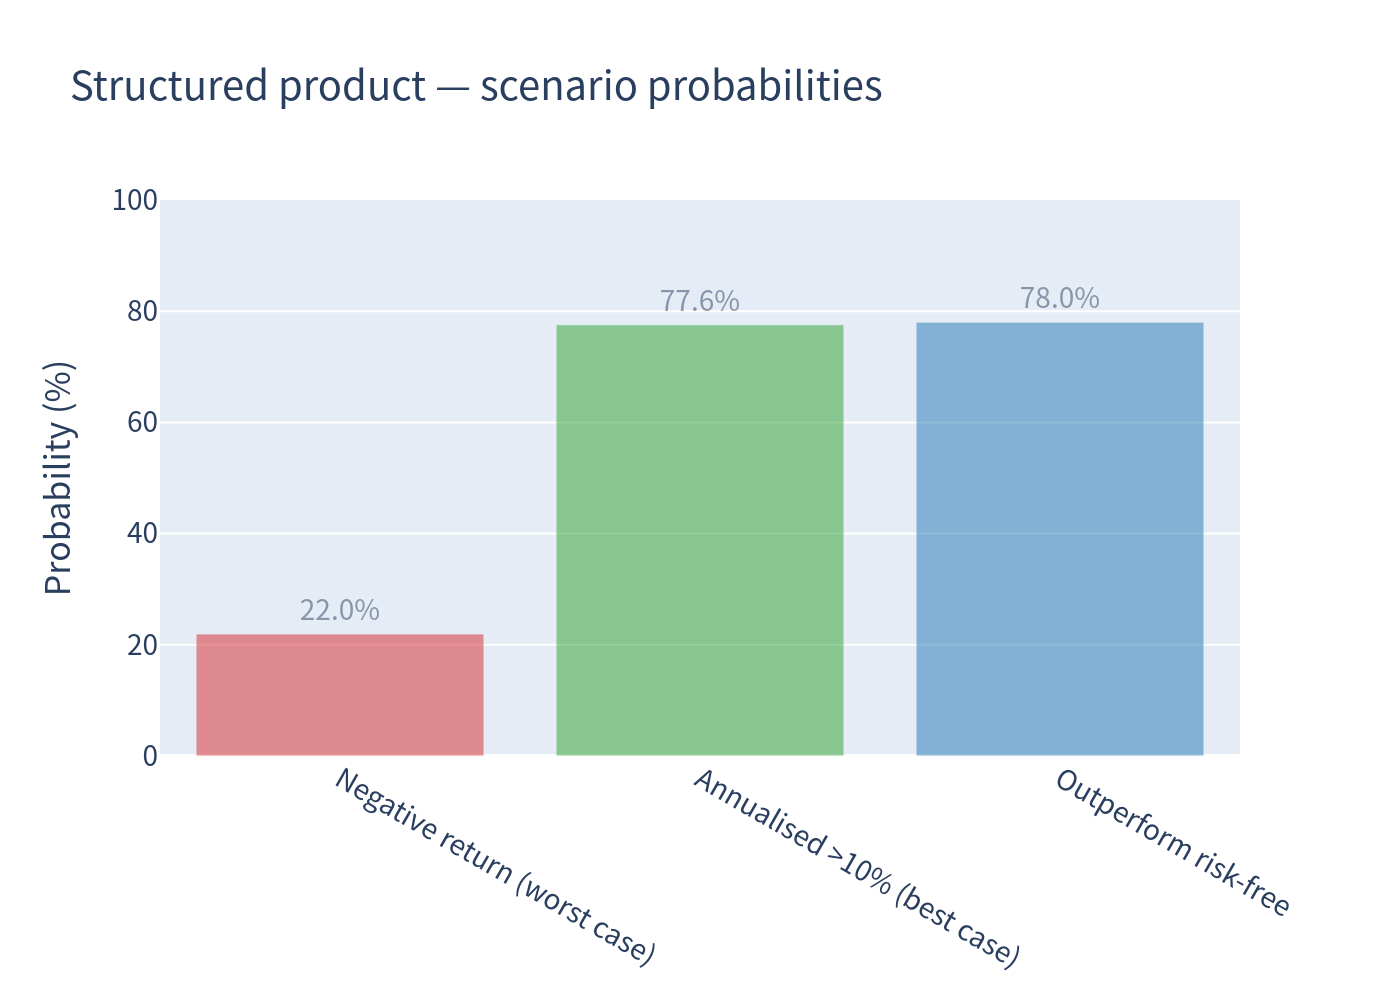
| Probability of a negative return | 21.96% |
| 99% confidence VaR (1-year) | -37.48% |
| Expected total return over the realised holding period | +3.17% |
| Median annualised return | +11.44% |
| Expected holding period | 12.75 months (~1.06 yrs) |
| Probability of outperforming the risk-free rate (~0%) | 78.04% |
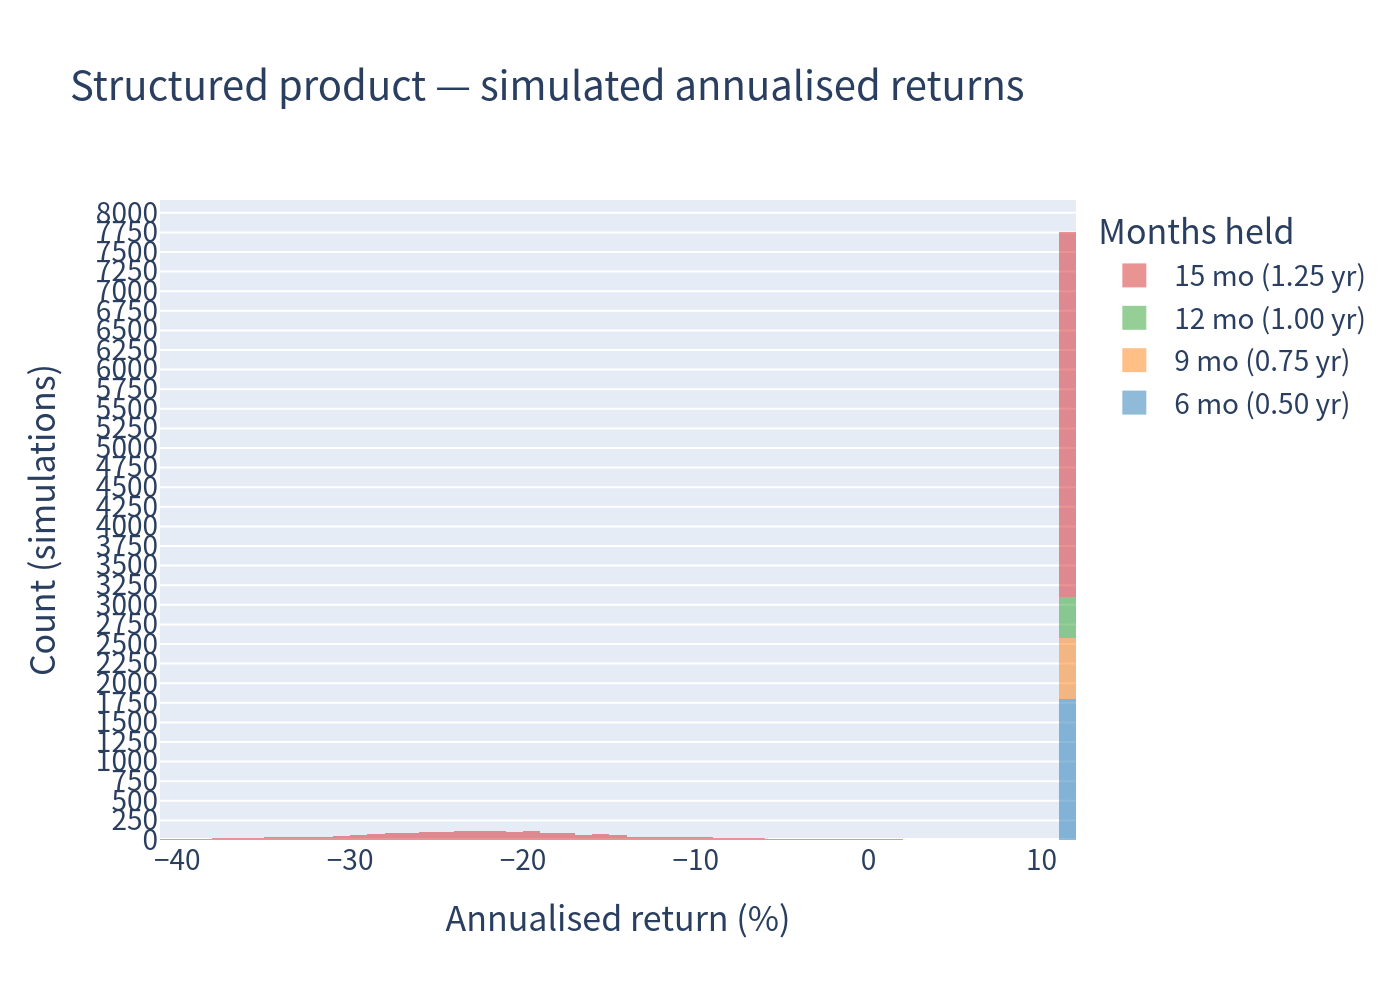
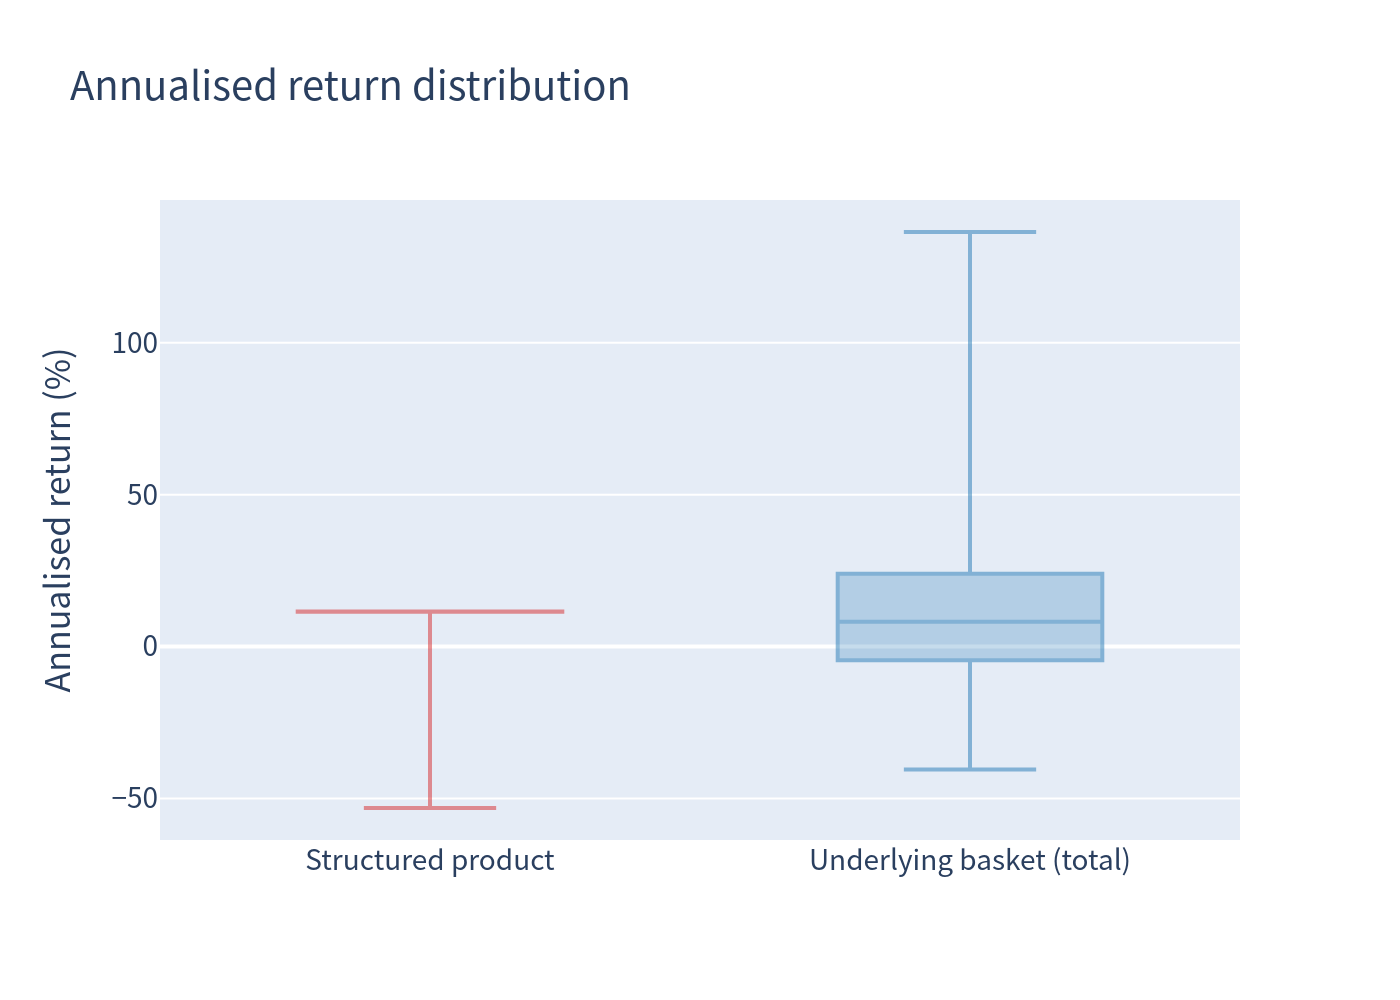
The distribution is strongly bi-modal: in ~78% of simulated paths the investor collects a coupon-like return of around +11–12% p.a., but in the remaining ~22% the 59% barrier is breached and the investor takes the (worst-of) equity downside, which pulls the mean annualised return down to +4.03% while the median stays near the coupon at +11.44%.
Product at a glance
- Type: Worst-of Multi Barrier Reverse Convertible, issuer-callable, CHF-denominated (SSPA 1230)
- ISIN: CH1593789113 | Issue Price: 100.00% | Denomination: CHF 1,000 | Listed on SIX Swiss Exchange
- Underlyings (worst-of): Alcon Inc, Bachem Holding AG, Holcim Ltd
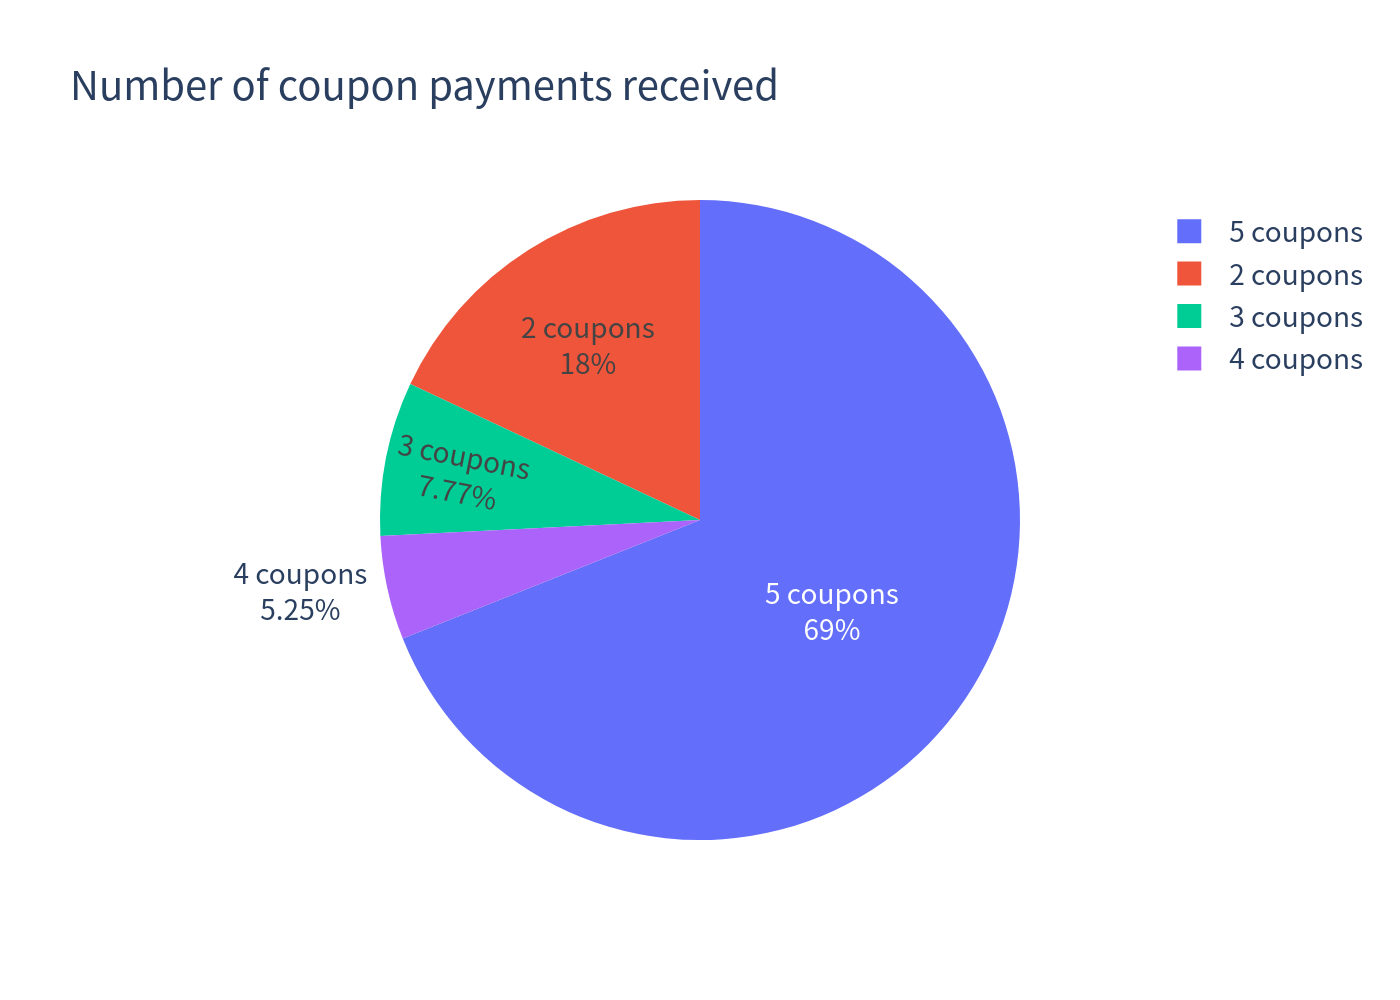
- Coupon: 11.60% p.a., paid quarterly — 5 payments of CHF 29.00 (2.90 index points each)
- Barrier: 59.00% of each share's initial level, continuously observed
- Strike: 100.00% | Upside: fully capped (coupon only)
- Callable: Issuer may redeem at par + coupon on 3 quarterly observation dates
- Maturity: 23/12/2027 (~15 months)
How it works (plain language)
The note behaves like a high-yielding bond as long as the shares hold up:
- Coupons are paid regardless — every quarter the investor receives 2.90 points, no matter what the shares do.
- The 59% barrier is monitored continuously during the whole life. If any one of the three shares ever trades at or below 59% of its start level, downside protection is lost.
- If no barrier breach occurs, the investor gets the full CHF 1,000 back at maturity (plus all coupons).
- If the barrier is breached and the worst-performing share finishes below its start (100%), the investor receives that worst-of share (cash equivalent), i.e. they absorb the share's fall below par — even if it later recovers to between 59% and 100%. If the worst share finishes at/above 100%, par is returned.
- The issuer can call the note early on the quarterly dates, returning par + coupon and ending the product.
The three shares move together (all Swiss, partly correlated), so a market-wide sell-off can knock out the worst-of barrier for all of them at once — this is the key risk.
Key statistics (simulated, same holding horizon)
| Structured product | Underlying basket (total return) | |
|---|---|---|
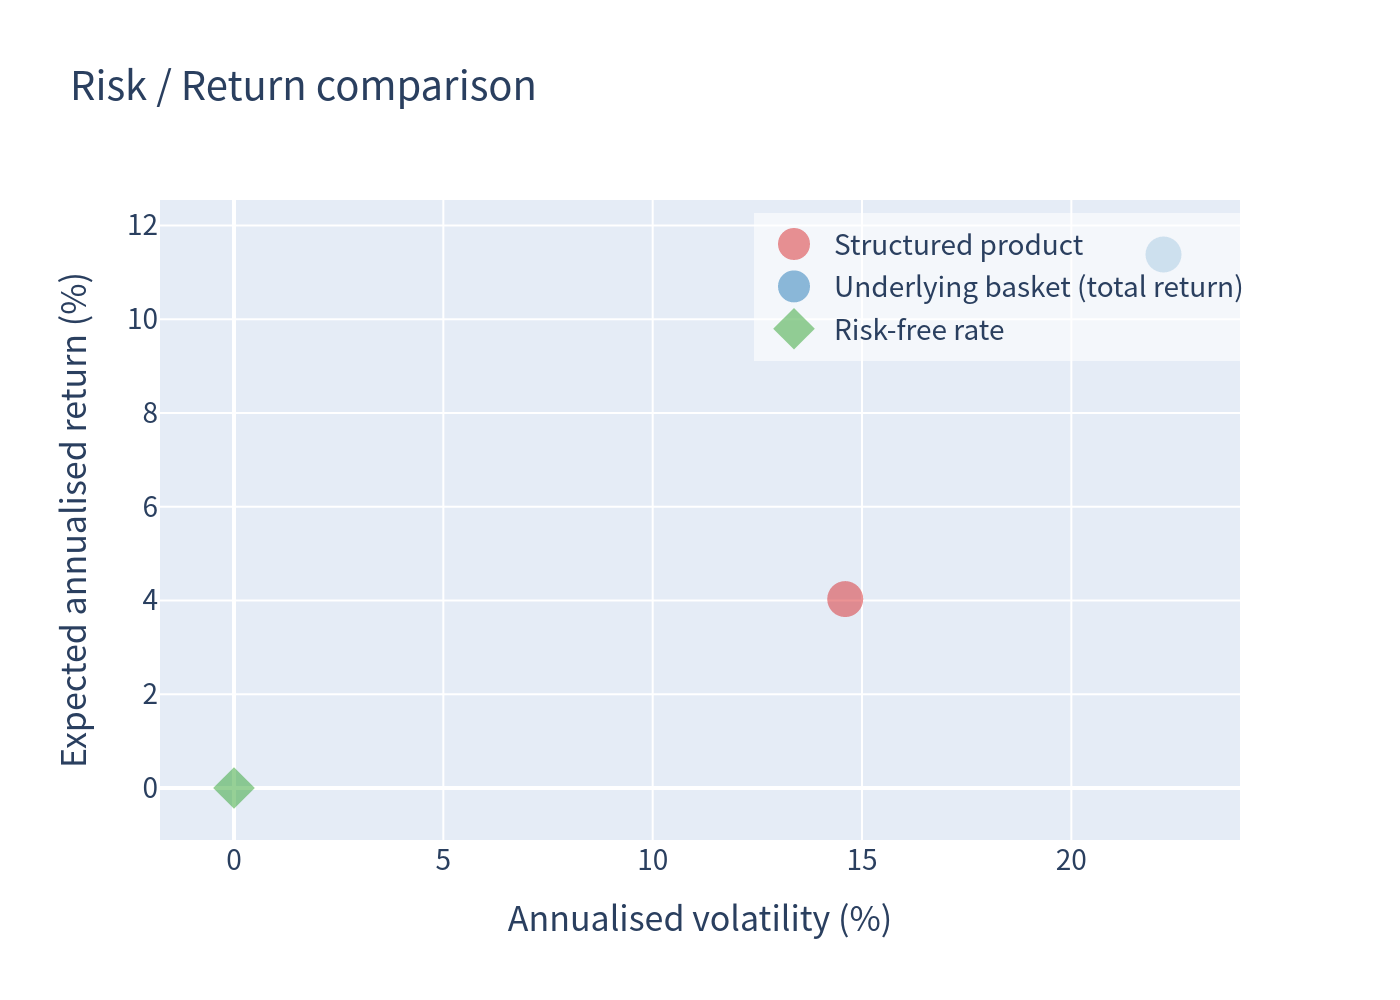
| Expected annualised return | +4.03% | +11.38% |
| Expected annualised volatility | 14.60% | 22.20% |
| Probability of loss | 21.96% | 34.65% |
| 99% confidence VaR (1 year) | -37.48% | -27.41% |
| Median annualised return | +11.44% | +8.15% |
The product cuts volatility by roughly a third versus simply holding the basket, but it also caps the upside and converts a chunk of the distribution into a fat left tail (worst simulated total return -61.21%, versus best possible +14.50%). Its 1-year 99% VaR (-37.48%) is worse than the underlying basket's (-27.41%) because once the barrier is breached, the investor is exposed to the worst of the three shares with no recovery above the barrier level.
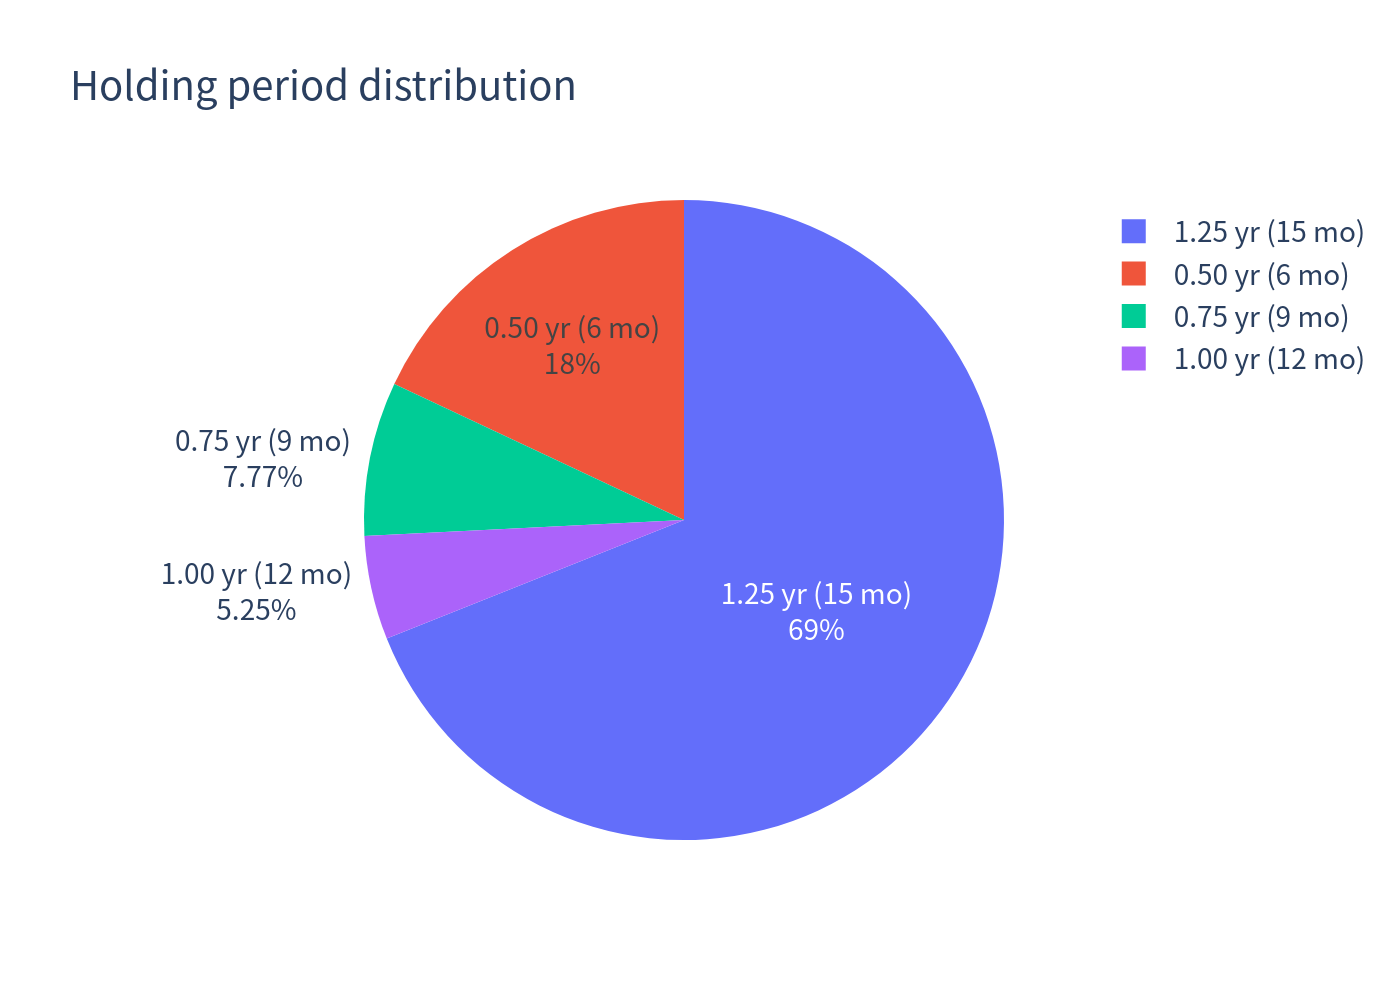
Empirically, the barrier is breached in ~23% of paths, the note is called early in ~31% of paths (18.0% at month 6, 7.8% at month 9, 5.3% at month 12), and ~69% of paths run to maturity.
Charts
Simulated outcomes — product vs underlying basket
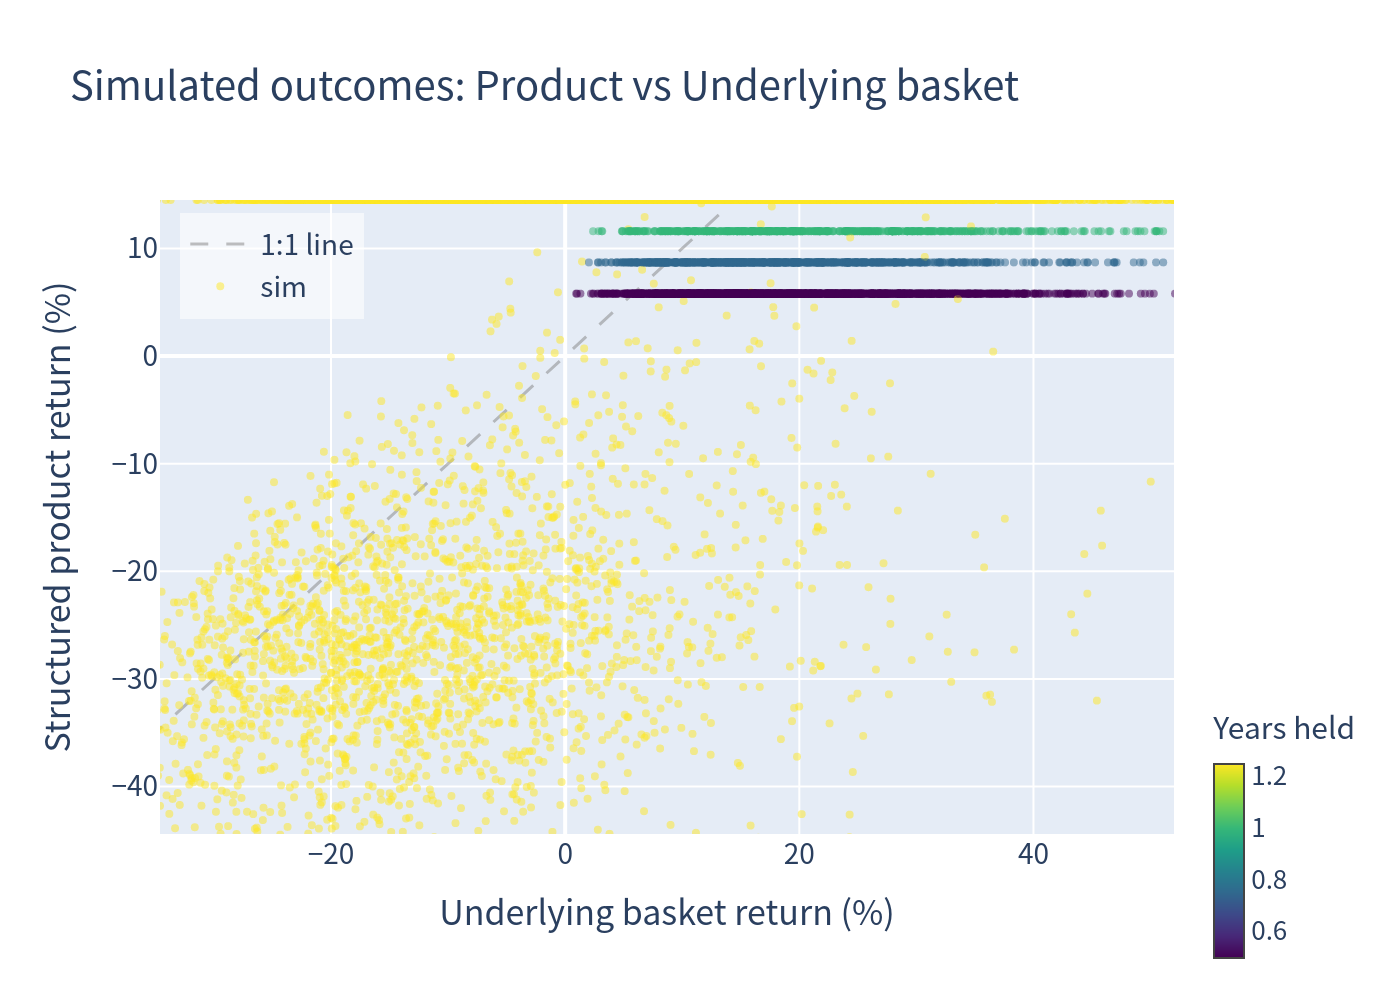
Points on the right of the dashed 1:1 line are cases where the product beats the basket; the horizontal band at +14.5% shows every “held-to-maturity, no-loss” scenario, where the payoff is capped regardless of how high the basket rose.
Distribution of annualised returns
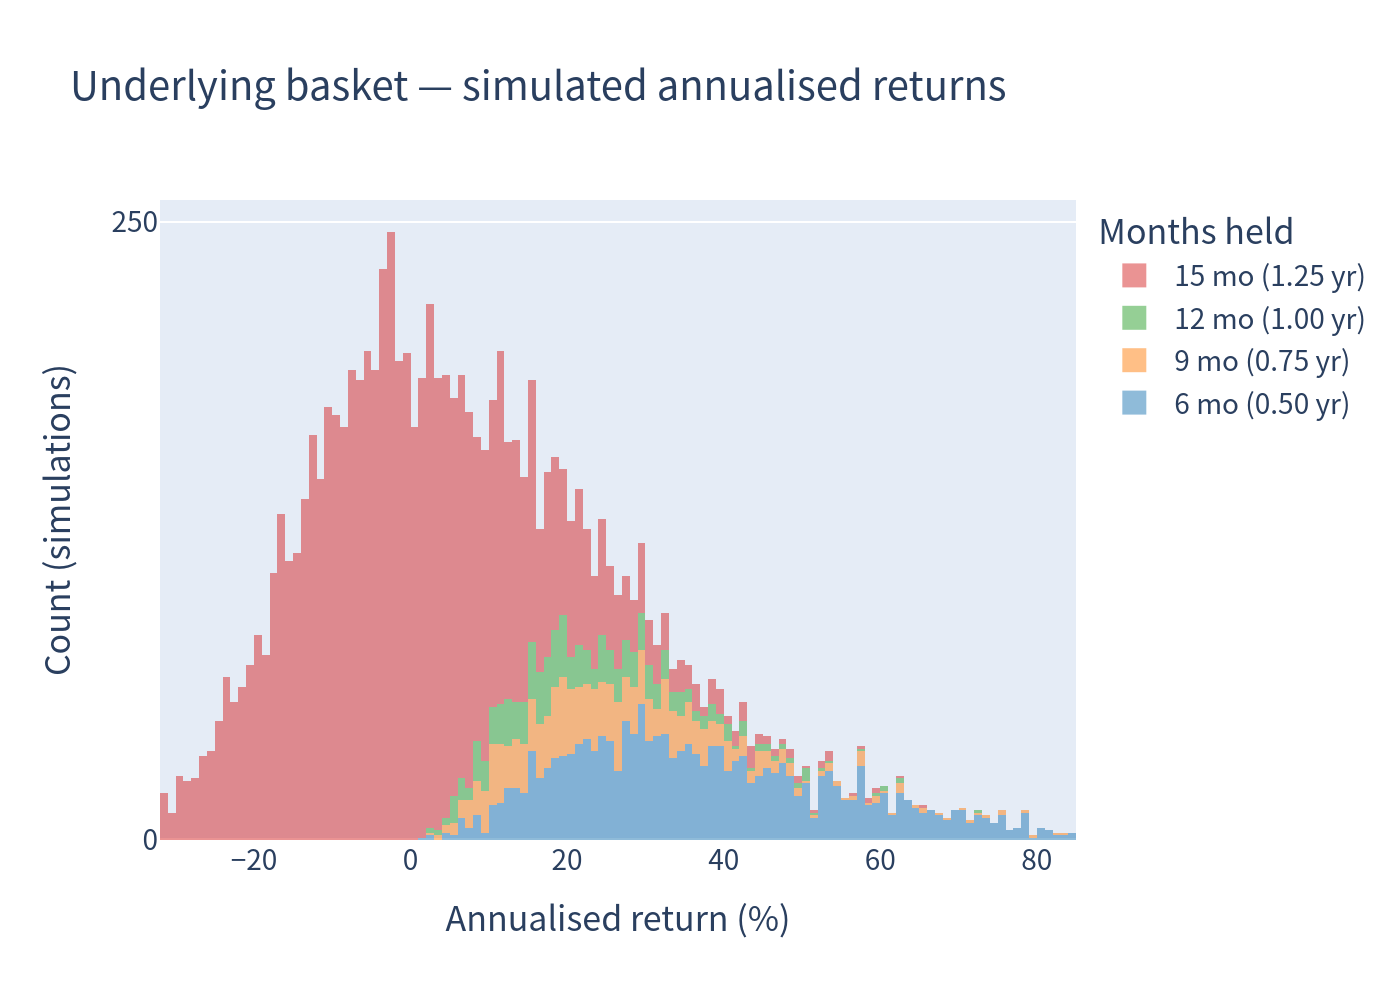
Underlying basket (top) vs structured product (bottom), coloured by holding period. The product's return is compressed into a coupon band near +11–12% with a discrete loss mass below 0.
Risk / return
The product sits at lower volatility but also a lower expected return than the basket (total return); the risk-free point is at ~0% with no volatility.
Holding-period and coupon outcomes
Scenario probabilities
~22% chance of a negative return; ~78% chance of delivering a coupon-like (annualised >10%) return and of beating the risk-free rate.
Investment commentary
What the note offers (pros)
- A high headline coupon (11.60% p.a.) in the current low CHF rate environment, paid quarterly and unconditionally.
- Conditional capital protection: as long as the 59% barrier is never touched, par is returned even if one share ends meaningfully below its start.
- Lower volatility than the underlying basket (14.6% vs 22.2%) thanks to the coupon cushion, which suits return-seeking investors who accept capped upside.
- Structured as a worst-of note, which is precisely why the coupon is generous — the barrier is easier to breach than a single-name or best-of structure.
What to watch (cons)
- Worst-of downside: after a barrier event the investor's capital tracks the weakest of three correlated Swiss names, which can be far below 59% at maturity.
- Continuous barrier (any intraday breach, not just quarter-ends) makes a knock-out more likely than a discrete observation would.
- Capped upside: the maximum is the coupon; a strong rally in Alcon, Bachem or Holcim is not captured.
- Issuer call: early redemption (which occurred in ~31% of paths) truncates the coupon stream, exactly when the shares are doing well.
- Credit exposure to the issuer/guarantor.
Interpretation note: because a sizable share of paths terminate early (6 months), annualised figures can look extreme for those paths; the expected total return over the realised holding period (+3.17%) should be read together with the expected holding period (12.75 months).
This material is a quantitative simulation study for information only and is not investment advice, a recommendation, or a suitability assessment.