
11.00% p.a. Multi Barrier Reverse Convertible (Worst-of) — Richemont · Logitech · Sonova
Headline Simulation Results
Based on 10,000 simulated 18-month market scenarios for the three underlyings:
| Metric | Result |
|---|---|
| Expected annualized return | 4.26% |
| Median annualized return | 10.72% |
| Probability of a negative return | 19.56% |
| 99% confidence 1-year VaR | −35.80% |
| Expected holding period | ≈ 14.0 months |
| Probability of early redemption (call) | 40.71% |
The product pays an attractive headline coupon, but the distribution of outcomes is bimodal: in roughly 8 out of 10 scenarios the investor earns about the coupon rate (~11% annualized), while in about 2 out of 10 the knock-in barrier is breached and the investor suffers a large loss. The low mean return (4.26%) versus the much higher median (10.72%) reflects that a minority of severe-loss scenarios drag the average down.
How It Works (in plain language)
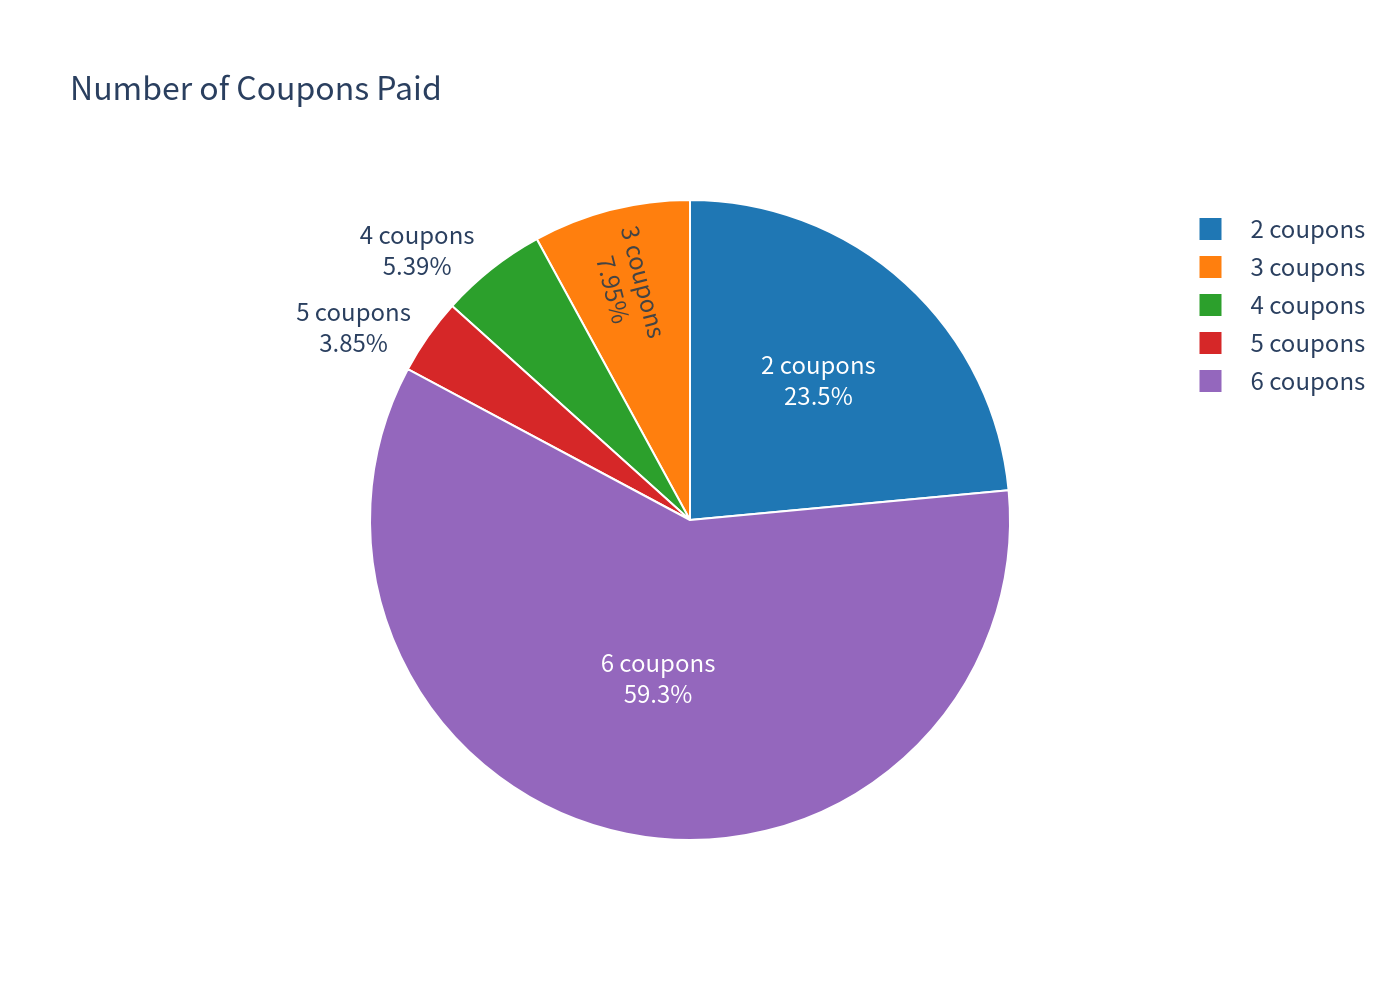
You invest CHF 1,000 (100% of notional). Over an 18-month term you collect 11.00% p.a. paid as six quarterly coupons of CHF 27.50 (2.75% each) — and the coupons are paid regardless of how the stocks perform.
- If none of Richemont, Logitech, or Sonova ever trades down to 55% of its starting level during the product's life, you receive your full CHF 1,000 back at maturity plus all coupons.
-
If any one of them does touch 55% (the "knock-in barrier"), downside protection is
lost. At maturity you then look at the worst-performing stock:
- if the worst stock finishes at or above its starting level, you still get CHF 1,000 back;
- if the worst stock finishes below its starting level, you receive that worst stock (or its cash value) — i.e., you absorb the worst performer's decline (a partial capital loss).
- The issuer may call the product early on quarterly dates. If called, you get CHF 1,000 back plus that period's coupon, and the product ends. In practice the issuer calls when the underlyings are performing (all at or above their starting levels), which caps how long you keep earning the high coupon.
Upside is capped at par plus the fixed coupons — you do not participate in any rally of the shares.
Key Statistics: Product vs. Underlying Basket
The benchmark is an equal-weight basket of the three stocks (total return, i.e. including dividends ≈ 1.78% on average).
| Instrument | Exp. Ann. Return | Exp. Ann. Volatility | Prob. of Loss | 99% VaR (1-yr) |
|---|---|---|---|---|
| Structured Product | 4.26% | 13.81% | 19.56% | −35.80% |
| Underlying (equal-weight basket, total return) | 14.56% | 27.28% | 33.77% | −31.46% |
Risk-free reference (1-year average CHF short rate): ≈ −0.05% (effectively zero).
- Over the realized holding period (≈14 months on average), the product's mean total return is +3.37%, versus +6.47% price return (≈+8.5% incl. dividends) for the equal-weight basket over the same horizons.
- The product offers lower volatility than the basket (13.81% vs 27.28%) and roughly half the loss probability, at the cost of a much lower expected return and a worse tail VaR.
Charts
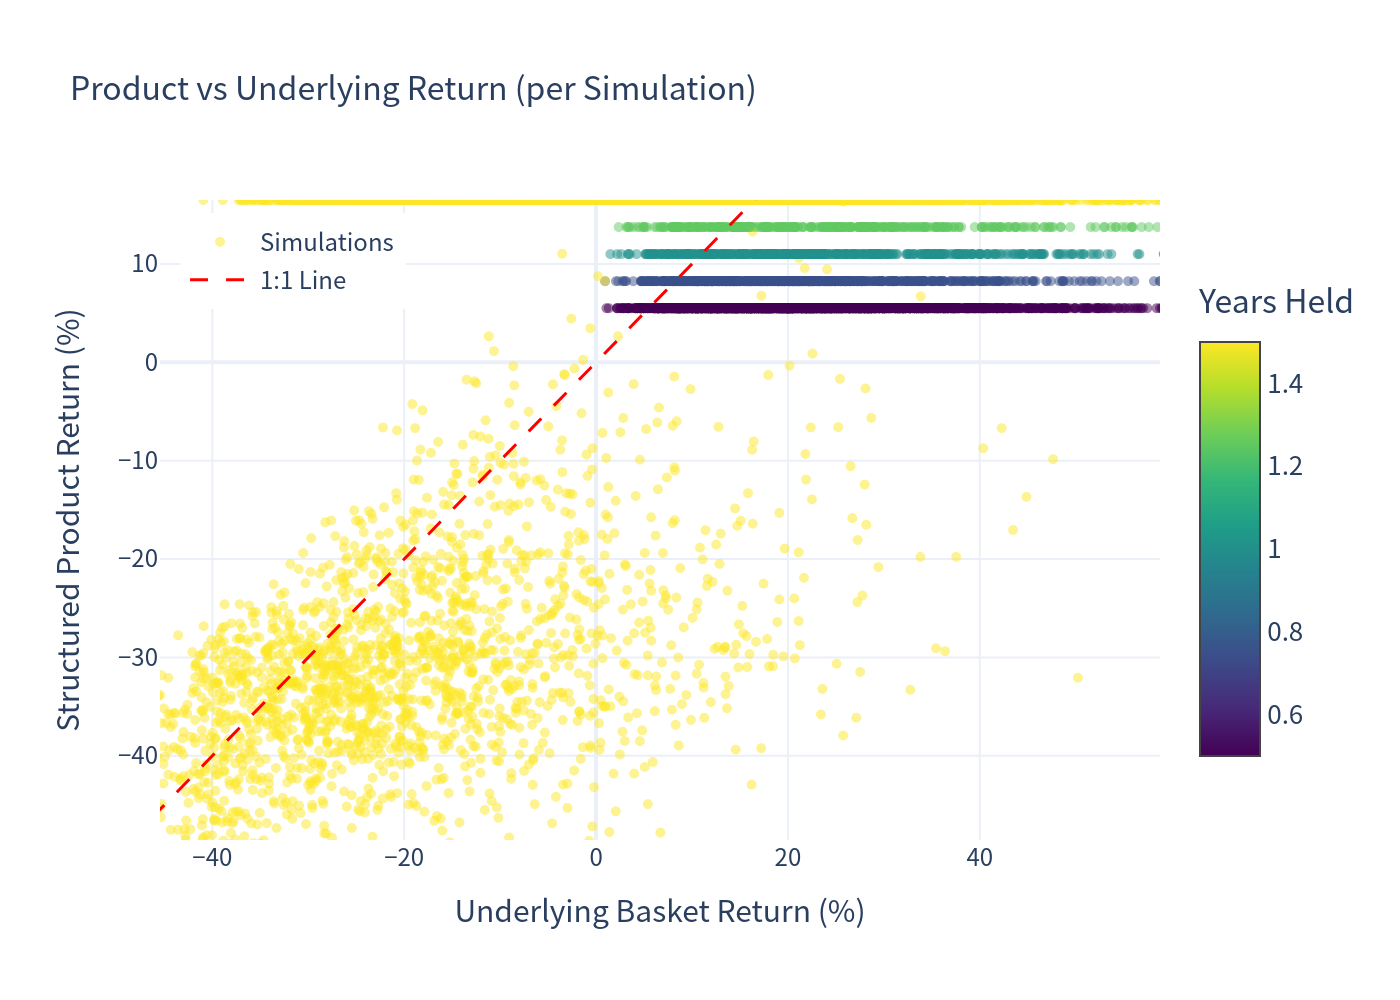
Product vs. Underlying Return (per simulation)
Points on the 1:1 line mean the product matched the basket. The dense cluster at the top shows the product's return capped near +11% even when the basket rallies, while in down markets the product's worst-of structure can underperform.
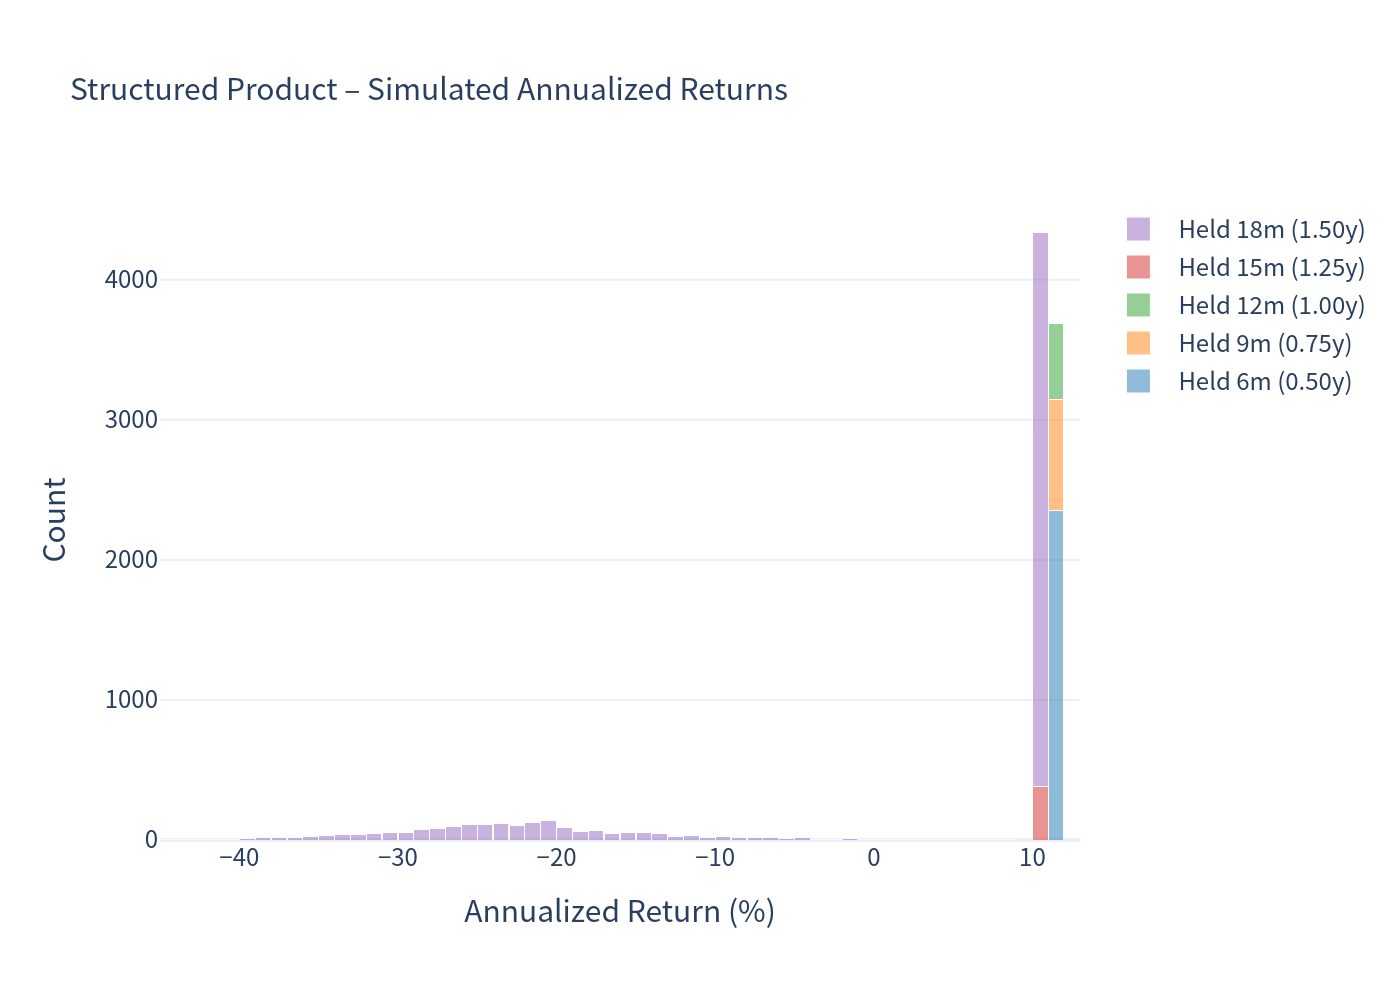
Structured Product — Annualized Return Distribution
A near point-mass around +10.7% to +11% (the coupon-driven outcome) with a separate loss tail down to roughly −49%. Bars are colored by holding period.
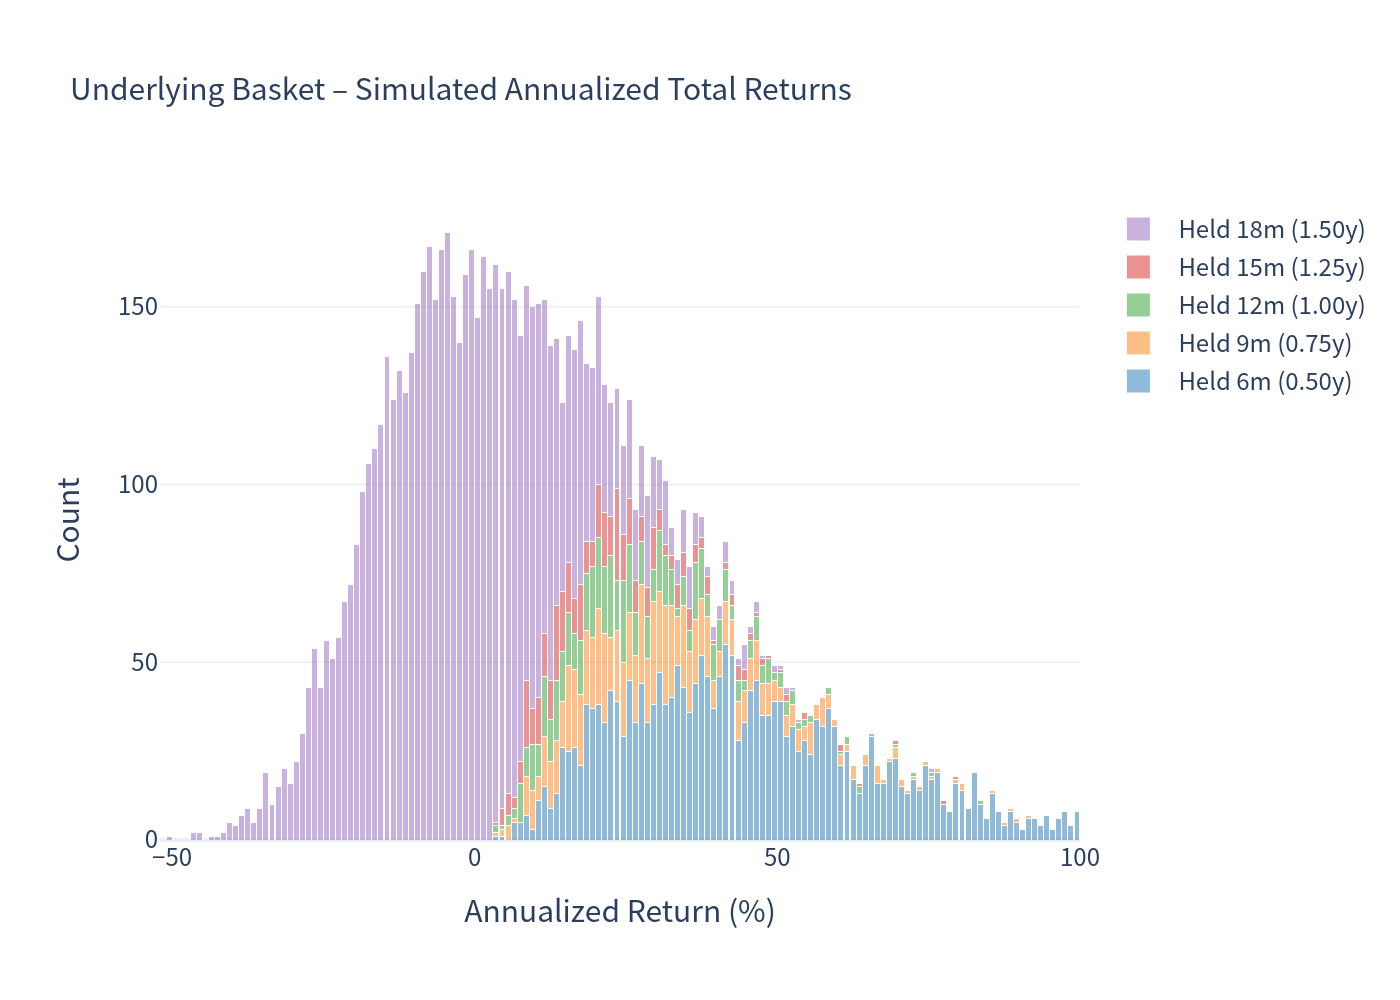
Underlying Basket — Annualized Total Return Distribution
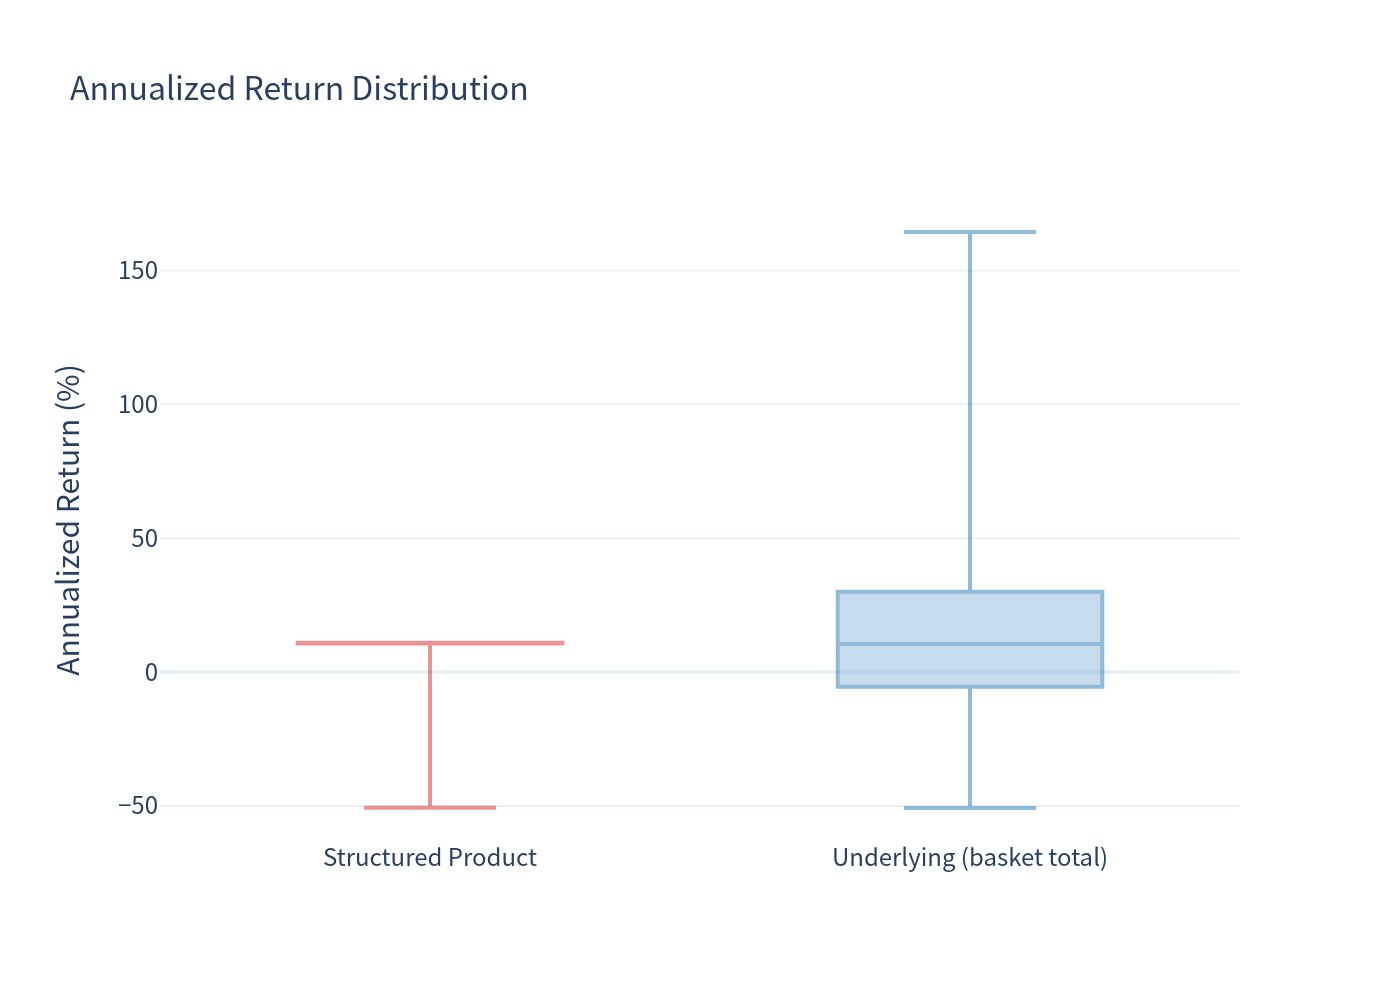
A wide distribution. Note: some very short early-call paths have linearly-annualized returns above +100% (max ≈ +164%); the x-axis is truncated at +100% for readability.
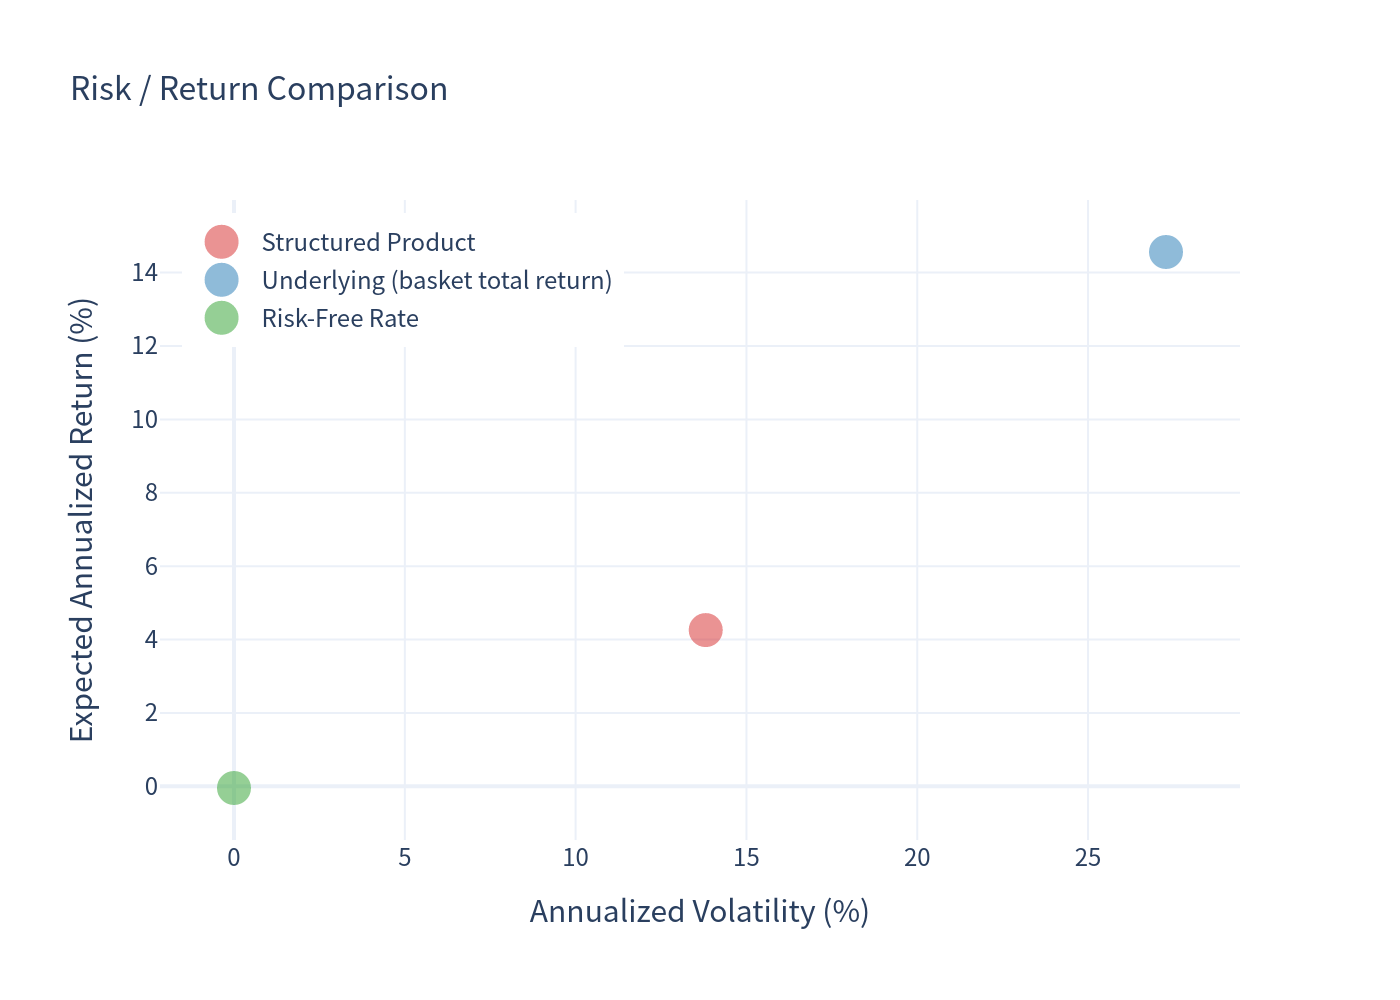
Risk / Return Comparison
The product sits well below the underlying's return for less risk, and only marginally above the (near-zero) risk-free rate in expectation.
Annualized Return Box Plot
Scenario Probabilities
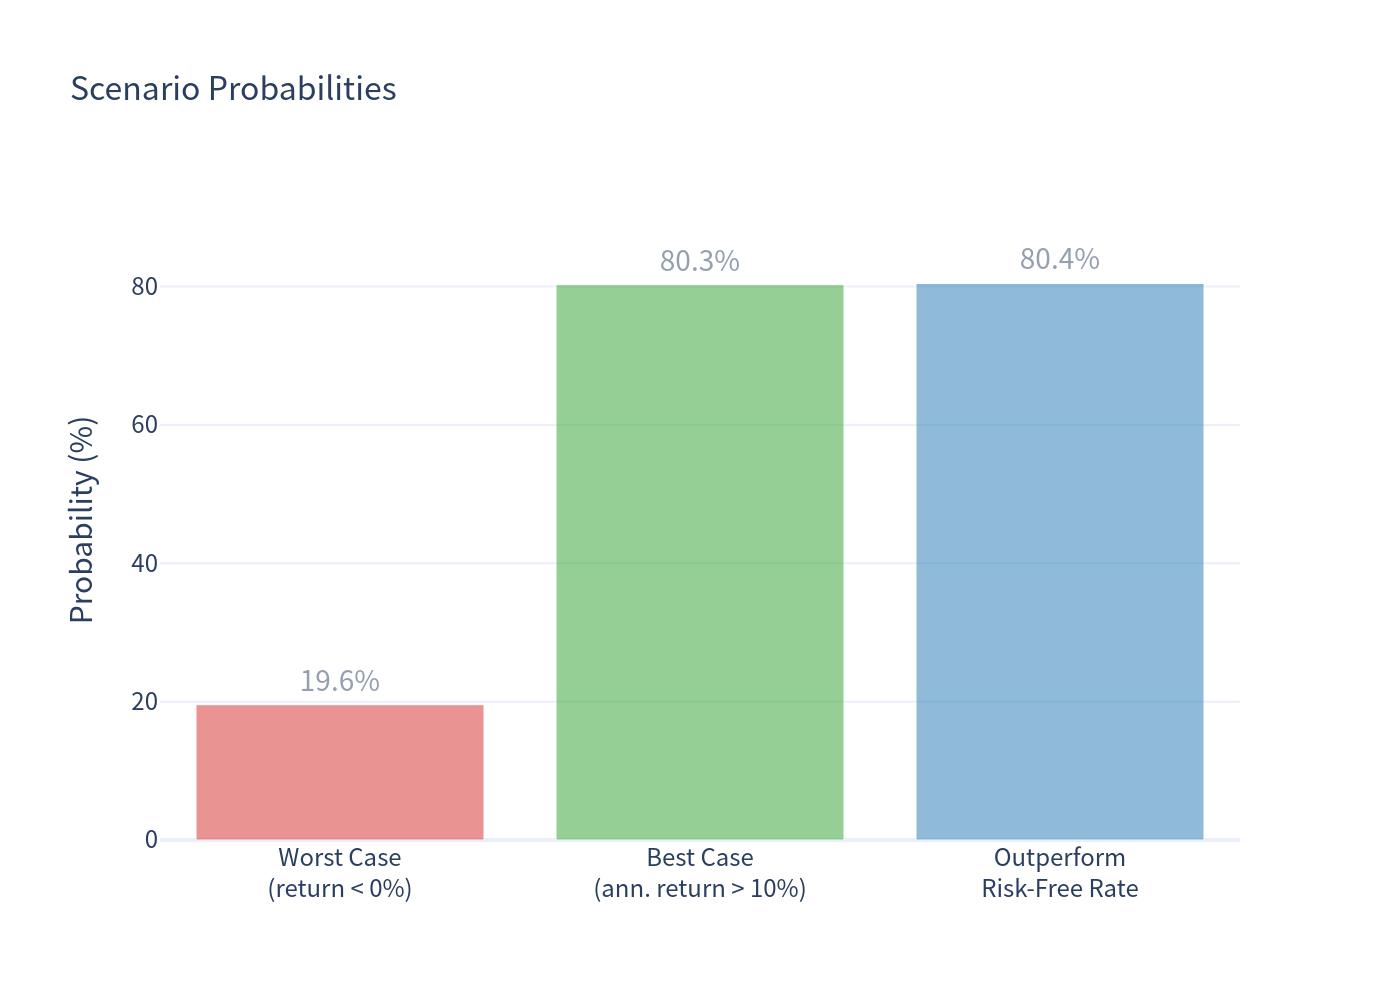
- Worst case (negative return): 19.56%
- Best case (annualized return > 10%, i.e. capturing the coupon): 80.27%
- Outperforming the risk-free rate: 80.44%
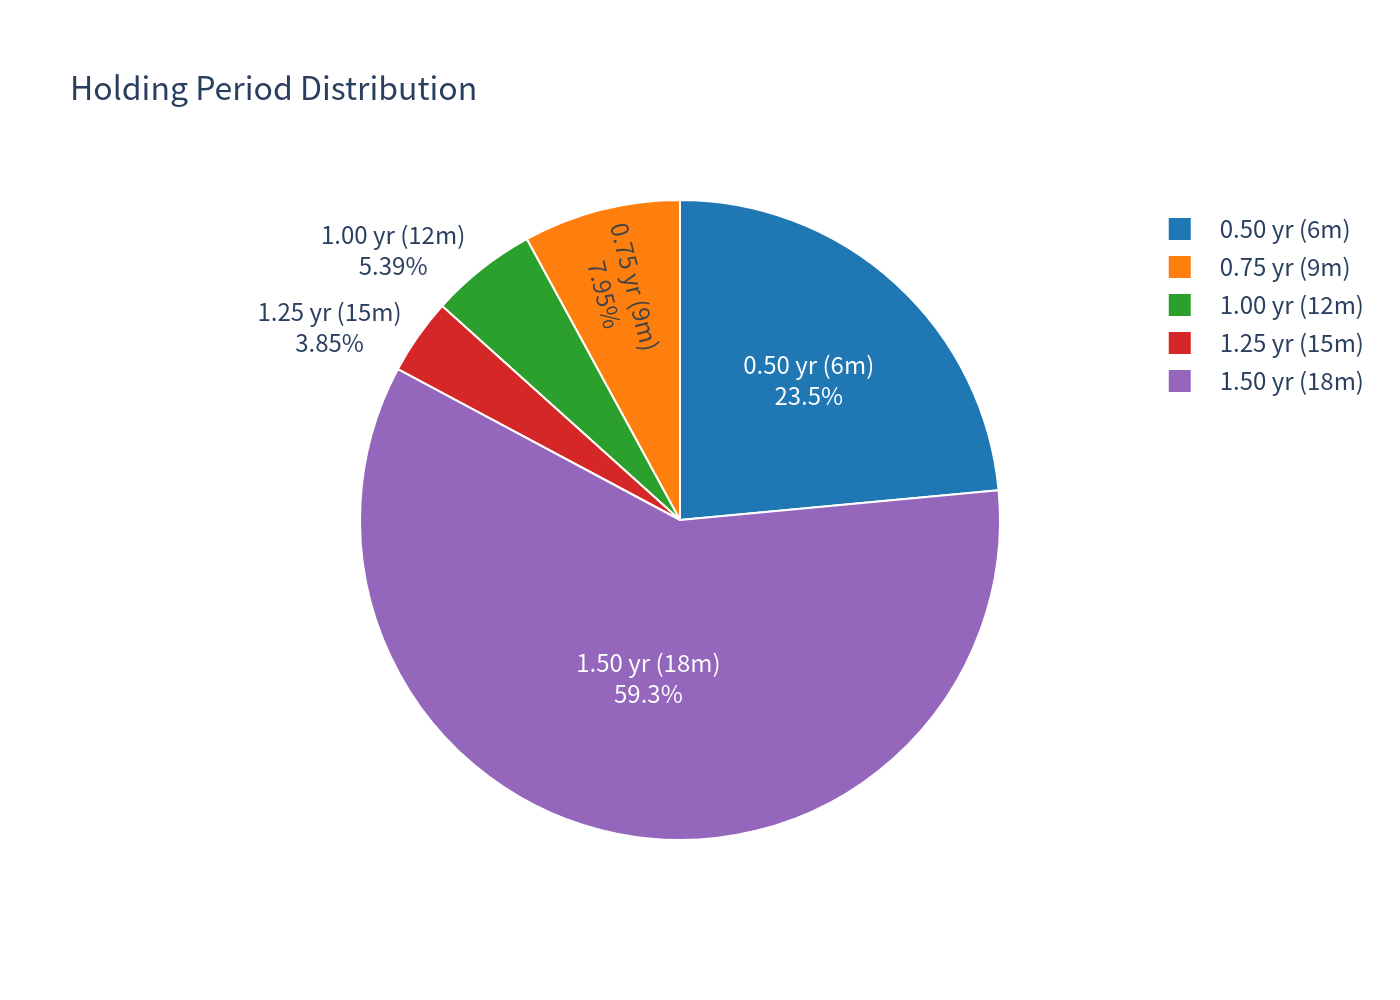
Holding Period & Coupon Outcomes
The product is called early in ~41% of scenarios (most frequently at month 6), otherwise it runs to the 18-month maturity.
Redemption Outcome Breakdown
| Outcome | Probability |
|---|---|
| Early redemption by issuer (par + coupons to date) | 40.71% |
| Held to maturity — no barrier hit (par + all coupons) | 39.51% |
| Held to maturity — barrier hit but worst ≥ start (par) | 0.04% |
| Held to maturity — barrier hit & worst < start (redemption below par) | 19.74% |
Investment Commentary
Favorable points
- A high 11.00% p.a. coupon in a market where CHF cash rates are ~0%, with coupons paid unconditionally on each date (absent an early call).
- A relatively deep 55% knock-in barrier, so the shares must fall more than 45% before protection is lost.
- Roughly 40% of scenarios return full par at maturity, and the typical (median) outcome is about +10.7% annualized.
- Short expected duration (~14 months) and lower volatility than holding the shares directly.
Points to weigh
- Worst-of exposure across three correlated Swiss stocks makes a bad outcome more likely than for a single name — the investor is tied to whichever stock performs worst.
- Upside is fully capped; the basket's simulated expected total return (~14.6% p.a.) is materially higher than the product's (~4.3% p.a.), and the product's expected return is only modestly above cash.
- Asymmetric downside: when the barrier is breached and the worst stock ends below its start, losses are severe (99% VaR −35.8%, worst case ≈ −49%) — larger in magnitude than the basket's own VaR.
- The issuer call feature tends to end the product early precisely when the shares are performing, truncating the high-coupon stream.
This analysis is for informational purposes only and does not constitute investment advice, a recommendation, or a suitability assessment.