
tokenengine.ai
Contact: Structured Product Evaluator
10.60% p.a. Multi Barrier Reverse Convertible on Givaudan, Kuros Biosciences & Novartis
ISIN CH1607593915 · CHF · Worst-of 3 Swiss equities · 55% continuous barrier · Issuer-callable · Max term ~18 months
6.29%
Expected annualized return
vs. 12.08% for the underlying basket
13.40%
Probability of a negative return
vs. 29.29% for the underlying basket
−32.48%
99% confidence VaR (1 year)
vs. −19.31% for the underlying basket
10.60%
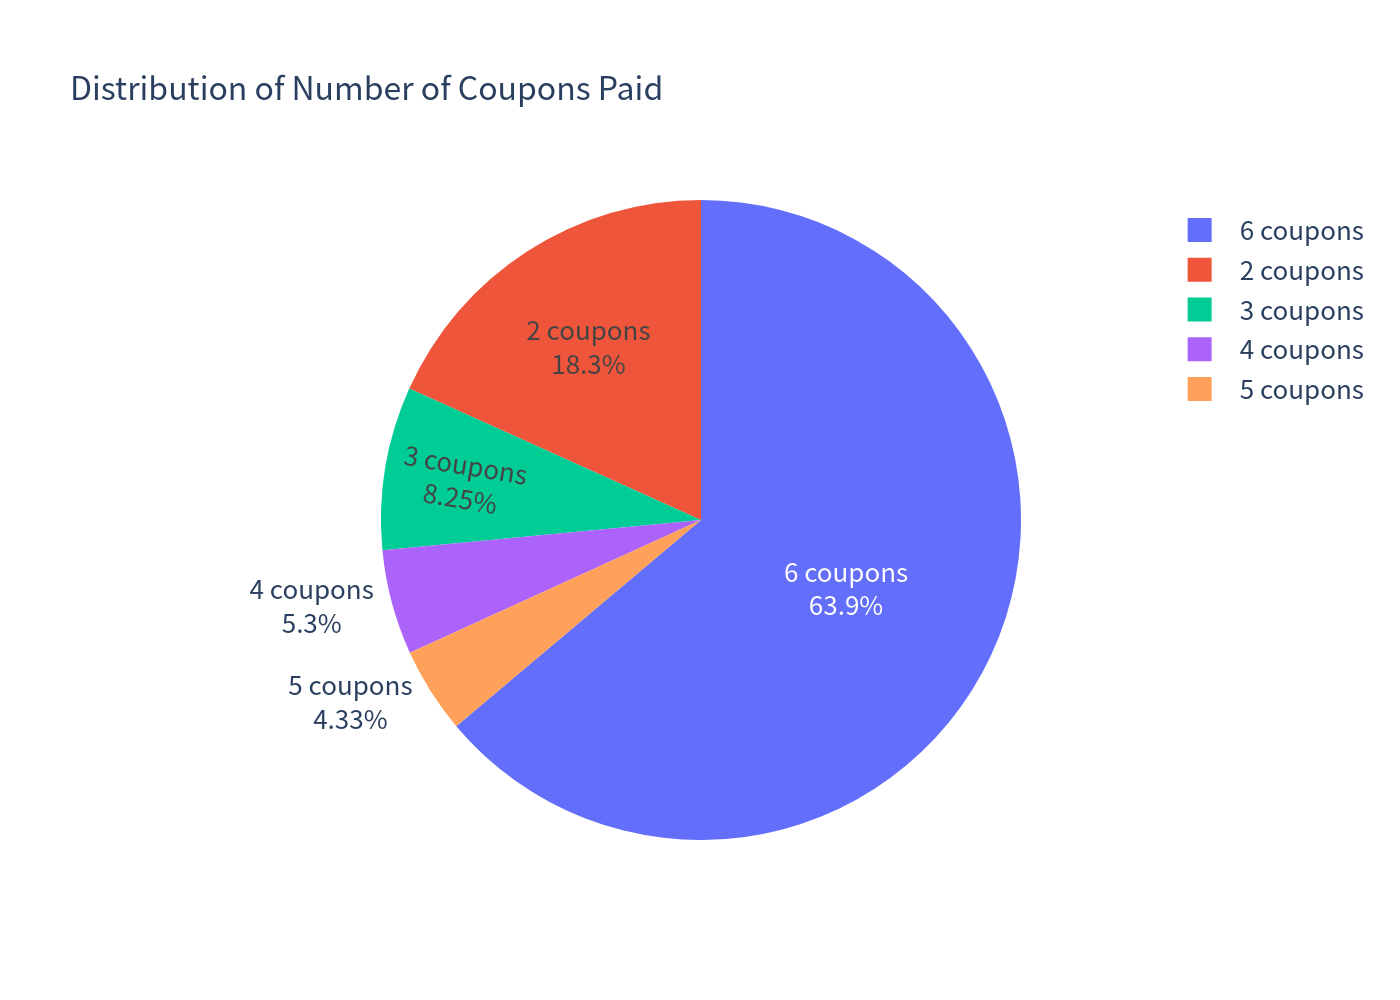
Headline coupon p.a. (paid quarterly)
~CHF 132.50 per CHF 5,000 note
86.61%
Chance of beating the risk-free rate
CHF cash rates are close to zero
14.6
Expected holding period (months)
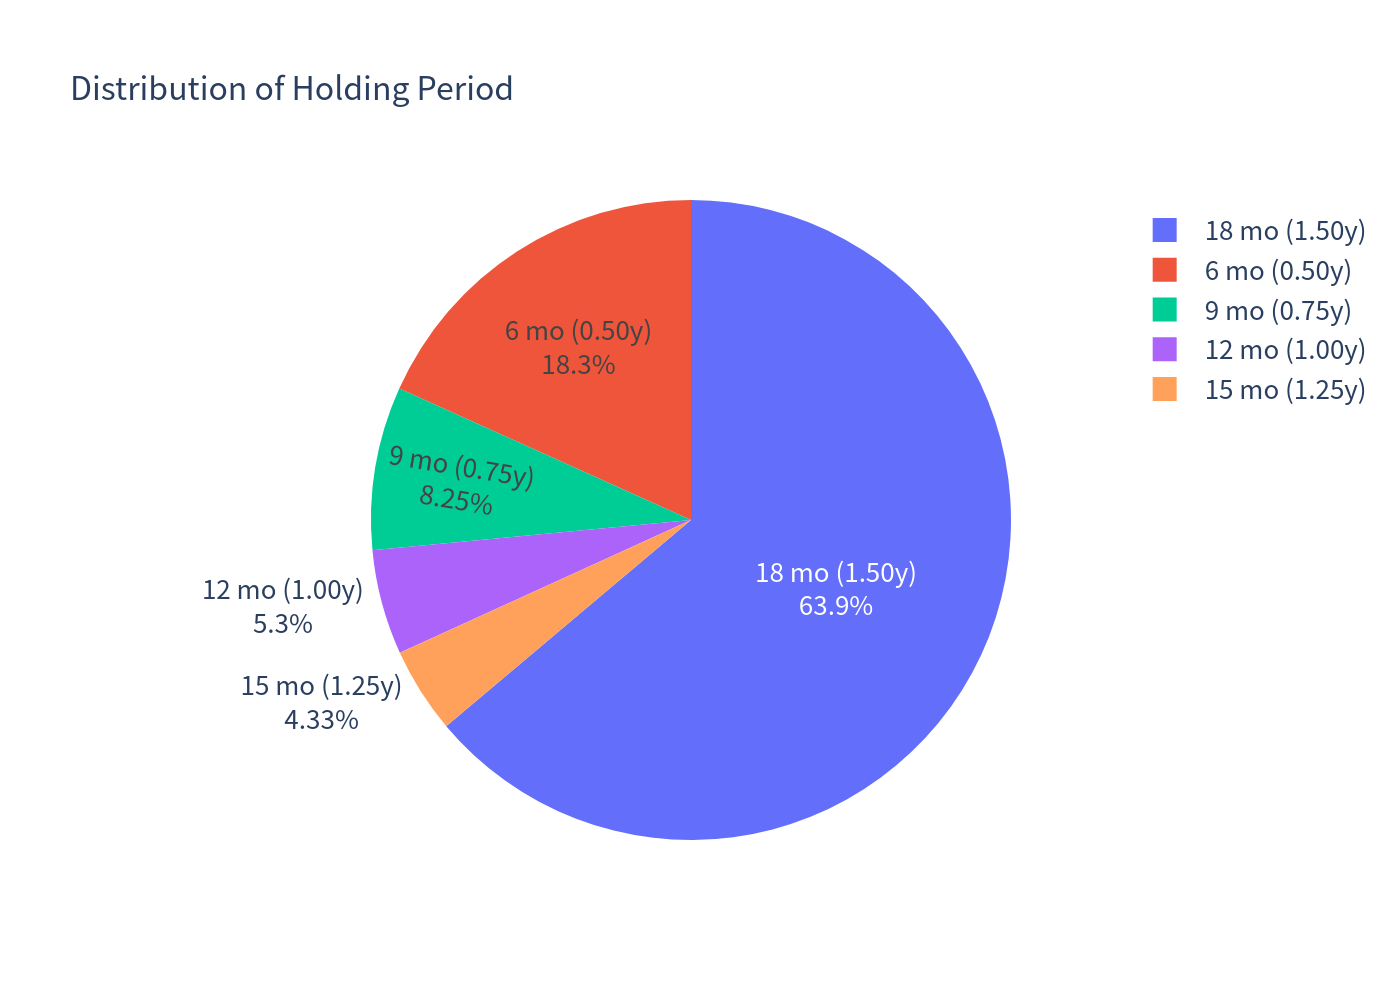
63.86% run to maturity · 36.14% called early
Headline Simulation Results
Based on a Monte-Carlo simulation of 10,000 paths over the product's life (worst-of basket of Givaudan, Kuros Biosciences and Novartis). The underlying comparison is the equal-weight basket total return (incl. dividends).
| Metric (annualized) | Structured Product | Underlying basket (total return) |
|---|---|---|
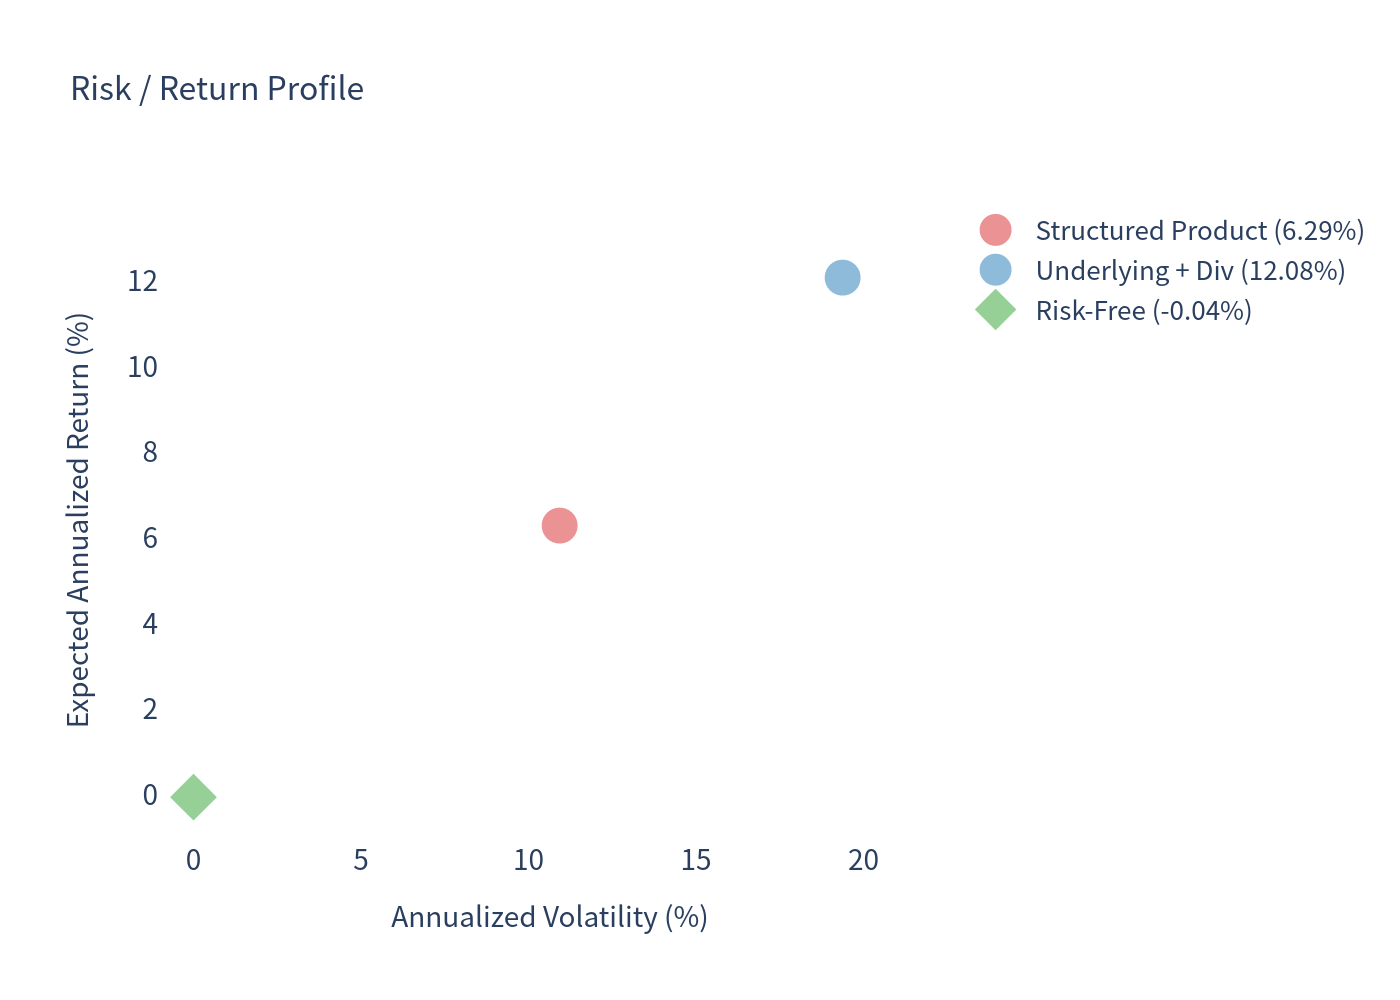
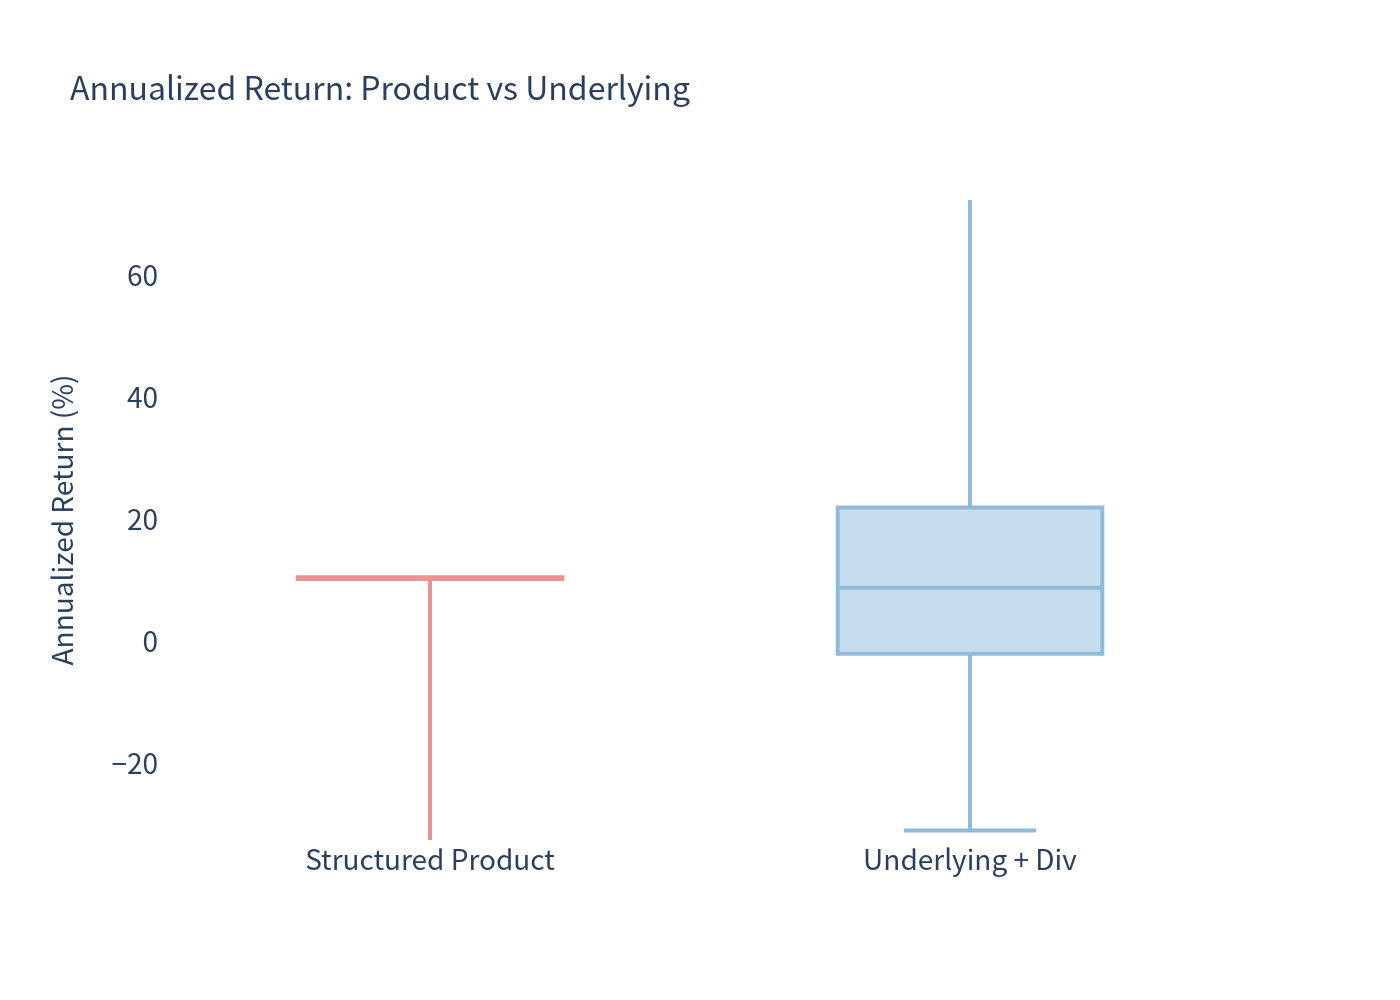
| Expected annualized return | 6.29% | 12.08% |
| Expected annualized volatility | 10.93% | 19.37% |
| Probability of a loss | 13.40% | 29.29% |
| 99% confidence VaR (1 year) | −32.48% | −19.31% |
| Median annualized return | 10.34% | 8.91% |
Takeaways
- Expected annualized return ≈ 6.29%, i.e. below the 10.60% headline coupon, because the coupon is only fully earned when the product is not called early and no capital is lost; in the loss scenarios the received coupons do not fully offset the principal shortfall.
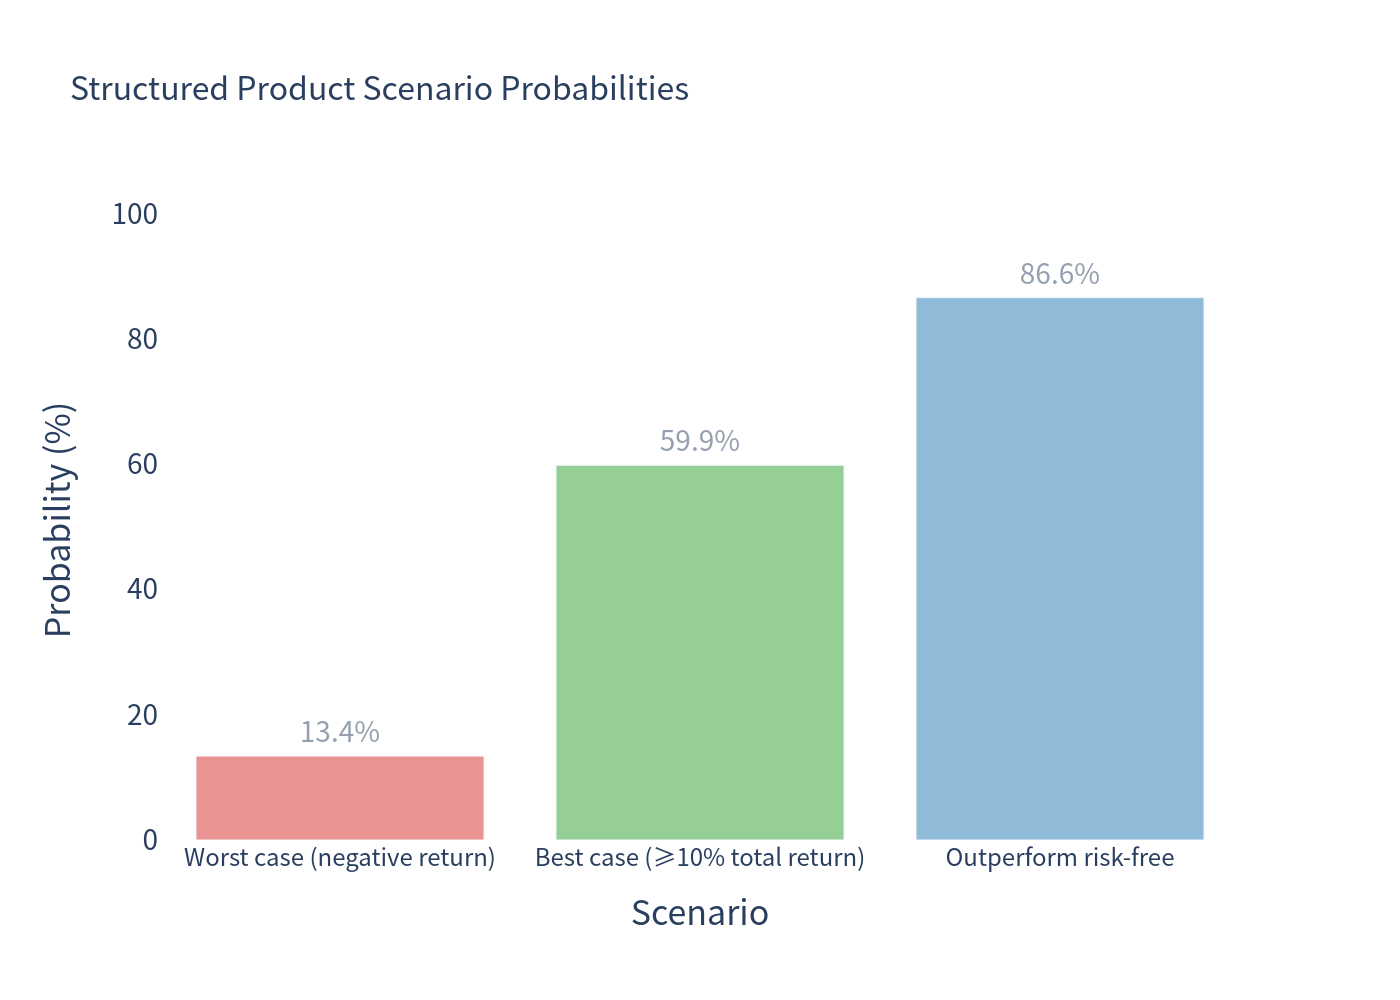
- Probability of a negative return ≈ 13.40% of simulations.
- 99% VaR (1-year) ≈ −32.48% — in the worst 1% of outcomes the annualized loss is about one-third of capital, reflecting the worst-of delivery feature.
- Chance of beating the risk-free rate ≈ 86.61%.
- Expected holding period ≈ 14.6 months (1.22 years); there is a 63.86% chance the note runs to full maturity and a 36.14% chance it is called early.
Product Overview — How It Works
This is a Barrier Reverse Convertible that pays a high fixed coupon (10.60% p.a., paid quarterly, ~CHF 132.50 per CHF 5,000 note) in exchange for taking downside risk on three Swiss stocks: Givaudan, Kuros Biosciences and Novartis. The payoff is driven by the worst performer of the three.
- If no barrier event occurs — none of the three shares ever trades at or below 55% of its starting level at any time during the ~18-month life — the investor receives par (100%) back at maturity plus all coupons. → Best case.
- If the 55% barrier is breached and the worst share finishes at or above its starting level, the investor still receives par.
- If the 55% barrier is breached and the worst share finishes below its starting level, the investor receives the actual worst-performing shares (or the cash equivalent), i.e. suffers the full decline of that single worst stock. → This is where capital is lost.
- Issuer call: on any quarterly observation date the issuer may redeem early at par plus the coupon. Modelling assumption: the term sheet gives the issuer discretion (no explicit trigger level), so we model the call as occurring when the worst share is at/above its starting level — the economically rational call point.
In plain terms: you collect an attractive quarterly income, you are protected as long as no share falls by 45% at any point, but if a share does break 55% and does not recover to its starting level, you wear the full downside of whichever share fell the most.
Key Statistics — Product vs. Underlying
| Product | Underlying basket (total return, incl. dividends) | |
|---|---|---|
| Expected annualized return | 6.29% | 12.08% |
| Expected annualized volatility | 10.93% | 19.37% |
| Probability of loss | 13.40% | 29.29% |
| 99% VaR (1 year) | −32.48% | −19.31% |
- Expected total return over the realized holding period ≈ 6.91% (average holding ≈ 14.6 months).
- Expected annualized return ≈ 6.29% (mean of per-simulation annualized returns).
- Because a sizeable share of paths end early (36% called), some simulations have short holding periods; for holdings under 12 months returns are annualized linearly, so individual annualized figures can look extreme. The figures above should be read together with the ~14.6-month average holding period and the 6.91% average total return.
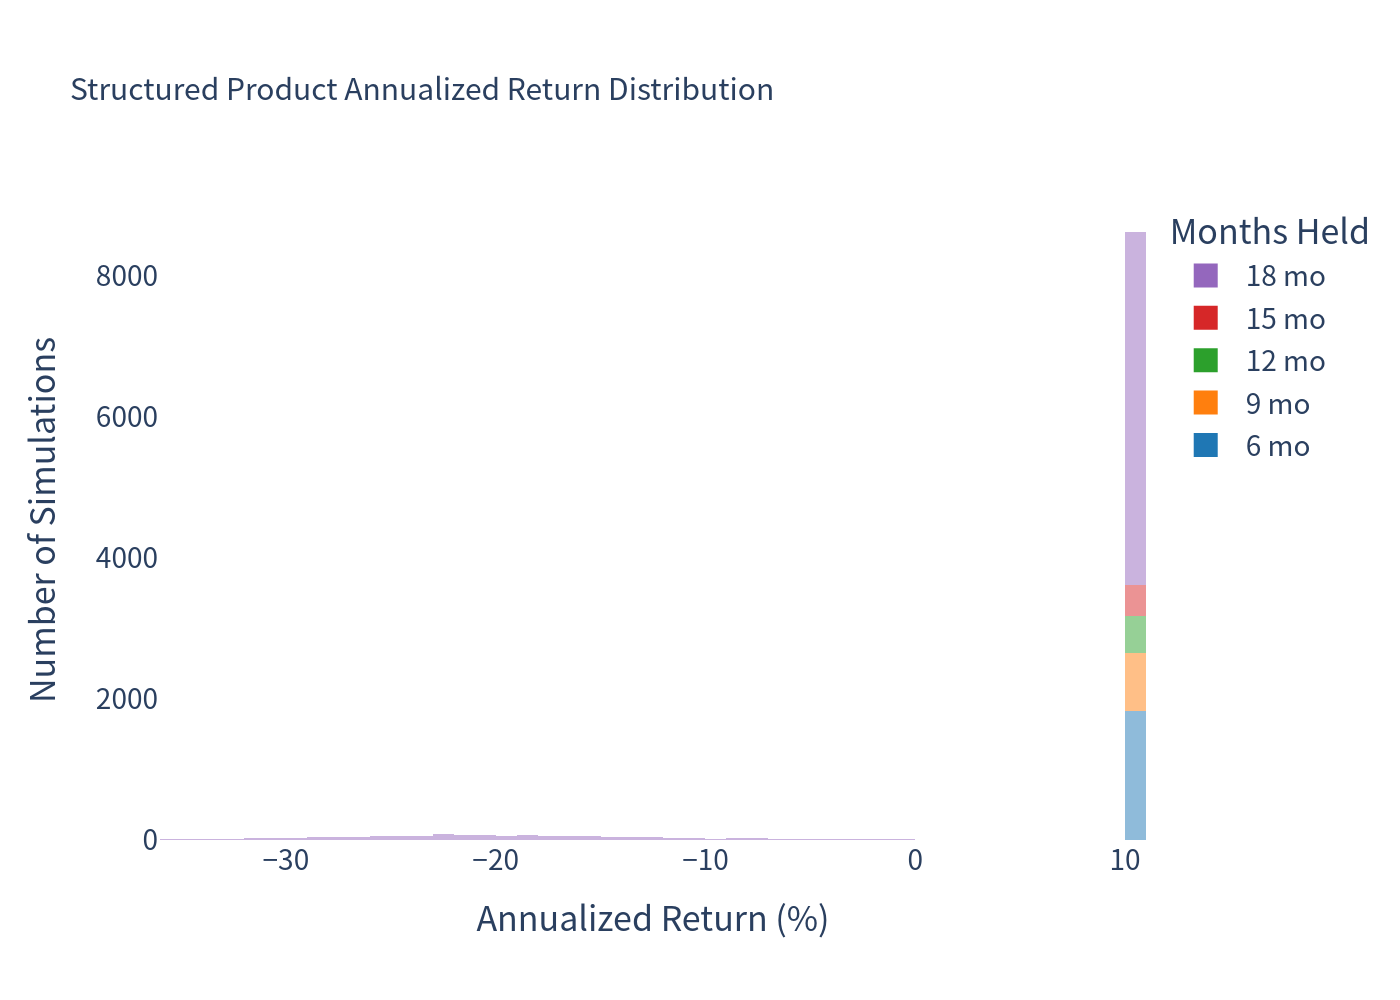
- The mean (6.29%) is well below the median (10.34%): the typical outcome is a full coupon-like return, but a heavy left tail (capped upside, full worst-of downside) pulls the average down.
Charts
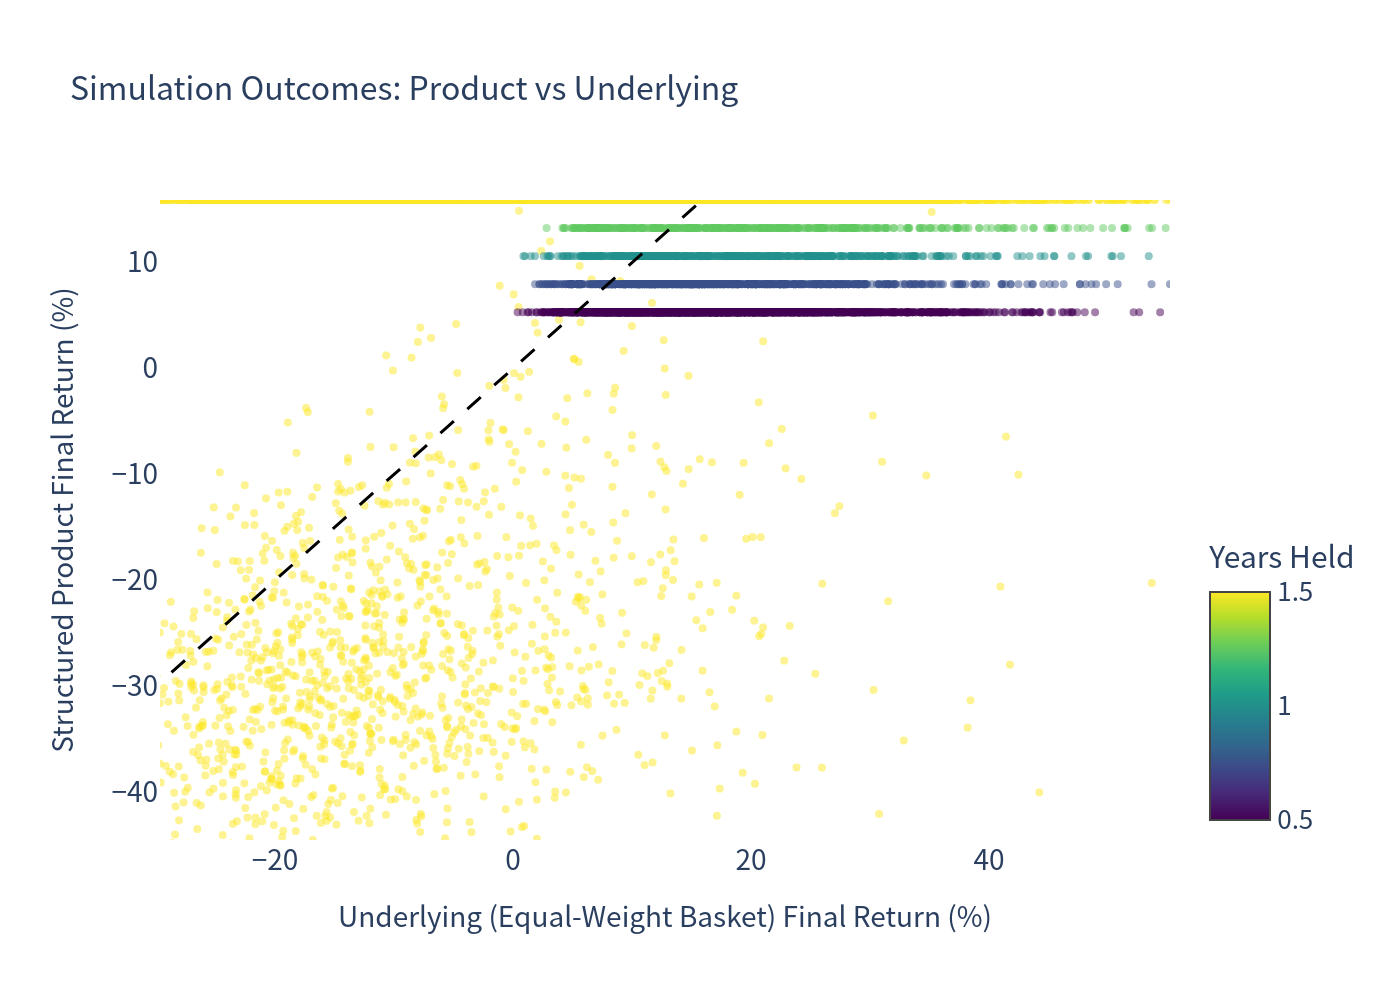
Simulation outcomes — product vs. underlying
Colour = years held.
Risk / return profile
Distribution of the structured product's annualized return
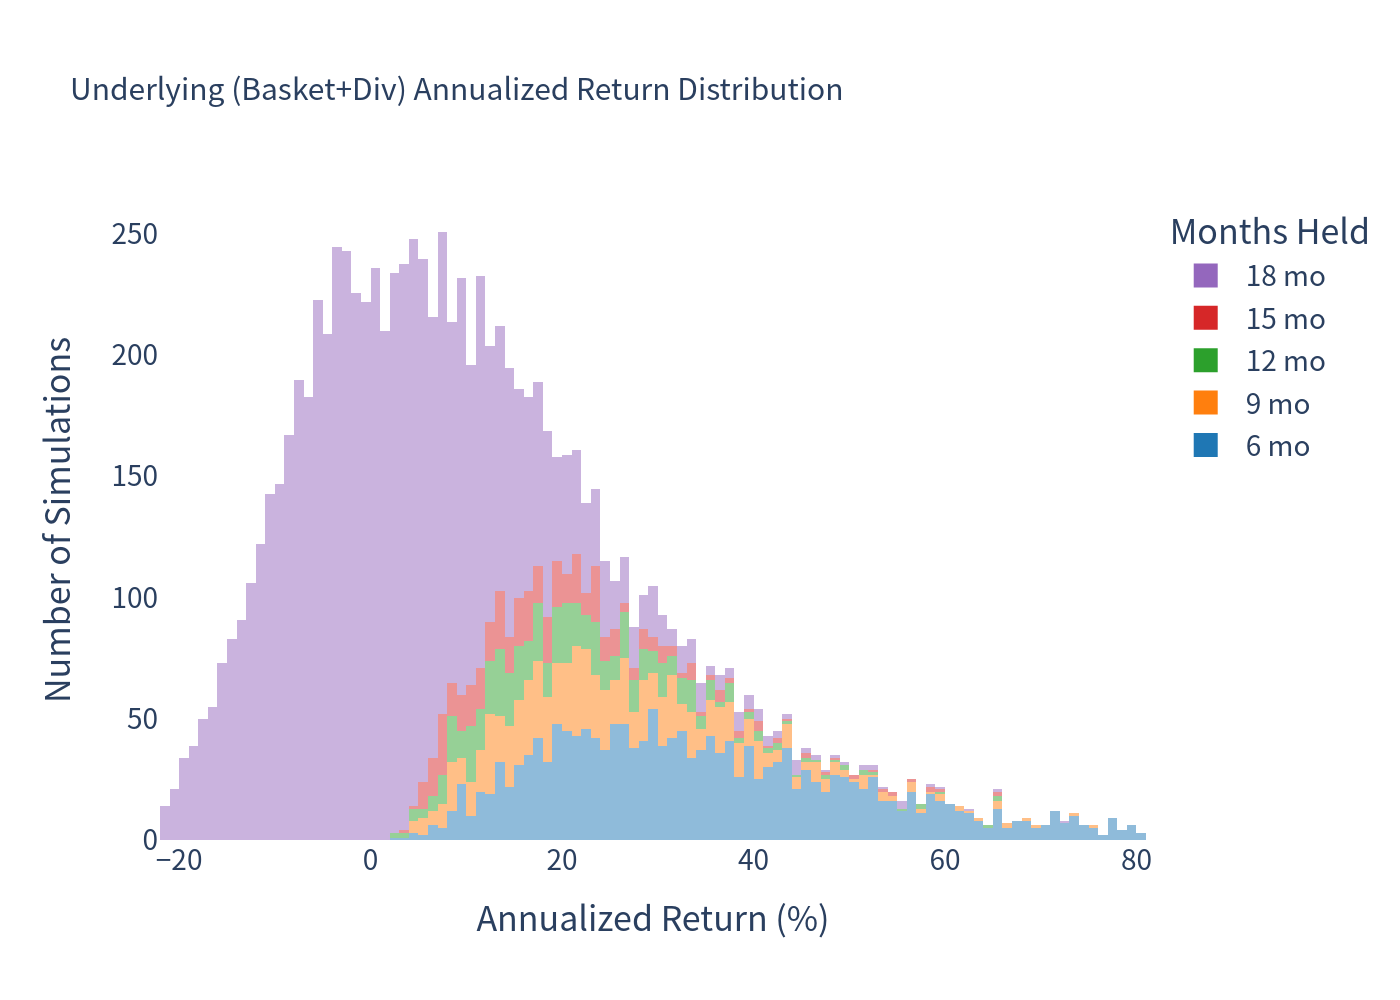
Stacked by holding period.
Distribution of the underlying basket's annualized total return
Scenario probabilities
Annualized return comparison
Box plot comparison.
How long the product is held
How many coupons are paid
Investment Commentary
Potential advantages
- High fixed coupon (10.60% p.a.) paid quarterly regardless of how the underlyings perform, as long as the note is alive.
- Meaningfully lower loss probability than the underlying basket (≈13.4% vs ≈29.3%): the 55% barrier plus the "par even after a breach if the worst share recovers" rule protects the majority of paths; ~86.6% of simulations beat the near-zero CHF risk-free rate.
- Downside cushion frequency: in ~63.9% of paths the note runs to maturity and in ~36.1% it is called early — in both cases the investor typically keeps a full coupon stream or par redemption.
- Positive carry in a low/zero-rate CHF environment, with the coupon far above cash rates.
Points to be aware of
- Upside is capped: the investor can never earn more than par plus the fixed coupons; all upside of the shares above their starting levels is forgone.
- The worst-of structure concentrates tail risk: the 99% VaR (−32.48%) is worse than that of the equal-weight basket (−19.31%). A single name — here the small-cap biotech Kuros Biosciences, by far the most volatile of the three (~65% realized annualized volatility) — dominates the loss outcomes because the investor is delivered the whole worst performer, not an average.
- Barrier is observed continuously for ~18 months, so an intraday/intra-period dip below 55% (even if it later recovers) removes the "par" protection; the coupon does not rise to compensate for a breach.
- Issuer call risk: the note is likely to be called early (≈36% of paths, generally when the shares are strong), capping the duration of the attractive coupon precisely when markets perform well.
- Credit risk of the issuer (Leonteq) applies to all payments.
This analysis is a quantitative evaluation of the product mechanics for information purposes only and does not constitute investment advice or a suitability assessment.