
tokenengine.ai
Structured Product Evaluator
8.20% p.a. Multi Barrier Reverse Convertible on Nestlé, Novartis & Roche (CHF)
ISIN CH1607597072 · SIX Symbol AIIETQ · Callable · Final Fixing 27/10/2028
Headline Simulation Results
| Metric | Result |
|---|---|
| Expected annualized return | +4.85% |
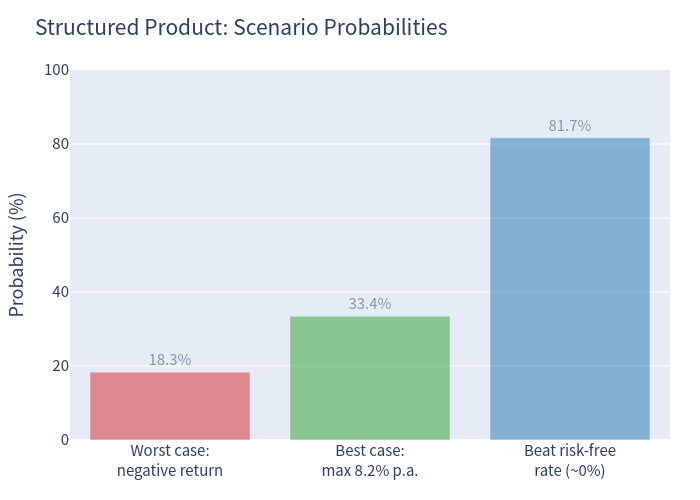
| Probability of a negative return | 18.34% |
| 99% confidence VaR (1 year) | −17.55% |
| Expected total return over holding period | +6.58% |
| Expected holding period | 18.81 months (≈1.57 years) |
Over 10,000 simulations the note delivers a positive result in roughly four out of five paths, with an average annualized outcome of about 4.85%. The figure sits below the 8.20% headline coupon because gains are capped at par plus coupons, while the minority of paths (about 18%) that breach the 69% barrier absorb the full decline of the worst-performing stock — capped upside cannot offset those barrier-driven losses. In the worst 1% of scenarios the annualized return is −17.55% or lower.
Product at a Glance
| Field | Detail |
|---|---|
| Issuer / Guarantor | Leonteq Securities AG (Guarantor: PostFinance Ltd) |
| Currency / Denomination | CHF / CHF 1,000 |
| Coupon | 8.20% p.a. paid quarterly (CHF 20.50 per CHF 1,000) |
| Underlyings | Nestlé (NESN), Novartis (NOVN), Roche (ROP) — worst-of |
| Barrier | 69% of initial, continuous observation |
| Strike | 100% of initial |
| Early redemption | Issuer callable, quarterly from year 1 |
| Maturity | 27/10/2028 |
| Upside | Capped (maximum capital redemption = par) |
How It Works (in plain language)
- You are paid to wait. The note pays a fixed 8.20% per year in quarterly instalments (eight coupons of CHF 20.50 each per CHF 1,000), regardless of how the three stocks perform.
- The protection is conditional. As long as none of Nestlé, Novartis or Roche ever trades at or below 69% of its starting level (monitored continuously over the two-year life), you get your full CHF 1,000 back at maturity. A single brief dip by just one of the three stocks is enough to switch this protection off.
- If the barrier is breached, you keep all coupons; at maturity you receive par (CHF 1,000) only if the worst-performing stock finishes at or above its starting level. If it finishes below, you effectively take that worst stock's decline (physical delivery of shares worth the worst performer's performance).
- The bank can end it early. On any quarterly observation date from the first year, the issuer may call the note, returning your CHF 1,000 plus that period's coupon. There is no upside participation: if the stocks soar, you still only receive par plus coupons.
Key Statistics — Product vs Underlying
| Metric | Structured Product | Underlying (equal-weight basket, total return) |
|---|---|---|
| Expected annualized return | 4.85% | 10.38% |
| Expected annualized volatility | 6.89% | 12.78% |
| Probability of loss | 18.34% | 22.03% |
| 99% VaR (1 year, annualized) | −17.55% | −15.28% |
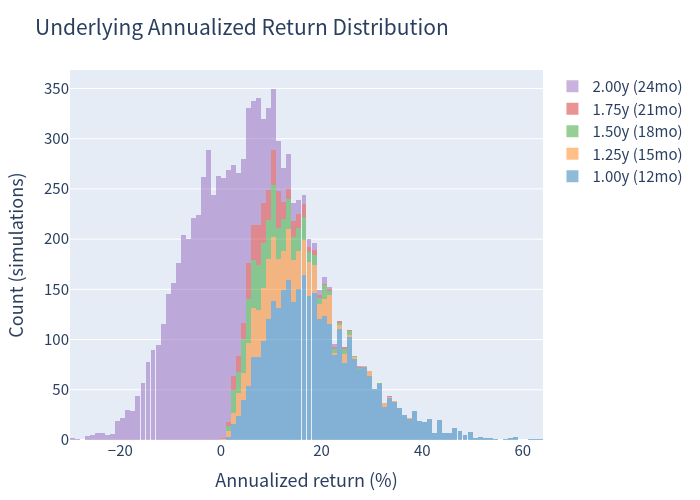
The three constituents are high-quality Swiss defensive names (Nestlé 3.67% dividend yield, Novartis 2.87%, Roche 2.50%; ≈3.01% equal-weight basket yield). Over the simulated horizon the equal-weight basket returned ≈10.38% p.a. including dividends. The note trades most of that upside for a much smoother ride — but note that its deep-tail risk (99% VaR −17.55%) is actually slightly worse than the diversified basket, reflecting the worst-of structure.
Simulation Outcomes
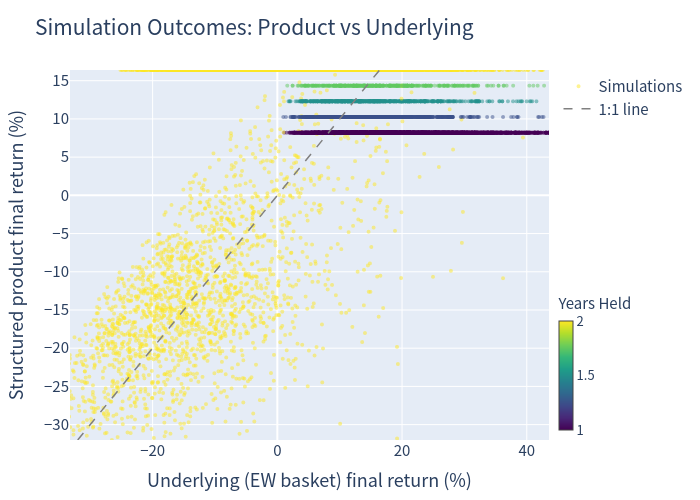
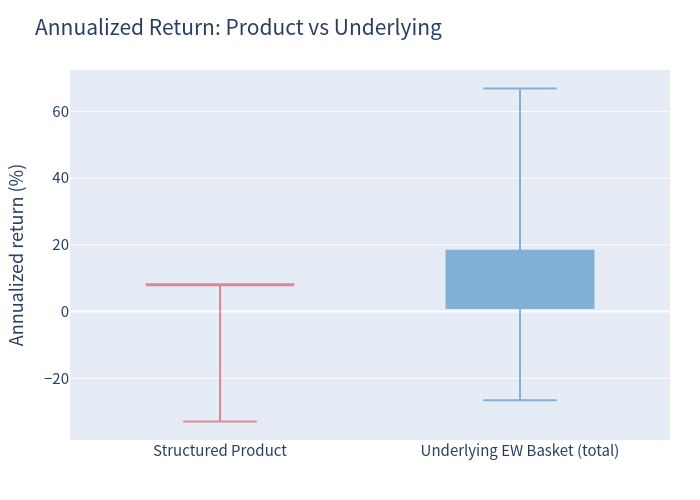
The scatter below plots each path's product return against the underlying basket return over the same holding period; the dashed line is the 1:1 reference. The product's returns are capped (you can see the flat ceiling near +16%) while the downside tracks the basket once the barrier is breached.
Simulation outcomes
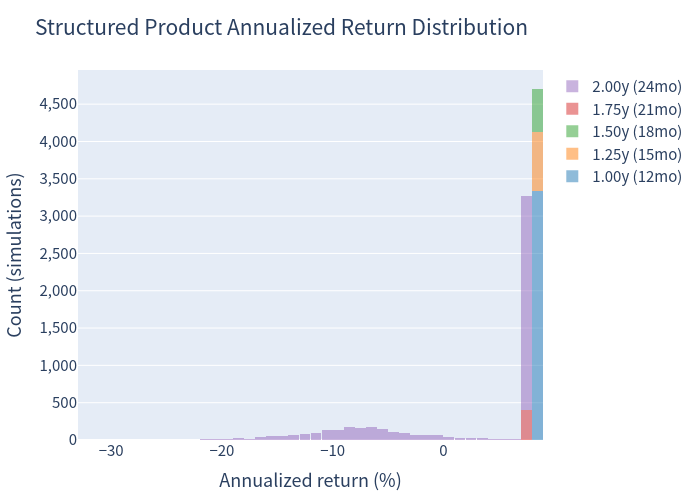
Structured product annualized return distribution
Underlying annualized return distribution
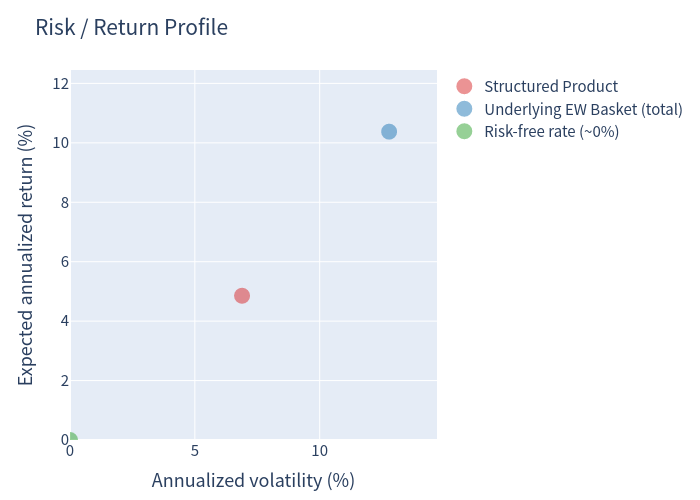
Risk / return profile
Box plot comparison
Scenario probabilities
Holding Period and Coupon Outcomes
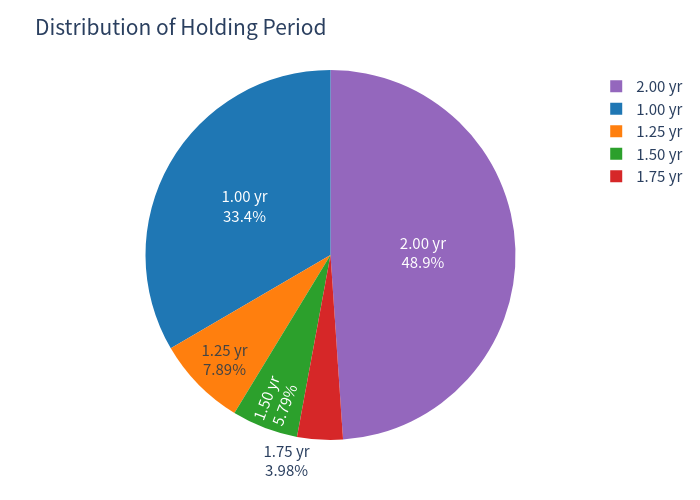
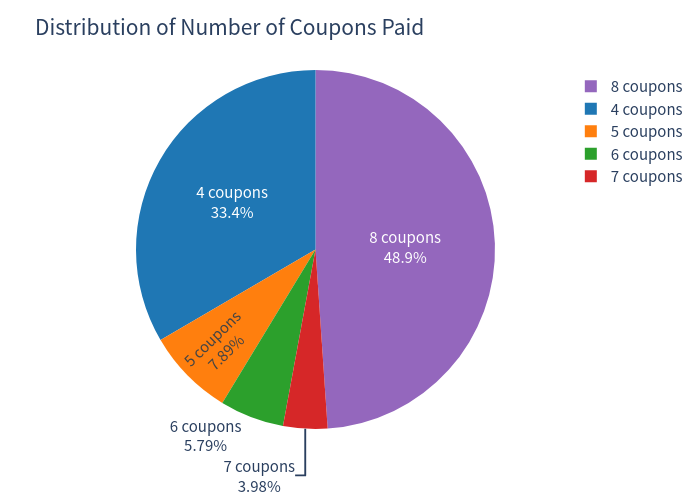
The issuer call is the single biggest driver of the outcome distribution: roughly 51% of paths are called early (most at the first observation date, month 12), while 48.92% run to maturity. (Modelling note: the issuer is assumed to exercise its call on the first quarterly observation date at which the worst-performing stock is at or above its starting level.) Consequently the most frequent holding period is 1.0 year and the most common coupon count is 4 or 8.
Holding period distribution
Coupon count distribution
Investment Commentary
Strengths
- Attractive headline income: an 8.20% p.a. coupon — far above cash (Swiss CHF money-market rates are ≈0%) — paid quarterly, with about an 81.66% chance of beating the risk-free rate.
- Conditional capital protection: if the 69% barrier is never touched, par is returned regardless of where the stocks end. In this simulation the barrier was breached in only ≈21% of paths.
- Lower volatility and lower loss frequency: 6.89% volatility and an 18.34% loss probability versus 12.78% / 22.03% for holding the basket directly — the note smooths the typical outcome.
- Best case is reliable income: the maximum annualized return (8.20% p.a., achieved in ≈33% of paths by an early call at the first observation) is a solid, repeatable outcome.
Considerations
- Capped upside: capital redemption never exceeds par, so strong equity rallies are not captured; the maximum annualized return is only 8.20%.
- Worst-of risk cuts both ways: a single weak stock can switch off protection and drive the payout. This is why the note's 1%-tail VaR (−17.55%) is worse than the diversified basket's (−15.28%) despite its much lower volatility — returns are negatively skewed.
- Continuous barrier and callability: the barrier is monitored continuously (not just at month-ends), raising the probability of a breach, while the issuer's call truncates the paths that perform best.