
Structured Product Analysis Report
10.75% p.a. CHF Autocall Barrier Reverse Convertible
Linked to worst of Bayer AG, EMS-CHEMIE Holding AG, and Lonza Group AG
This analysis evaluates a 10.75% p.a. CHF Autocall Barrier Reverse Convertible issued by UBS AG. The product offers regular coupon payments with potential early redemption (autocall) and downside protection subject to a barrier (kick-in) feature.
Key Simulation Results (10,000 Monte Carlo simulations)
| Metric | Structured Product | Underlying Basket |
|---|---|---|
| Expected Annualized Return | 13.05% | 21.89% |
| Annualized Volatility | 11.67% | 16.74% |
| Probability of Loss | 17.80% | 9.26% |
| 99% VaR (1-year) | -21.45% | -12.80% |
| Expected Holding Period | 13.8 months | 18 months |
| Early Redemption Probability | 43.90% | N/A |
| Principal Loss Probability | 21.72% | N/A |
- Product Type: Autocallable Barrier Reverse Convertible with worst-of basket
- Underlyings: Bayer AG (German), EMS-CHEMIE Holding AG (Swiss), Lonza Group AG (Swiss)
- Currency: CHF (Quanto – no foreign exchange risk)
- Coupon: 10.75% per annum, paid semi-annually
- Autocall Feature: Early redemption if all underlyings are at or above initial levels on observation dates (approximately months 5.8, 8.9, 12.0, 14.9)
- Barrier (Kick‑In): Continuous monitoring at 60% of initial level for each underlying
- Maturity Payoff:
- If no barrier breach: 100% principal repayment
- If barrier breached but all underlyings ≥ 100% at maturity: 100% principal repayment
- If barrier breached and any underlying < 100% at maturity: repayment equal to worst performer
Based on 10,000 Monte Carlo simulations, the structured product exhibits the following payoff distribution:
| Outcome Category | Probability | Description |
|---|---|---|
| Early Redemption with Profit | 43.9% | Product called early, investor receives principal plus accrued coupons |
| Maturity with Full Principal | 78.3% | Product reaches maturity with no barrier breach or barrier breached but all underlyings ≥ 100% |
| Maturity with Principal Loss | 21.7% | Barrier breached and at least one underlying < 100% at maturity |
| Total Negative Return | 17.8% | Overall loss after accounting for coupons |
Average Payoffs:
- Average total return: 15.36% (annualized: 13.05%)
- Average coupon income: 24.65 index points (on 100 notional)
- Average holding period: 13.8 months
Return Distribution
The structured product shows a skewed return profile with a high probability of positive returns but a tail risk of principal loss when the barrier is breached and at least one underlying finishes below its initial level.
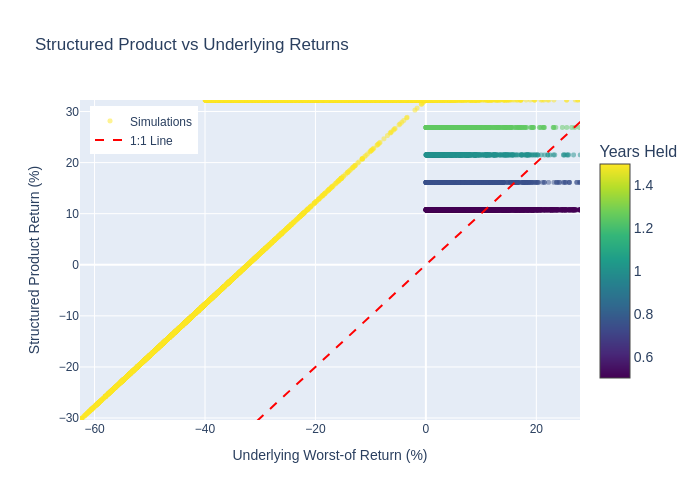
Scatter plot of structured product vs. underlying returns. Points are colored by holding period.
Risk‑Return Profile
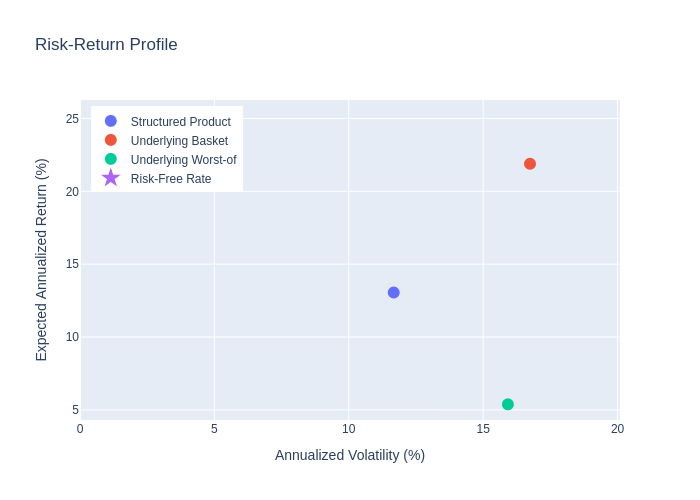
The product offers a favorable risk‑return trade‑off compared to the underlying basket, delivering higher returns than the worst‑performing underlying while maintaining lower volatility than the basket.
Return Distributions
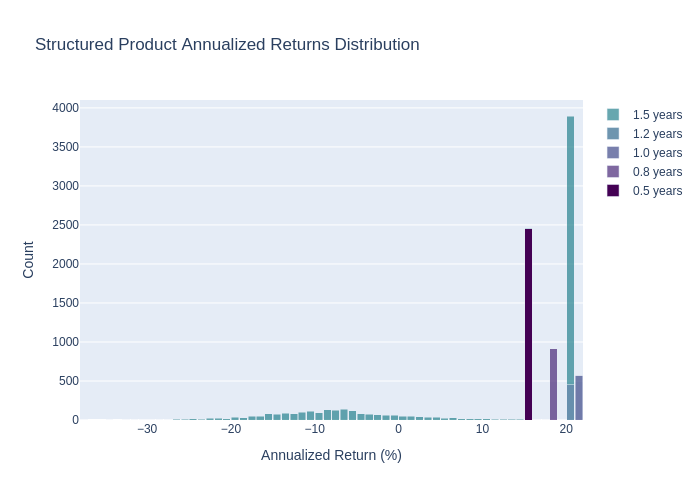
Histogram of structured product annualized returns
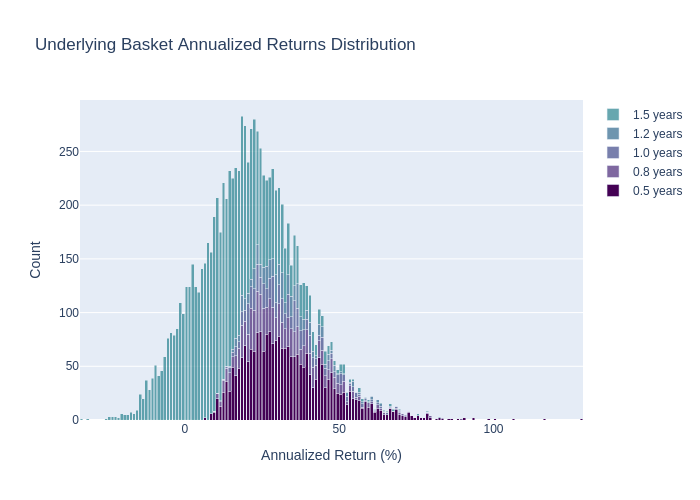
Histogram of underlying basket annualized returns (with dividends)
Scenario Analysis
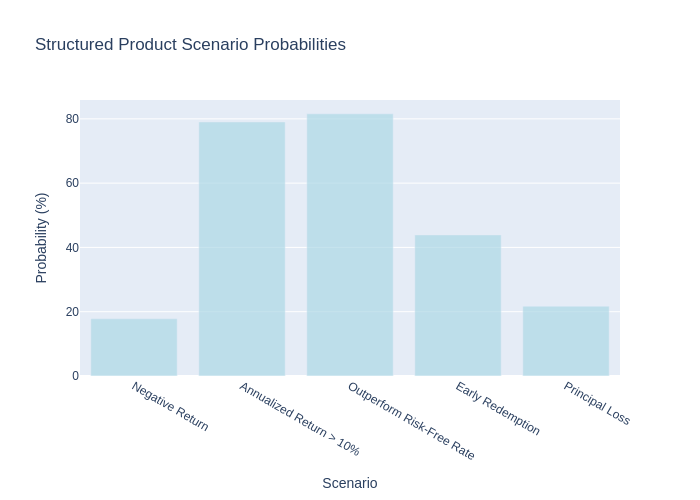
- 82% of simulations outperform the risk‑free rate (1.34%)
- 79% achieve annualized returns above 10%
- 44% experience early redemption
- 22% result in principal loss
Holding Period & Coupon Patterns
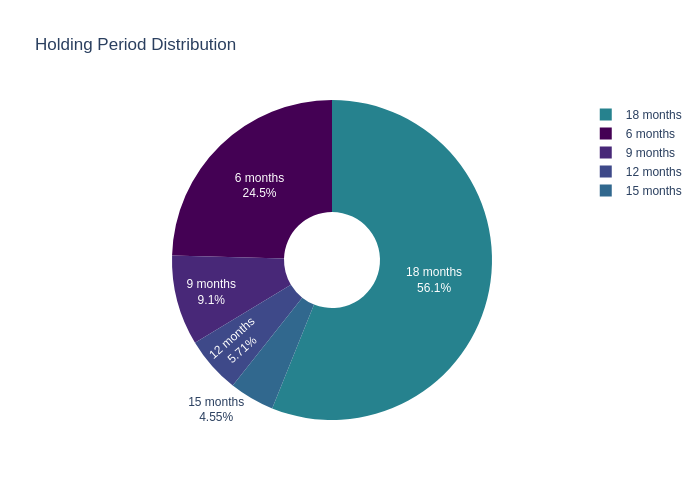
Distribution of months until redemption
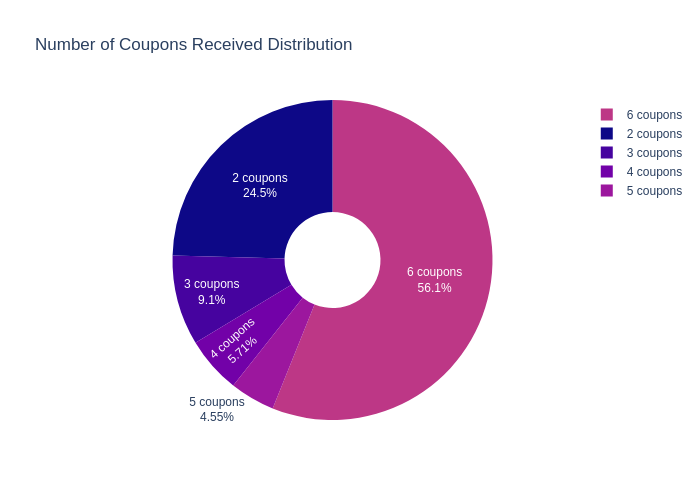
Distribution of number of coupons received
Comparative Box Plot
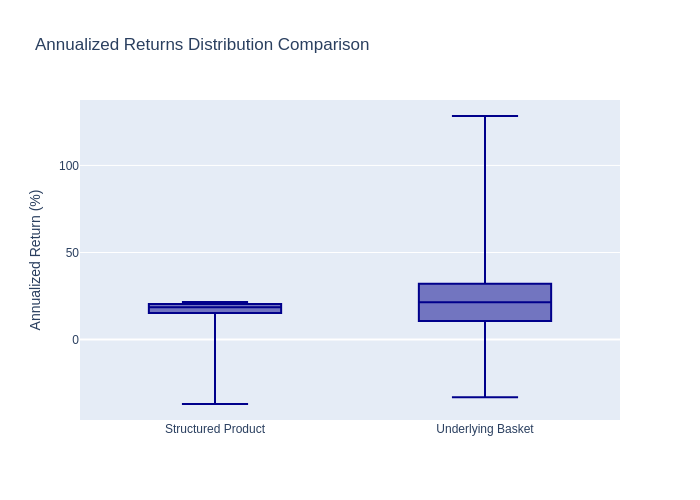
Comparison of annualized returns distributions
Annualized Performance Metrics
| Asset Class | Expected Return (%) | Volatility (%) | Sharpe Ratio* | Probability of Loss (%) | 99% VaR (%) |
|---|---|---|---|---|---|
| Structured Product | 13.05 | 11.67 | 1.00 | 17.80 | -21.45 |
| Underlying Basket | 21.89 | 16.74 | 1.23 | 9.26 | -12.80 |
| Underlying Worst‑of | 5.38 | 15.92 | 0.25 | 33.82 | -32.54 |
| Risk‑Free Rate | 1.34 | 0.00 | N/A | 0.00 | 0.00 |
*Sharpe ratio calculated relative to risk‑free rate of 1.34%
Coupon & Holding Period Statistics
- Average coupons received: 4.59 out of 6 possible
- Average total coupon income: 24.65 index points (on 100 notional)
- Most common holding period: 18 months
- Probability of holding to maturity: 56.10%
Potential Advantages
- Attractive Yield: The 10.75% annual coupon provides regular income substantially above current risk‑free rates.
- Downside Protection: The product offers full principal protection unless the 60% barrier is breached and at least one underlying finishes below its initial level.
- Autocall Feature: 44% probability of early redemption, allowing investors to recover principal early while keeping coupons received.
- Risk‑Adjusted Return: The product delivers a higher Sharpe ratio than the underlying basket, indicating better risk‑adjusted performance.
- Quanto Feature: Eliminates currency risk for CHF‑based investors.
Risks & Considerations
- Principal Risk: 22% probability of principal loss when the barrier is triggered and an underlying finishes below its strike.
- Worst‑of Structure: Performance depends on the weakest underlying, which may underperform the basket average.
- Limited Upside: Returns are capped at coupon income plus principal; no participation in underlying upside beyond autocall levels.
- Issuer Risk: Investors are exposed to UBS AG credit risk (rated Aa2/A+/A+).
- Market Risk: The product is sensitive to correlated downturns in European healthcare/chemical stocks.
Suitability Considerations
- Income‑Seeking Investors: The high coupon may appeal to investors seeking regular income.
- Moderate Risk Tolerance: Suitable for investors who can tolerate occasional principal loss in exchange for enhanced yield.
- Market Outlook: May be appropriate for investors with a neutral‑to‑positive view on the underlying stocks but concerned about severe downside.
- Model: GJR‑GARCH(1,1) with Student's t distribution
- Simulations: 10,000 correlated price paths
- Historical Data: 20 years of daily prices for each underlying
- Dividends: Included as average yield of 10.39% added to underlying returns
- Risk‑Free Rate: 1.34% (Swiss short‑term rate)
- Risk Premium: 6% equity risk premium assumed
- Continuous Barrier Approximation: The continuous barrier is approximated using monthly observations, which may slightly underestimate knock‑in probability.
- Dividend Assumptions: Dividend yields are based on current figures and assumed constant.
- Model Risk: The GARCH model may not capture all market regimes or extreme events.
- Correlation Stability: Historical correlations are assumed to persist over the product life.
- No Fees or Taxes: The analysis excludes any transaction costs, management fees, or tax implications.