
Structured Product Analysis
16.20% p.a. Multi Barrier Reverse Convertible (Quanto CHF) on Richemont, On Holding & Swatch
1. Headline Simulation Results
| Metric | Value |
|---|---|
| Expected annualized return | 9.70% |
| Probability of a negative annualized return | 14.60% |
| 99% confidence VaR (1-year) | -41.62% |
| Expected holding period | ~10.21 months |
| Expected total return over the realized holding period | 7.28% |
| Expected annualized volatility | 16.04% |
The product pays a fixed 16.20% p.a. coupon (4.05% per quarter) that is received regardless of how the underlying stocks perform, in exchange for accepting conditional downside exposure to the worst-performing of three stocks. In simulation it delivers a positive return in ~85% of scenarios, but the outcome is asymmetric: the frequent, modest coupon-driven gains are punctuated by rare but large losses when the barrier is breached.
2. Basic Product Information
Underlyings (worst-of): Compagnie Financiere Richemont (CFR), On Holding AG (ONON), The Swatch Group (UHR).
How it works (plain English)
- Coupon: Every quarter the investor receives 4.05% of the CHF 1,000 denomination (CHF 40.50) — four payments totalling 16.20% — whether or not the stocks rise or fall.
- Downside protection (Barrier 59%): If none of the three stocks ever trades at or below 59% of its starting price during the product's life, the investor gets the full denomination (100%) back at maturity.
- If the barrier is touched (continuous observation): the protection is lost. At maturity the investor then receives the performance of the worst-performing stock (if it is below its starting level), i.e. the deepest loss among the three is borne. If the worst stock has recovered above its starting level, the investor still gets par.
- Issuer callable: On two dates (about month 6 and month 9) the issuer may redeem early, paying par plus the coupon due. No further coupons are paid afterwards.
- Upside capped: The investor never receives more than par plus the fixed coupons — there is no participation in stock gains.
3. Key Statistics — Structured Product vs Benchmark
The benchmark is the equally-weighted basket of the three underlyings on a total-return basis (price + dividends).
| Metric | Structured Product | Underlying Basket (Total Return) |
|---|---|---|
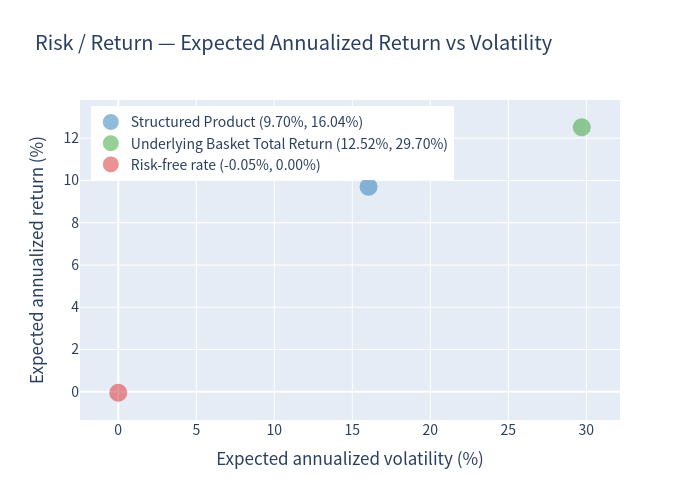
| Expected annualized return | 9.70% | 12.52% |
| Expected annualized volatility | 16.04% | 29.70% |
| Probability of loss | 14.60% | 38.42% |
| 99% confidence VaR (1 year) | -41.62% | -40.76% |
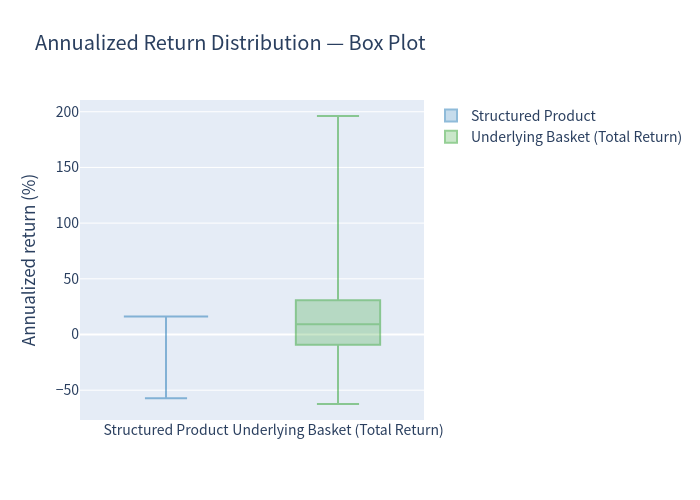
The product trades roughly 2 points of upside (annualized) versus the basket in exchange for roughly half the volatility and a ~24-percentage-point lower probability of loss. On a risk-adjusted basis the coupon-heavy structure is materially more efficient, but the deep 99% VaR shows the tail is not eliminated — it is concentrated into the barrier-breach scenario.
4. Charts
4.1 Simulation Outcomes — Product vs Underlying (1:1 reference line)
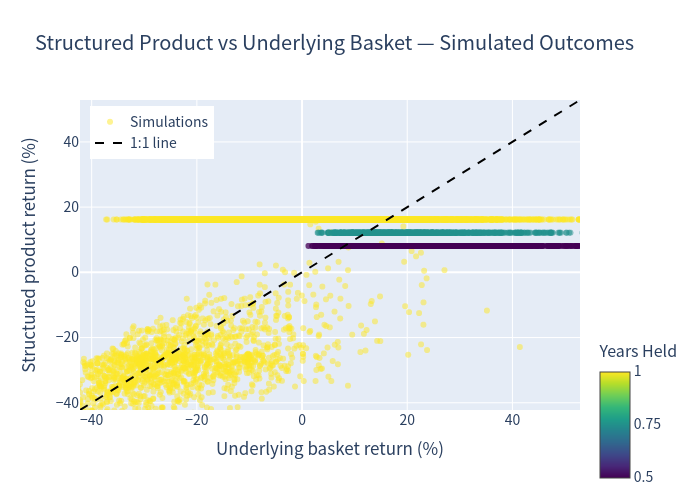
Points sit on a flat band near the coupon level for most simulations (product capped at par + coupon), with a downward-sloping cloud where the barrier-loss region is entered. The colour shows the number of years held.
4.2 Distribution of Annualized Returns
Structured product:
Underlying basket (total return):
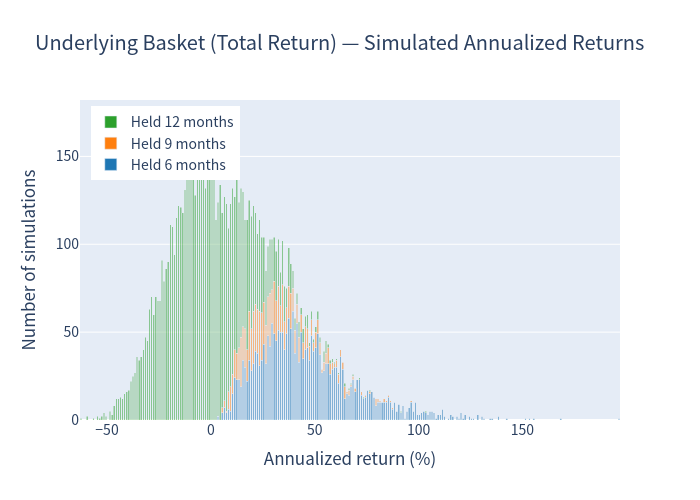
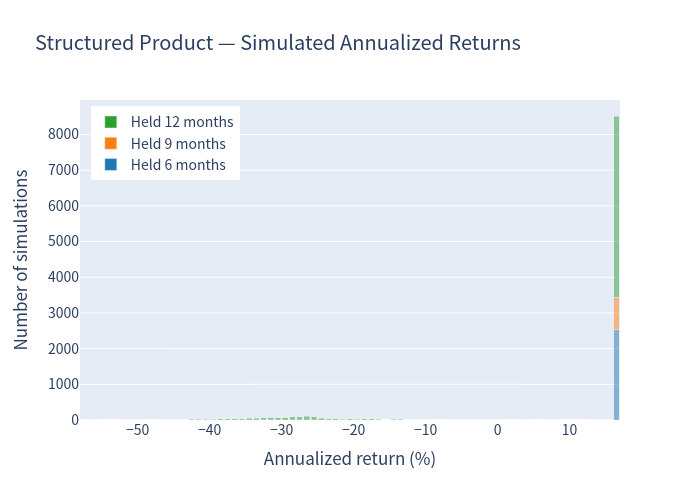
The product's distribution is tightly concentrated (most mass between -5% and +17%), while the basket's distribution is far wider and more two-sided.
4.3 Risk / Return
4.4 Box Plot — Annualized Return
4.5 Scenario Probabilities
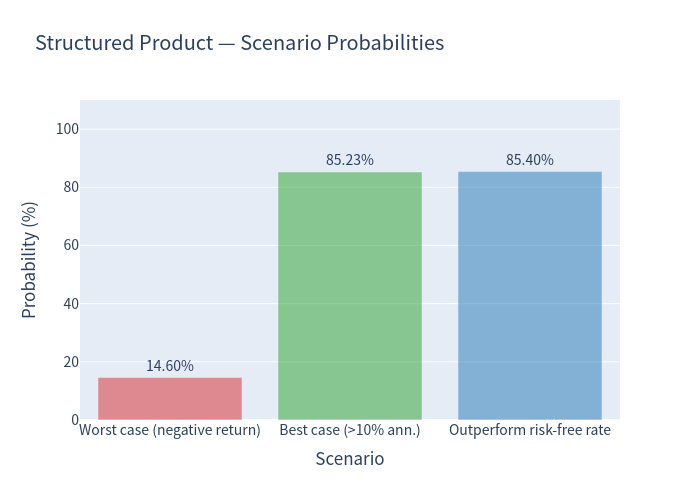
- Worst case (negative return): 14.60%
- Best case (>10% annualized): 85.23%
- Outperforms the risk-free rate: 85.40%
4.6 Holding Period & Coupon Outcomes
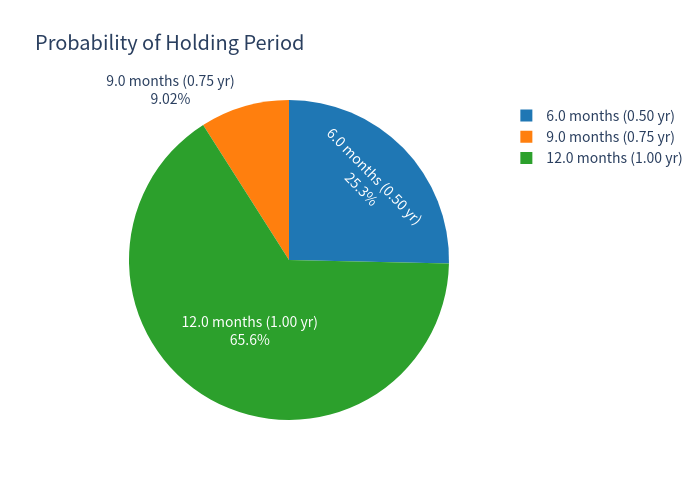
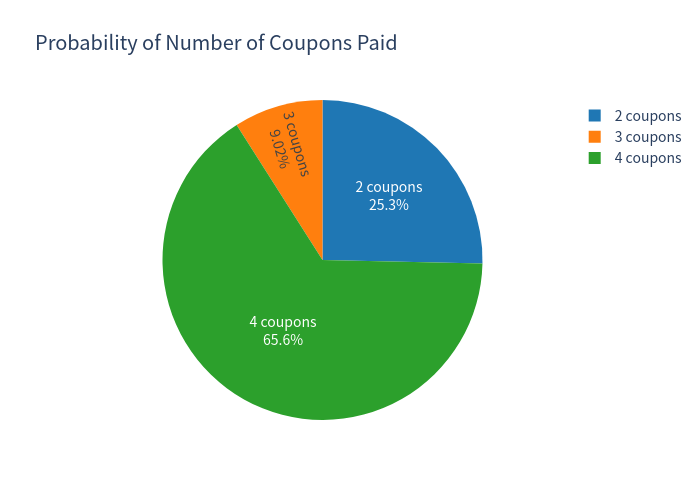
- Redeemed early at month 6: 25.34% of paths
- Redeemed early at month 9: 9.02% of paths
- Held to maturity (month 12): 65.64% of paths
5. Investment Commentary
Strengths
- High headline yield: a 16.20% p.a. coupon that is contractually paid irrespective of the stocks' performance.
- Deep barrier buffer: the 59% barrier leaves roughly a 41% cushion on each stock before the protection is lost.
- Lower risk than the basket: expected volatility of ~16% versus ~30% for the equal-weight basket, and a probability of loss of 14.6% versus 38.4%.
- Frequent positive outcomes: ~85% of simulations finish with a gain and beat the risk-free rate.
Risks / drawbacks
- Capped upside: redemptions never exceed par; any rally beyond the coupons is forgone.
- Worst-of exposure: outcomes are driven by the single weakest of three high-volatility luxury/consumer names (On Holding's standalone volatility is ~57%), so a single stock's collapse is enough to trigger losses.
- Barrier tail risk: although the barrier is far away, the 99% VaR of -41.62% shows losses can be large when it is breached — the coupon does not fully compensate the deepest scenarios.
- Callable: the issuer can terminate the note early (about 34% of paths in simulation), truncating the coupon stream and capping the investor's total income.