
16.00% p.a. Multi Barrier Reverse Convertible (Callable)
Worst-of Nordex SE · Schneider Electric SE · Siemens Energy AG — EUR, 12-month maximum term
Simulation-based evaluation. All figures are model outputs (10,000 Monte-Carlo scenarios), not guarantees. This is an analysis, not investment advice.
Headline simulation results
| Metric | Structured Product | Underlying (equal-weight basket, total return) |
|---|---|---|
| Expected annualized return | +12.23% | +14.27% |
| Probability of negative return | 7.47% | 38.06% |
| 99% confidence VaR (1-year) | −42.98% | −42.32% |
| Expected annualized volatility | 13.44% | 32.55% |
| Probability of outperforming the risk-free rate (2.00%) | 92.52% | 59.38% |
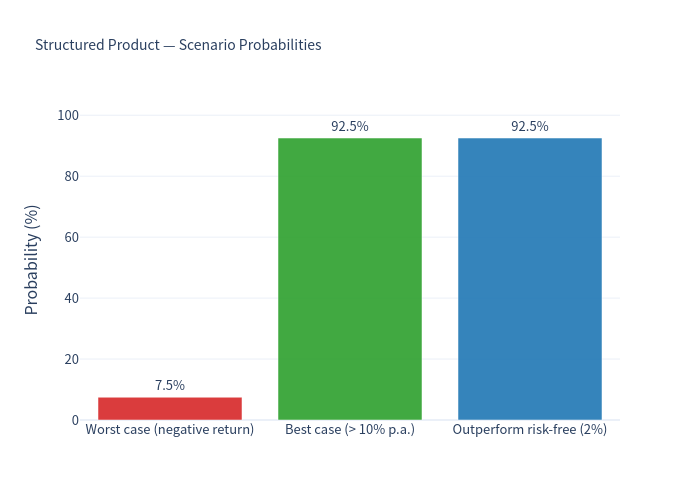
The product pays a fixed 16.00% p.a. coupon and delivers a +12.23% expected annualized return with a very high probability of a positive outcome (92.53%). Roughly 1-in-13 scenarios (7.47%) ends at a loss, and the tail is severe — the 99% VaR is about −43%, essentially the same as holding the shares directly. The trade-off is favourable: the product captures a comparable expected return to the underlying at less than half the volatility and a five-fold lower probability of loss.
How it works (in plain terms)
- You invest EUR 1,000 (100%). The product is linked to the share price of three companies: Nordex SE, Schneider Electric SE and Siemens Energy AG. Your outcome is driven by the worst-performing of the three.
- You are paid 16.00% p.a. in quarterly coupons of EUR 40 — paid unconditionally, regardless of how the shares move.
- Downside protection (barrier at 49%). If no share ever trades at or below 49% of its starting level (monitored continuously, every trading day), you get your 100% back at maturity plus all coupons.
- If the barrier is breached ("knocked in"), protection is lost. At maturity:
- If the worst share is above its starting level → you still get 100% back.
- If the worst share is at or below its starting level → you receive that worst share (physical delivery) instead of cash, so you absorb its decline from the start level.
- Issuer call (early redemption). The Issuer may redeem the product early on two dates (≈ 6 and 9 months). If called, you receive 100% + the coupon due on that date, and the product ends. The call is at the Issuer's discretion (modelled here as exercised when the worst share is at or above its start level).
- Upside is capped — the product never redeems above par. Your only "upside" is the fixed coupon.
Key statistics
| Statistic | Structured Product | Underlying basket (total return) |
|---|---|---|
| Expected annualized return | 12.23% | 14.27% |
| Expected annualized volatility | 13.44% | 32.55% |
| Probability of loss | 7.47% | 38.06% |
| 99% VaR (1-year) | −42.98% | −42.32% |
| Best-case annualized return (cap) | 16.00% | n/a (uncapped) |
| Expected holding period | 10.17 months | — |
| Expected total return over realized holding period | +9.79% | +7.00% |
Behavioural detail (product)
- Barrier breach probability: 7.52% of scenarios ever touch the 49% barrier (continuous monitoring).
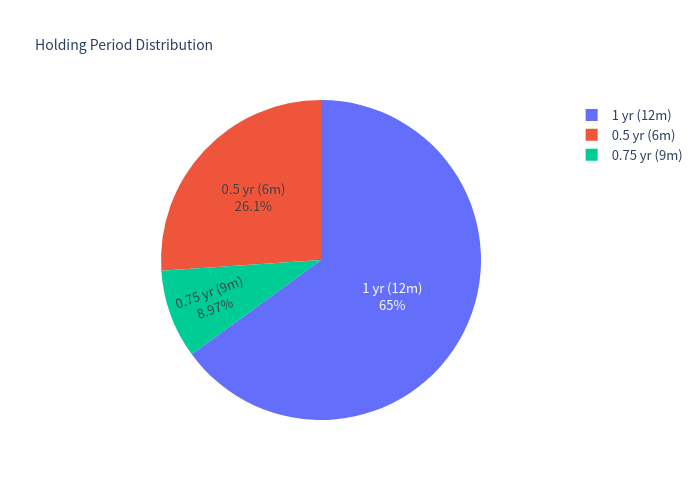
- Early-redemption (call) probability: 26.06% at ~month 6 and 8.97% at ~month 9 — the product runs the full 12 months in 64.97% of scenarios.
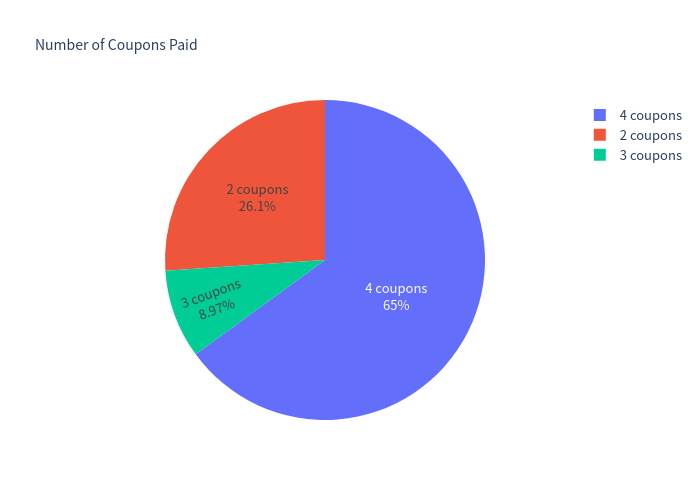
- Coupons paid: 2 coupons in 26.06% of paths, 3 in 8.97%, and the full 4 coupons in 64.97%.
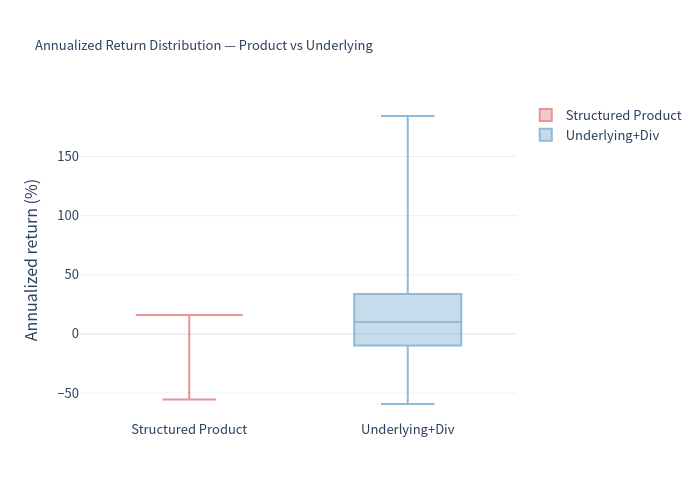
- Return shape: in the large majority of paths the annualized return locks in at the 16% coupon; losses are concentrated and only occur when the barrier is breached and the worst share finishes below its start level.
Because a meaningful share of paths redeem early, the expected holding period (~10.2 months) is shorter than the maximum term; the annualized figures for the shorter paths should therefore be read together with the total return (+9.79%) and holding period.
Charts
Simulation outcomes — product vs underlying
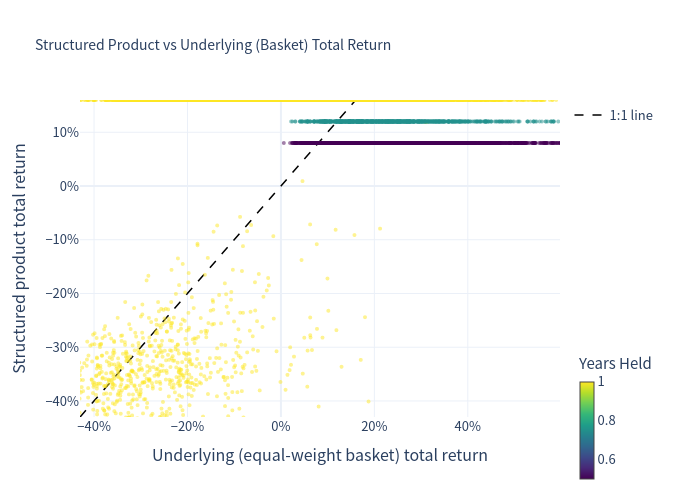
Each point is one scenario. The product's returns cluster at the coupon level (8%, 12%, 16% total) while the underlying is widely dispersed; the product sits mostly above the 1:1 line for positive market moves and below it in the far tail (barrier-breach losses). Colour = years held.
Distribution of simulated annualized returns
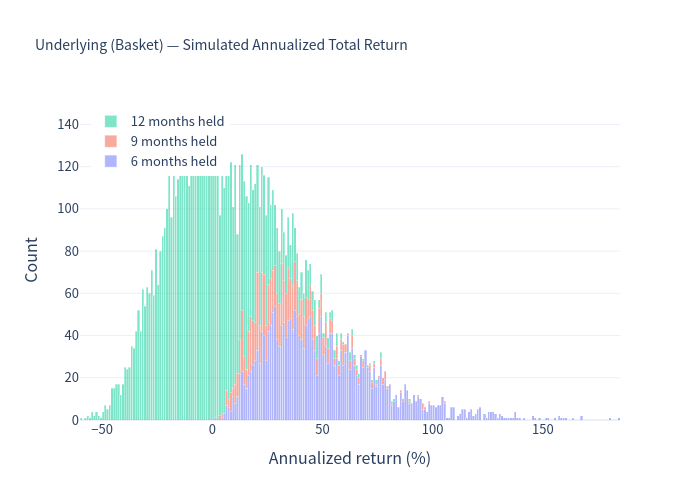
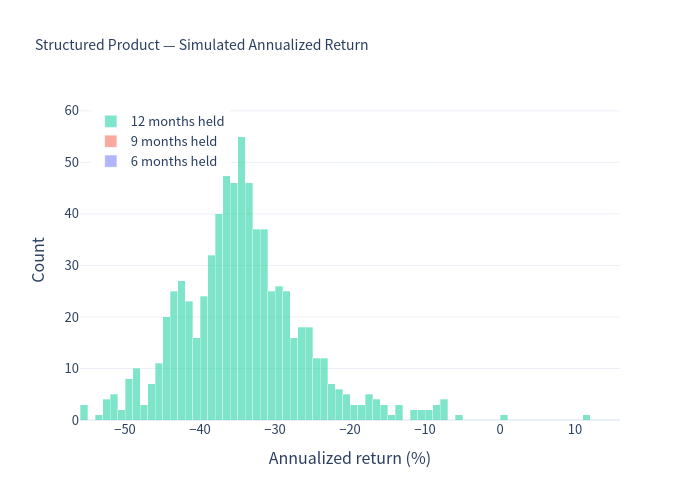
The underlying (basket, total return) is broadly spread with heavy left and right tails; the product is tightly concentrated at the 16% coupon with a thin, deep loss tail. Stacks show the holding period (6 / 9 / 12 months).
Scenario probabilities
Risk / return positioning
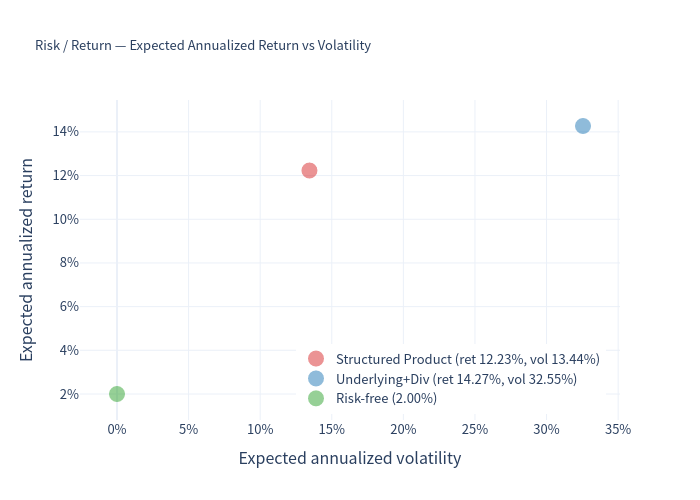
The product sits far to the left of the underlying — nearly the same expected return at roughly 40% of the volatility.
Return distribution comparison
Product life-cycle breakdown
Investment commentary
Potential merits
- High, unconditional coupon: 16.00% p.a. (4% per quarter) paid regardless of market direction, giving a 92.53% probability of a positive outcome and a 92.52% probability of beating the 2% risk-free rate.
- Large downside buffer: the barrier at 49% of the starting level means the shares must fall more than half before protection is lost, and it takes a breach plus the worst share finishing below its start to generate a loss.
- Attractive risk-adjusted profile: expected return of 12.23% (only ~2 points below the underlying's) for 13.44% volatility vs 32.55% for the shares and a 5x lower loss probability (7.47% vs 38.06%).
- Anti-fragile in rising markets: if the shares appreciate, the Issuer is likely to call the note, returning capital early plus coupons, shortening exposure.
Risks worth noting
- Capped upside: the maximum return is the coupon; the product cannot participate in a sharp rally in the shares.
- Severe tail risk: the 99% VaR (−43%) is almost identical to that of holding the shares directly — when all three underlyings fall together (and the barrier is breached) the physical-delivery clause passes the worst-of loss straight to the investor.
- Worst-of dependence and three relatively high-beta names (two wind/energy-equipment stocks) increase the chance that at least one breaches the barrier compared with a single-name note.
- Issuer call truncates the coupon stream in strong markets and is outside the investor's control; Issuer credit risk (Basler Kantonalbank) applies.
Generated from a Monte-Carlo simulation of the product's contract terms. Figures are estimates based on historical market behaviour and the stated model assumptions; actual outcomes will differ.