
MSAMP5 Jump Notes with Auto-Callable Feature due November 1, 2033
Headline Results
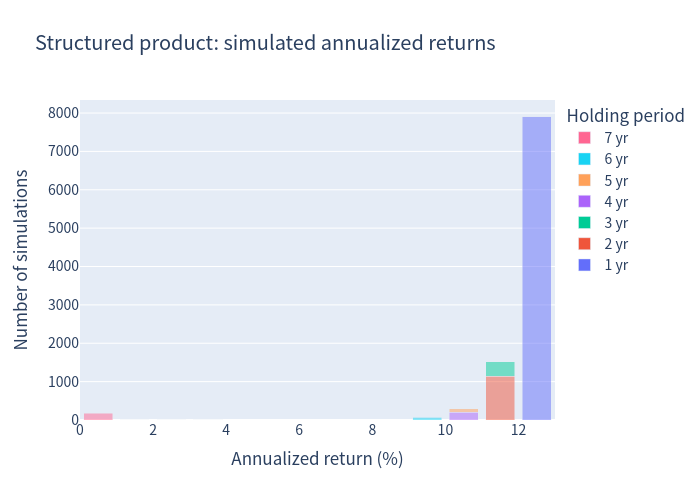
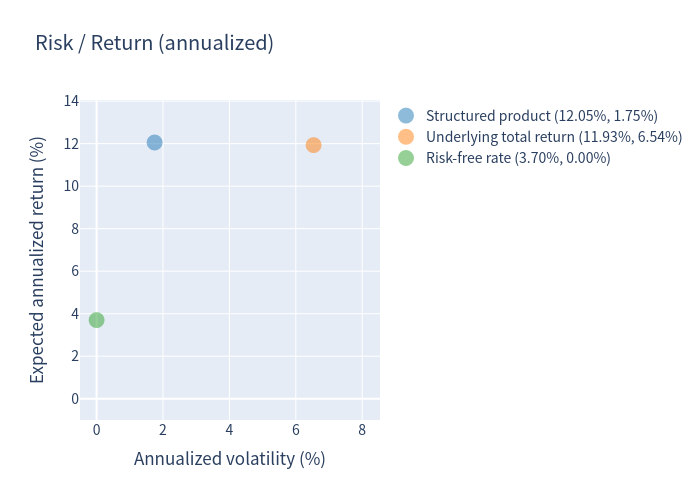
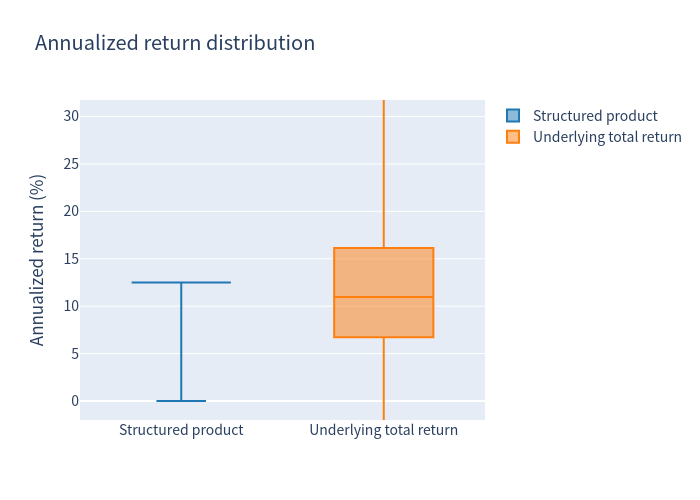
The notes are principal protected. Across 10,000 simulated paths the redemption value never fell below par: every outcome returned at least 0% (return of principal), and in ~98% of paths the note beat the prevailing risk-free rate. The product delivered a higher expected return than the index while exhibiting a much lower volatility and no simulated downside.
Basic Product Information
- Issuer / Guarantor: Morgan Stanley Finance LLC / Morgan Stanley
- Underlier: Morgan Stanley Amplitude Index (MSAMP5) — a single, proprietary Morgan Stanley multi-asset, volatility-managed index.
- Stated principal: $1,000 per note (USD). All payments are subject to the issuer's credit risk.
- Tenor: approximately 7 years (priced late October 2026; maturing 1 November 2033).
- Coupon: none — the notes do not pay periodic interest.
How the note works (in plain language)
The note is a principal-protected "jump" note with a step-up auto-call:
- Step-up auto-call. Once a year (years 1–6), if the index is at or above 101% of its starting level, the note is redeemed early for a fixed amount that grows by 12.5% of principal each year — $1,125 at year 1, $1,250 at year 2, $1,375 at year 3, $1,500 at year 4, $1,625 at year 5 and $1,750 at year 6.
- Maturity "jump". If the note is never called, at year 7 the investor receives principal plus a 1-for-1 participation in any index gain (uncapped). If the index is down, the note "jumps" back to par and the investor still receives 100% of principal.
In short: the investor is paid a generous step-up premium whenever the index is merely above its starting level, while the downside is floored at par.
Basis of analysis: MSAMP5 is a proprietary index with only very limited live history, so the simulation uses a representative, diversified multi-asset proxy (global equities, investment-grade bonds, gold and commodities) calibrated to a moderate-volatility profile.
Key Statistics
| Metric | Structured product | Underlying (total return) |
|---|---|---|
| Expected annualized return | 12.05% | 11.93% |
| Expected annualized volatility | 1.75% | 6.54% |
| Probability of loss | 0.00% | 0.82% |
| 99% confidence VaR (1 year) | 0.00% | 0.90% |
Expected holding period: 17.3 months. Average total return over that holding period: 16.32% (product) vs 10.31% (underlying, price-only). The high expected annualized return is driven chiefly by the step-up call premium, which is locked in when the index is only marginally above its start.
Simulation Charts
Outcome scatter — product vs underlying
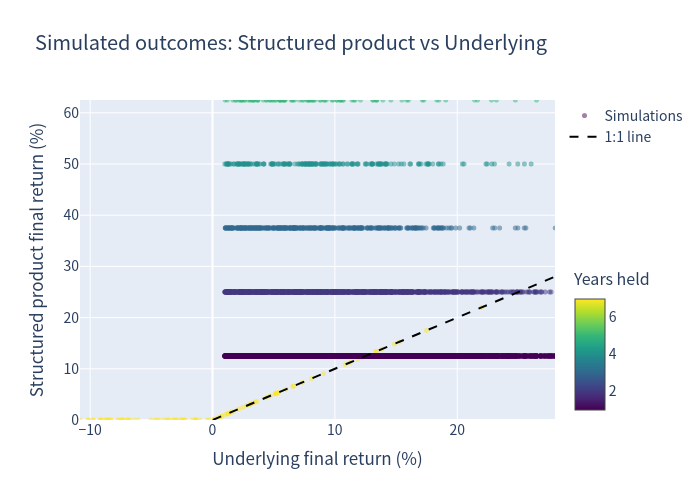
Each point is one simulation; the dashed line is the 1:1 reference. The product's payoff is floored at 0% and steps up when the underlying is positive, which is why the cloud sits above the 1:1 line on the left.
Underlying — simulated annualized returns
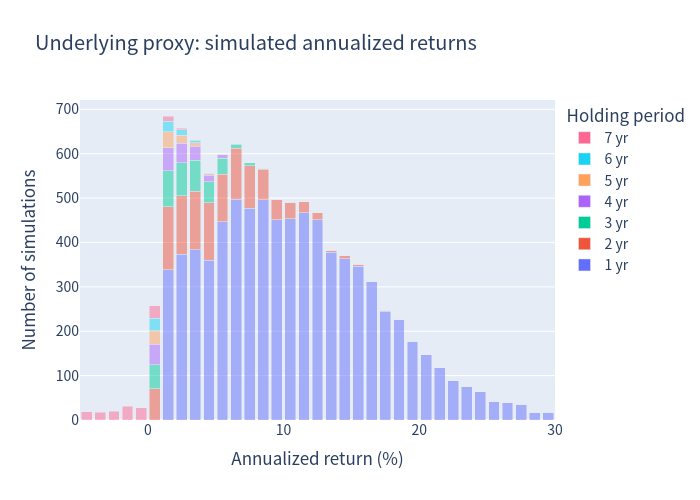
Structured product — simulated annualized returns
Scenario probabilities
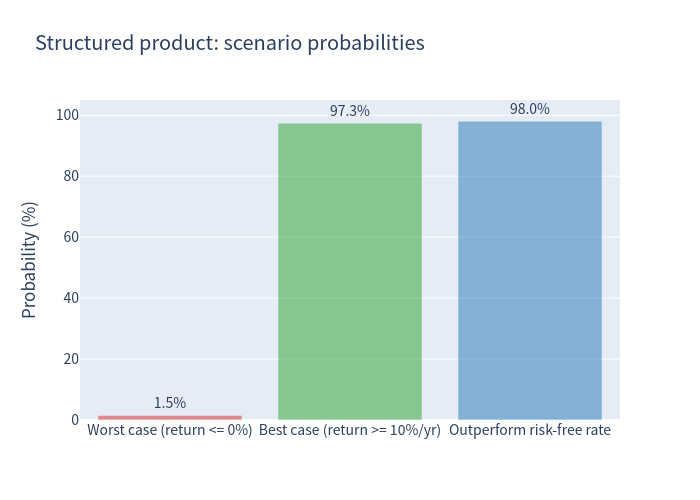
Worst case (return ≤ 0%): 1.5%. Best case (≥ 10% p.a.): 97.3%. Outperform risk-free rate: 98.0%.
Risk / return
Return distribution comparison
Holding-period mix
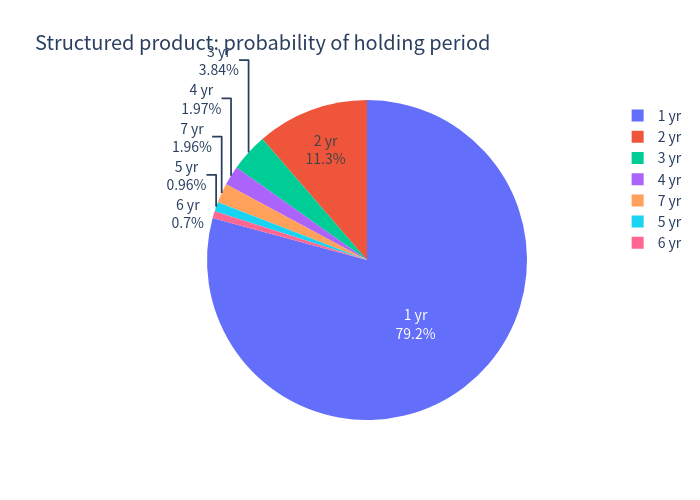
Most likely outcome: the note is called after 1 year (≈79% of paths); the average holding period is 17.3 months.
Investment Commentary
Strengths
- Full principal protection. Downside is floored at par, so the simulated loss probability and 1-year VaR are both 0%.
- Attractive step-up premium. The 12.5%-per-annum call premium is high relative to the index's expected return; because the call trigger is only 101% of the start, the note is called early in ~79% of paths, locking in +12.5% after just one year.
- Uncapped upside if held to maturity. If the note is never called, participation in index gains is 1-for-1 and uncapped.
- Favourable risk/return profile. The product's expected return (12.05%) exceeded the underlying's (11.93% total / 9.41% price-only) at a small fraction of the volatility (1.75% vs 6.54%).
Considerations
- Capped call upside. Once the index is at/above 101%, the note is redeemed for a fixed amount, so a strong index rally above the step-up schedule is not captured.
- Proxy index. MSAMP5 is new and proprietary; simulated statistics rely on a representative multi-asset proxy and can differ from the live index.
- Credit and liquidity. Payments depend on the issuer's creditworthiness, and the notes are not listed.