
Morgan Stanley Callable Jump Notes due October 30, 2031 — Simulation Analysis
Headline Simulation Results
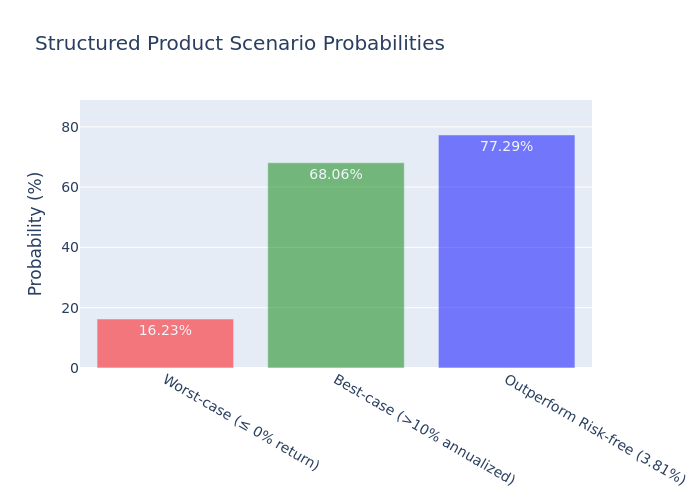
(principal protected; probability of zero return is 16.23%)
Basic Product Information
| Feature | Detail |
|---|---|
| Issuer | Morgan Stanley Finance LLC (guaranteed by Morgan Stanley) |
| Underlying | S&P 500® Futures Excess Return Index |
| Stated principal | $1,000 per note |
| Term | 5 years (maturity October 30, 2031) |
| Participation rate | 140% |
| Upside cap | No explicit cap, but issuer callable |
| Principal protection | Yes, at maturity |
| Call feature | Monthly from November 1, 2027 (month 12) to October 2, 2031 (month 59) |
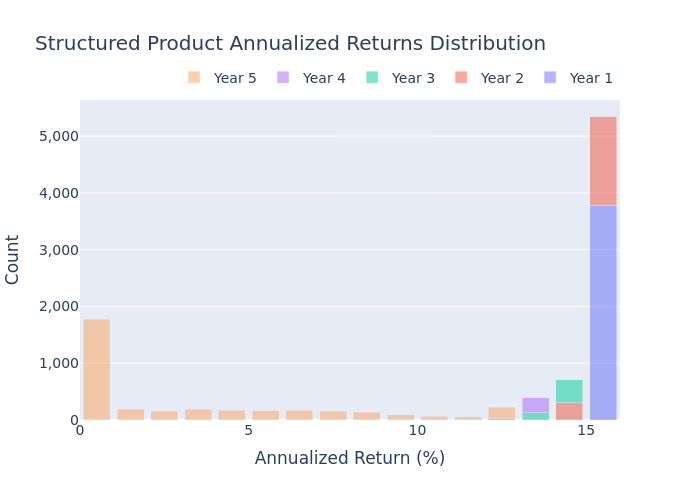
| Redemption payment | Increases at approximately 15.75% per annum (simple) |
| Coupon | None |
How It Works (Layman Explanation)
This is a principal-protected note linked to the S&P 500 Futures Excess Return Index. If you hold it to maturity and the index is higher than its starting level, you receive your $1,000 principal back plus 140% of the index gain. If the index is flat or down at maturity, you still receive your $1,000 principal back.
However, the issuer can call the notes early on a monthly basis starting one year after issue. If called, you receive a redemption payment that grows over time (about 15.75% per year simple). Once called, no further payments are made. The notes do not pay regular interest.
Key Statistics (Simulated)
| Metric | Structured Product | Underlying (S&P 500 Futures ER Index) |
|---|---|---|
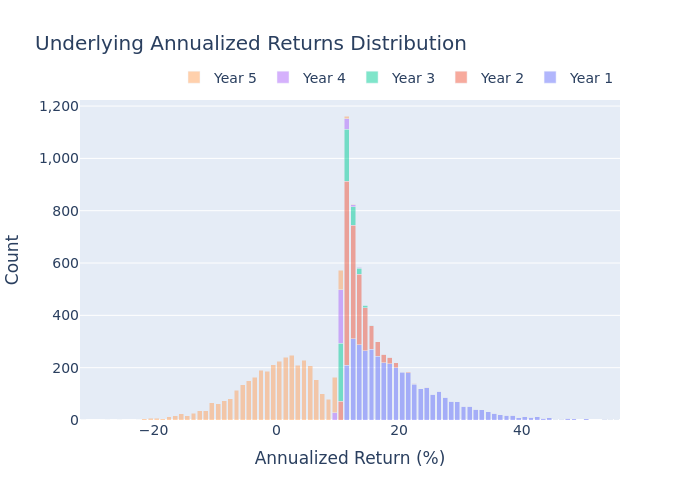
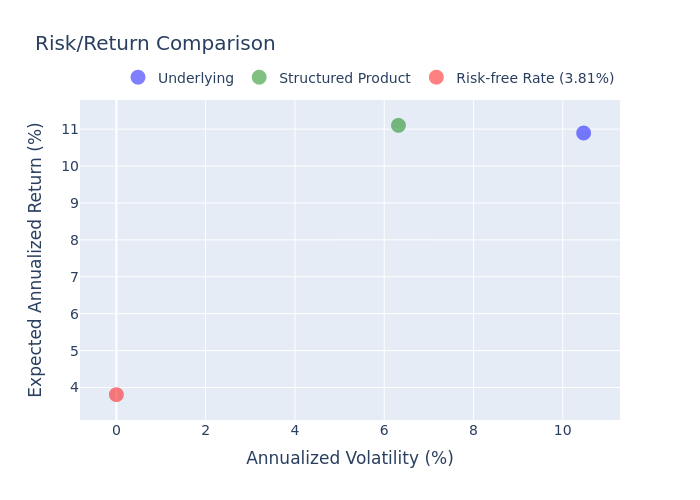
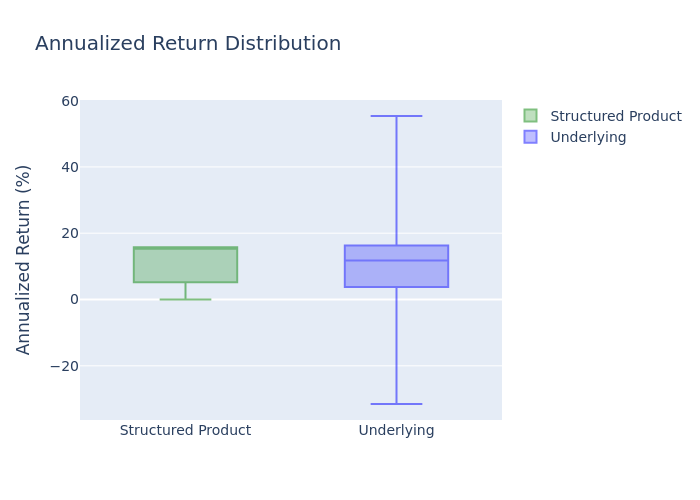
| Expected annualized return | 11.10% | 10.89% |
| Expected annualized volatility | 6.32% | 10.47% |
| Probability of loss | 0.00% | 16.23% |
| 99% VaR (1-year) | 0.00% | -13.75% |
| Expected holding period | 31.48 months | — |
| Expected total return over holding period | 20.20% | 14.82% |
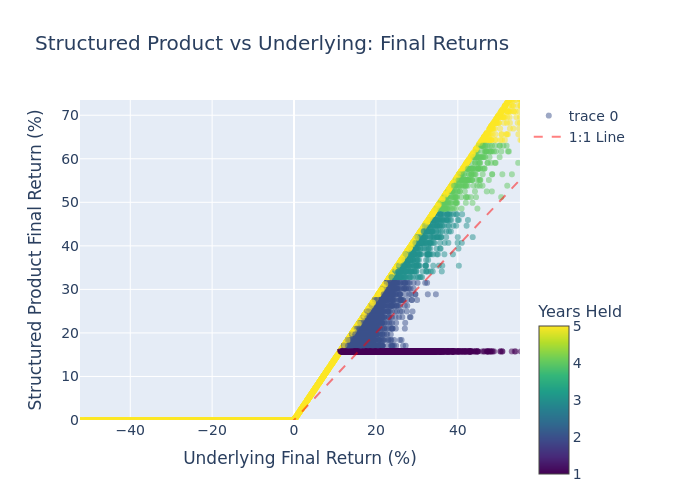
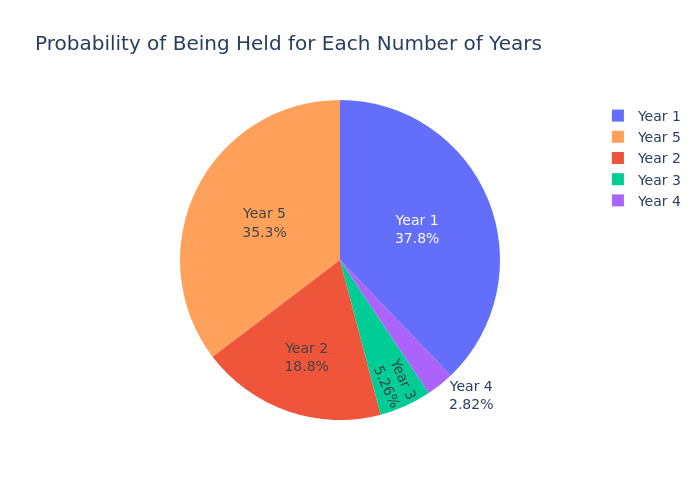
The structured product offers a slightly higher expected annualized return than the underlying with substantially lower volatility, thanks to principal protection and the call feature. The probability of being called is 66.48%; the most likely call month is month 12 (37.82% of simulations).
Charts
1. Scatter Plot: Final Returns (Product vs Underlying)
2. Underlying Annualized Returns Distribution
3. Structured Product Annualized Returns Distribution
4. Scenario Probabilities
5. Risk/Return Comparison
6. Annualized Return Box Plot
7. Probability of Being Held for Each Number of Years
Investment Commentary
Pros
- Principal protection: At maturity, you receive at least your $1,000 back, regardless of index performance.
- Upside participation: If the index rises and the notes are not called, you participate at 140% of the gain, with no explicit cap.
- Lower volatility: The product’s simulated annualized volatility (6.32%) is significantly lower than the underlying’s (10.47%).
- Outperformance of risk-free rate: In 77.29% of simulations, the product’s annualized return exceeded the 1-year average risk-free rate of 3.81%.
- Attractive call premium: If called early, the redemption payment provides an annualized return of approximately 15.75% (simple), which is attractive relative to current rates.
Cons / Considerations
- Call risk: The issuer is likely to call the notes when it is economically advantageous for them, which often coincides with a rising index. This caps your upside at the redemption payment and may force reinvestment at lower prevailing rates.
- Opportunity cost: If the index rallies strongly, the product’s return may lag a direct investment in the index because of the call feature.
- Credit risk: The notes are unsecured obligations of Morgan Stanley Finance LLC and are guaranteed by Morgan Stanley. If the issuer defaults, you could lose some or all of your investment.
- No regular income: The notes do not pay coupons or interest, so there is no periodic cash flow.
Simulation assumptions: The underlier is proxied by the E-mini S&P 500 futures contract (ES=F) because the exact S&P 500 Futures Excess Return Index had no available historical data. The issuer’s call decision is modeled as calling when the index level exceeds the threshold at which the intrinsic maturity payoff equals the redemption payment. This is a simplified assumption.