
11.60% p.a. Multi Barrier Reverse Convertible — Simulation Analysis
Underlyings: Julius Bär, Swissquote, UBS (worst-of at maturity, any-of barrier) | Currency: CHF | Term: ~21 months | Coupon: 11.60% p.a. (quarterly, 7 × CHF 29.00)
Headline Simulation Results
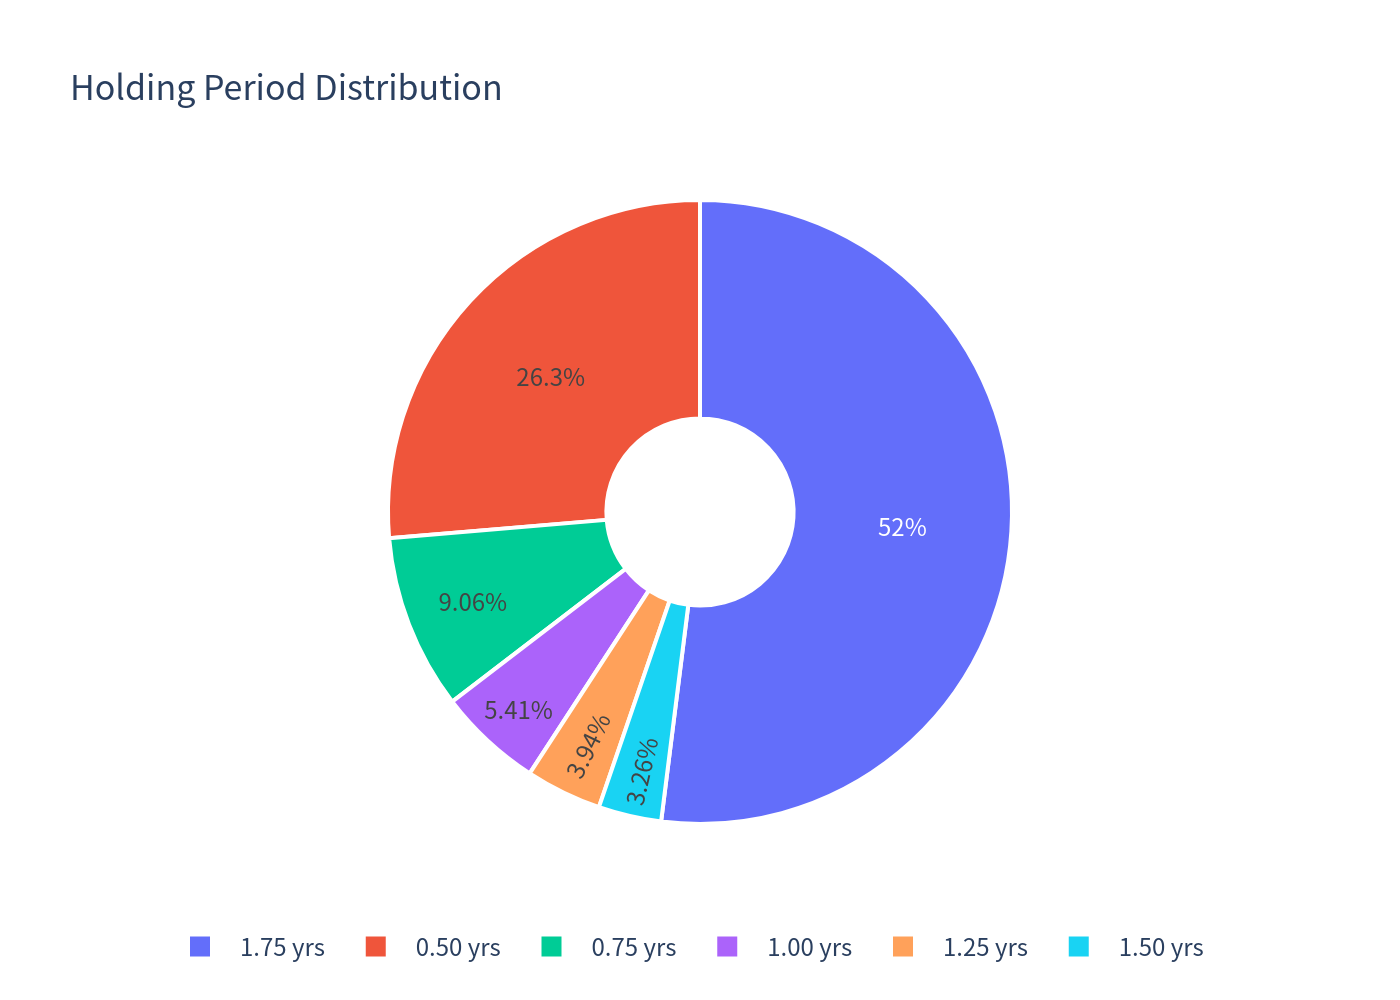
The product pays a high quarterly coupon (11.60% p.a.) regardless of underlying performance, with conditional downside protection at a 59% barrier. In the simulation, 51.99% of scenarios run to the full 21-month maturity, while 48.01% are called early by the issuer. 26.39% of scenarios result in principal loss via physical delivery of the worst-performing underlying.
Basic Product Info
How it works (layman's explanation)
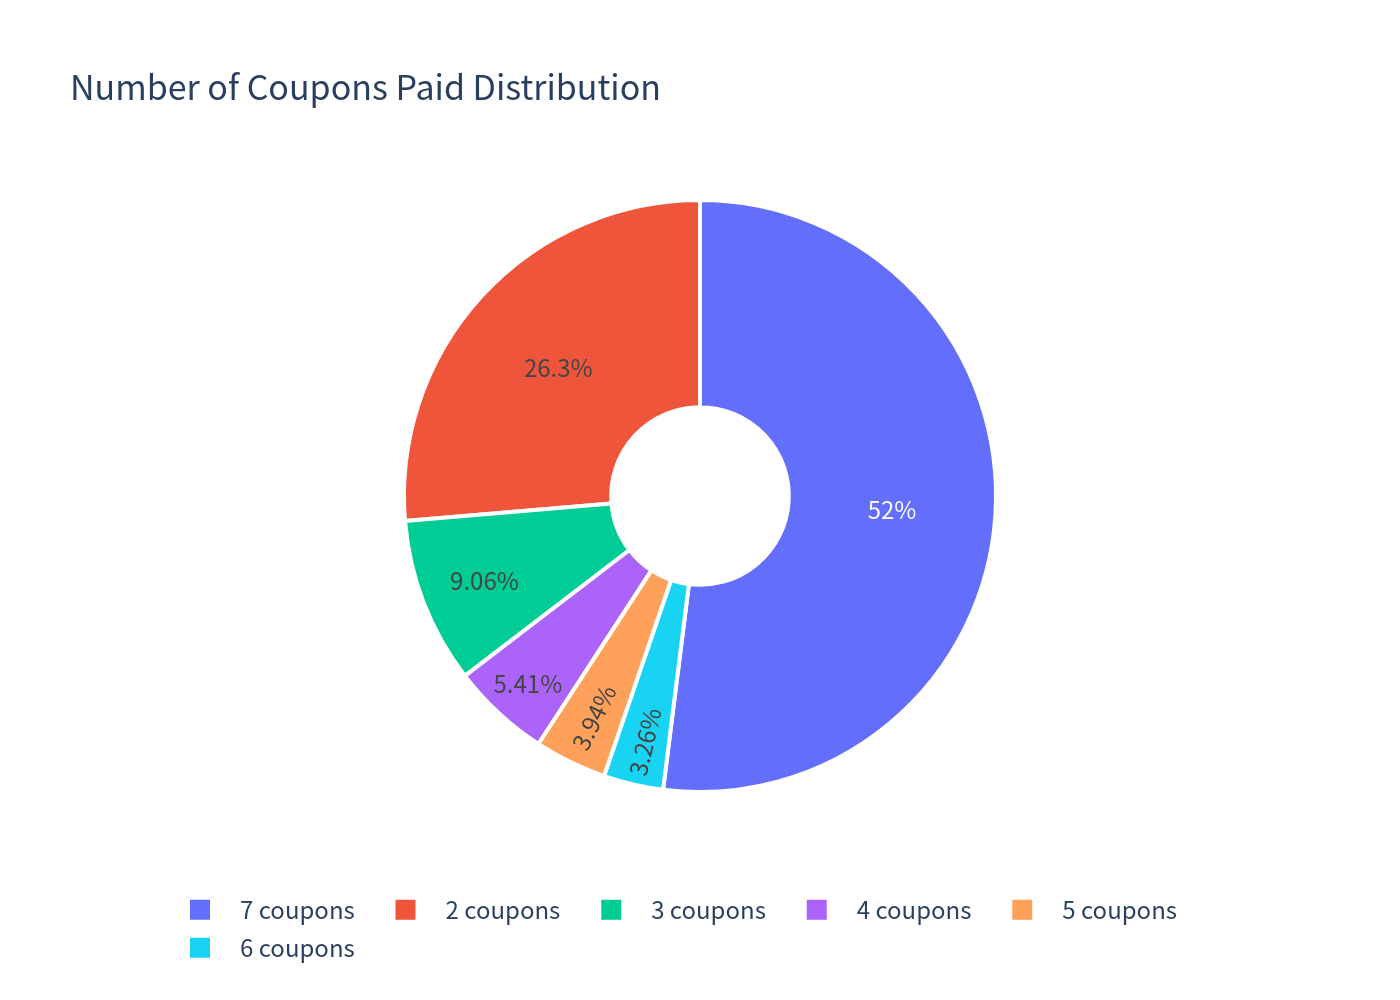
An investor buys a bond-like product for CHF 1,000 that pays a high quarterly coupon of CHF 29.00 (2.90%) — a total of up to 7 payments. The coupon is paid unconditionally on each payment date.
At maturity (or when the issuer calls the product early), the investor receives:
- Full principal (CHF 1,000) — as long as none of the three bank shares ever fell to or below 59% of its initial level during the observation period; or if a barrier was hit but the worst-performing share finishes at or above its initial level.
- Shares of the worst-performing bank — only if a barrier event occurred and the worst-performing share finishes below its initial level. The investor then receives shares worth less than the initial CHF 1,000 (principal loss).
The issuer may call the product early at quarterly observation dates (starting month 6), paying back principal plus the coupon for that date. In rising markets the product tends to be called, capping total coupon income.
In short: a high fixed coupon in exchange for capped upside and potential principal loss if any of the three Swiss bank shares drops more than 41% and fails to recover above its starting level by maturity.
Key Statistics — Structured Product vs Underlying Basket
| Metric | Structured Product | Underlying basket (total return) |
|---|---|---|
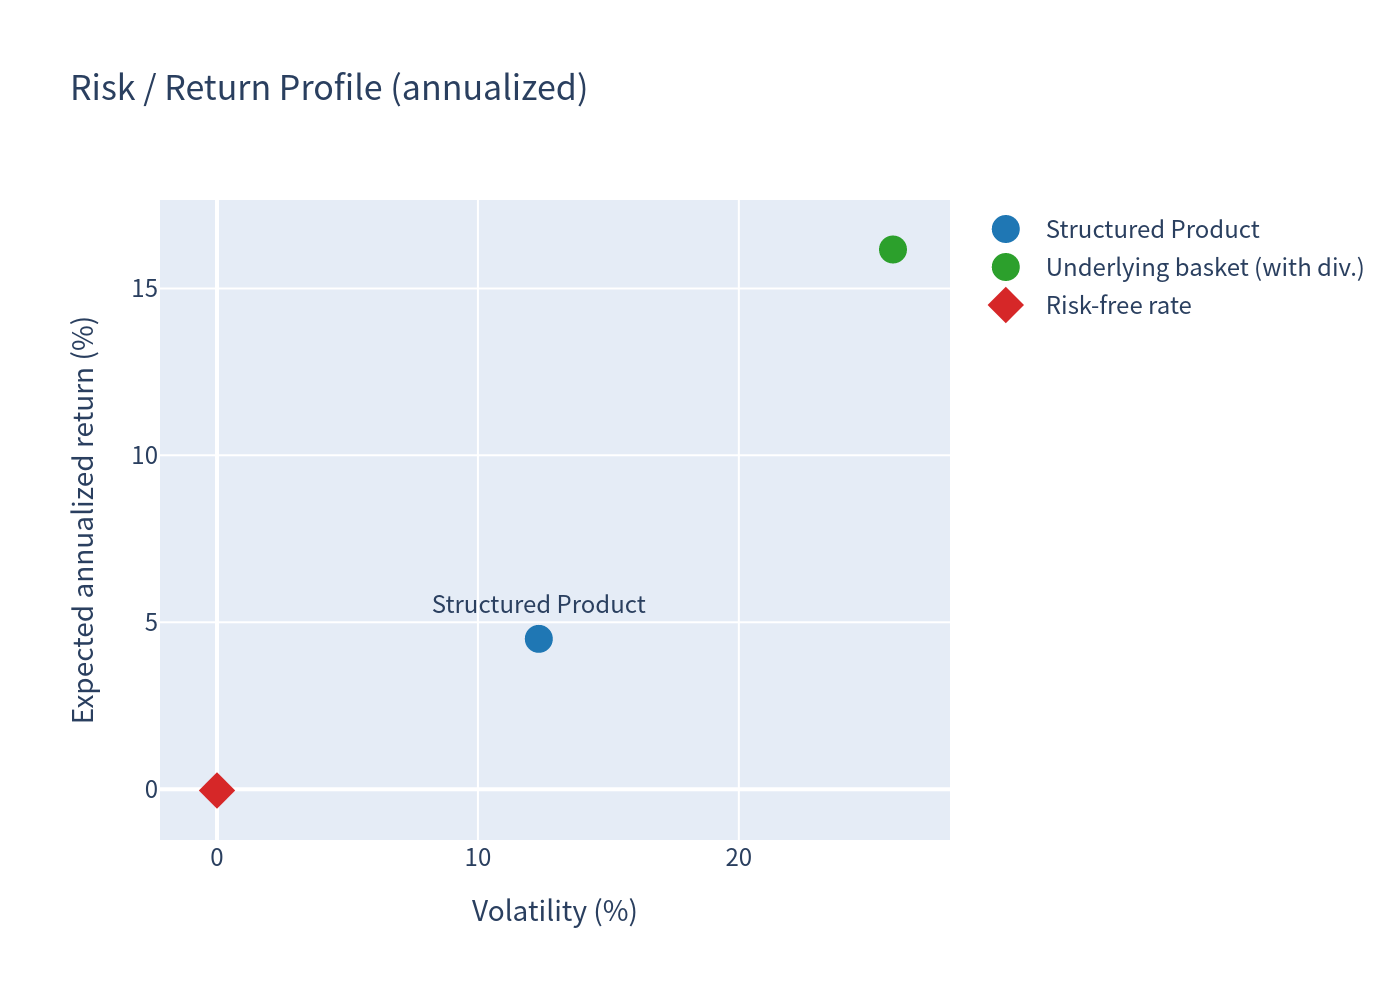
| Expected annualized return | 4.50% | 16.17% |
| Expected annualized volatility | 12.33% | 25.91% |
| Probability of loss | 25.02% | 30.21% |
| VaR 99% (1-year annualized) | −29.47% | −29.33% |
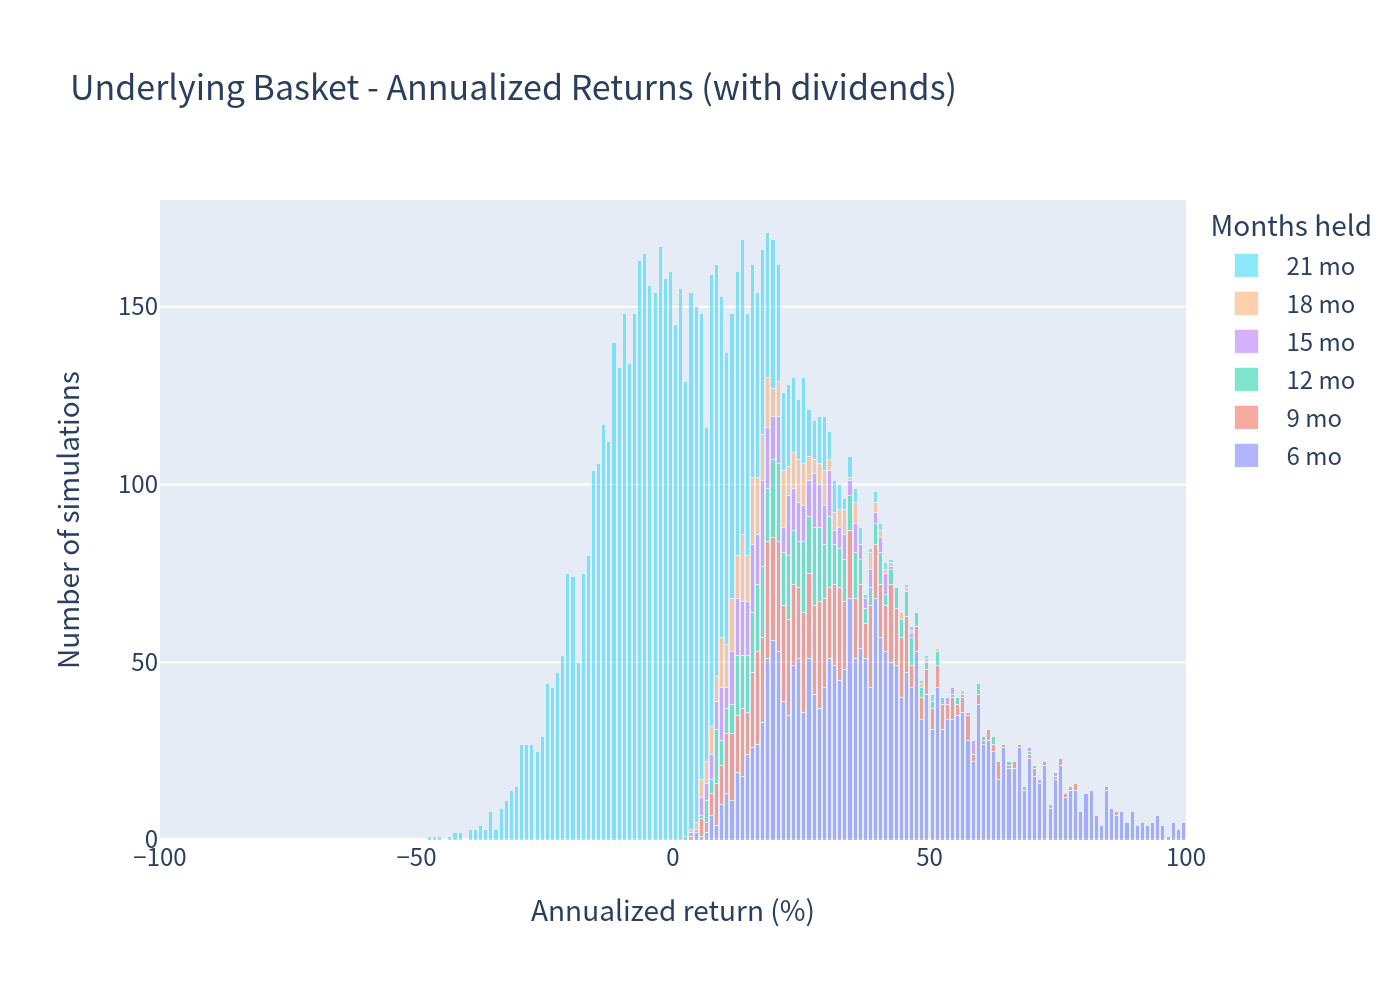
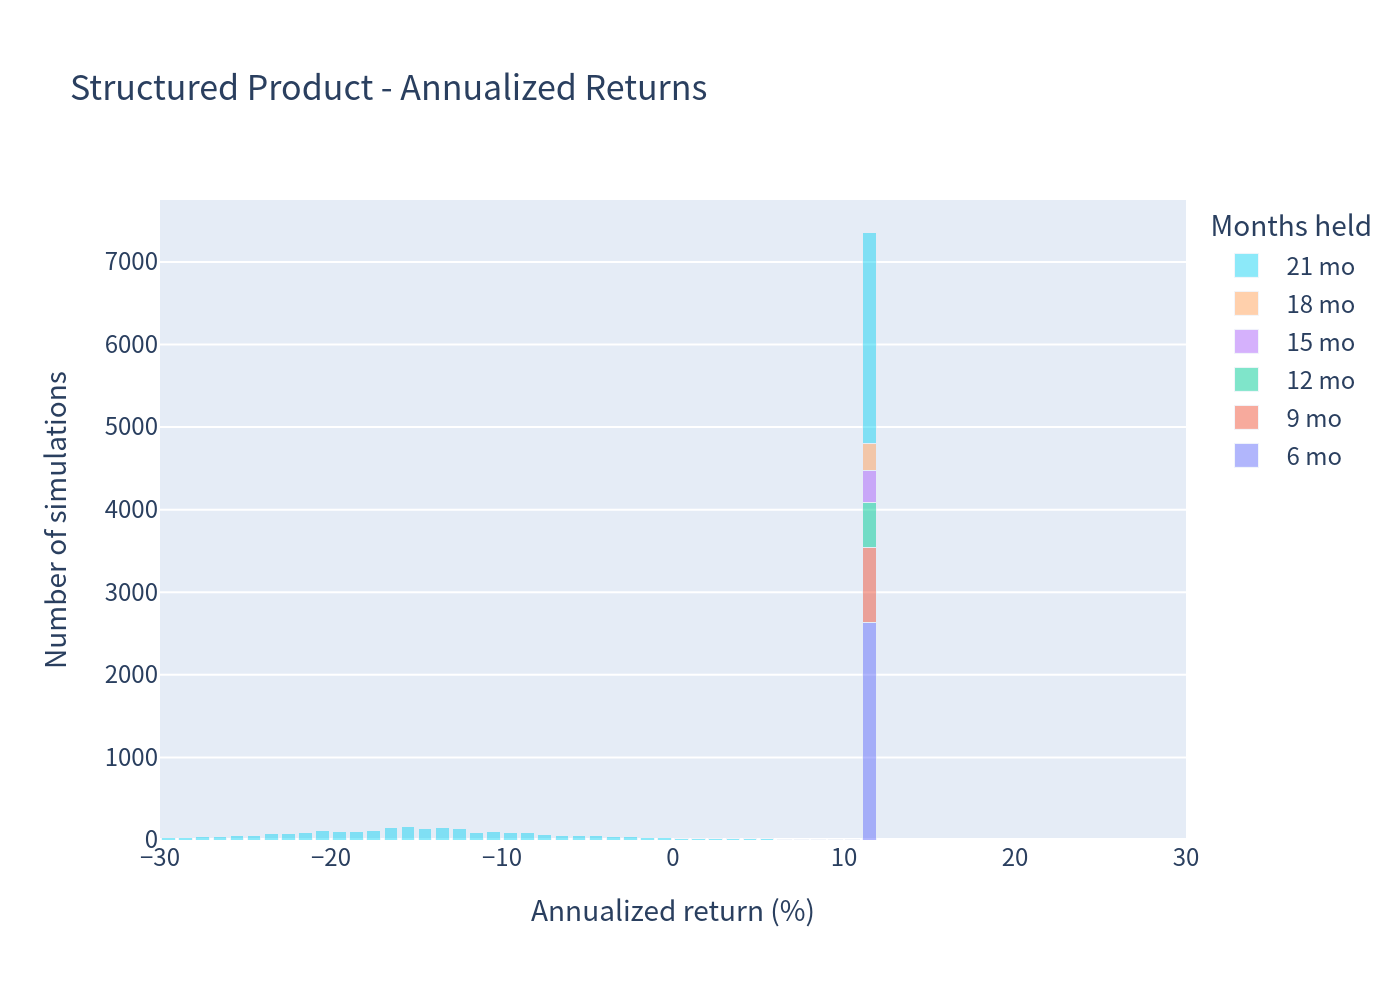
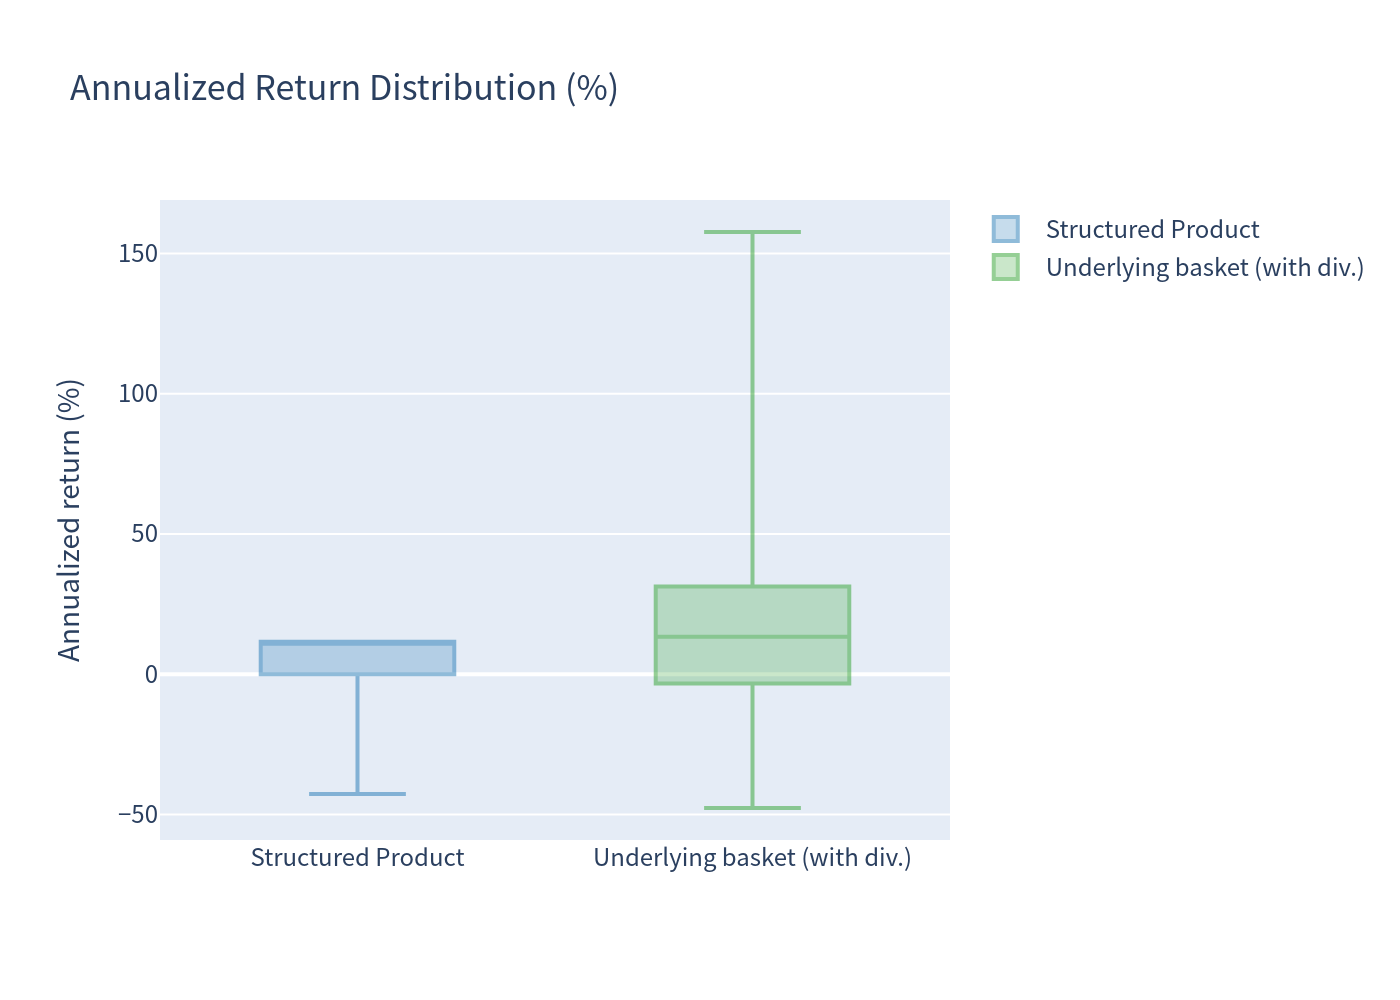
Return profile notes: the structured product's annualized returns are tightly clustered around the coupon levels — full-principal outcomes run to maturity return ~11.14% p.a. (20.30 points of coupons over 21 months), while early-called outcomes return 11.60% p.a. The median is 11.14% and the 75th–99th percentiles sit at 11.60% (the payoff cap). The worst outcomes (P1 ≈ −29.47%) occur when the barrier is breached and the worst bank share falls sharply. The underlying basket has uncapped upside (P99 ≈ +90.64%) but higher volatility.
Charts
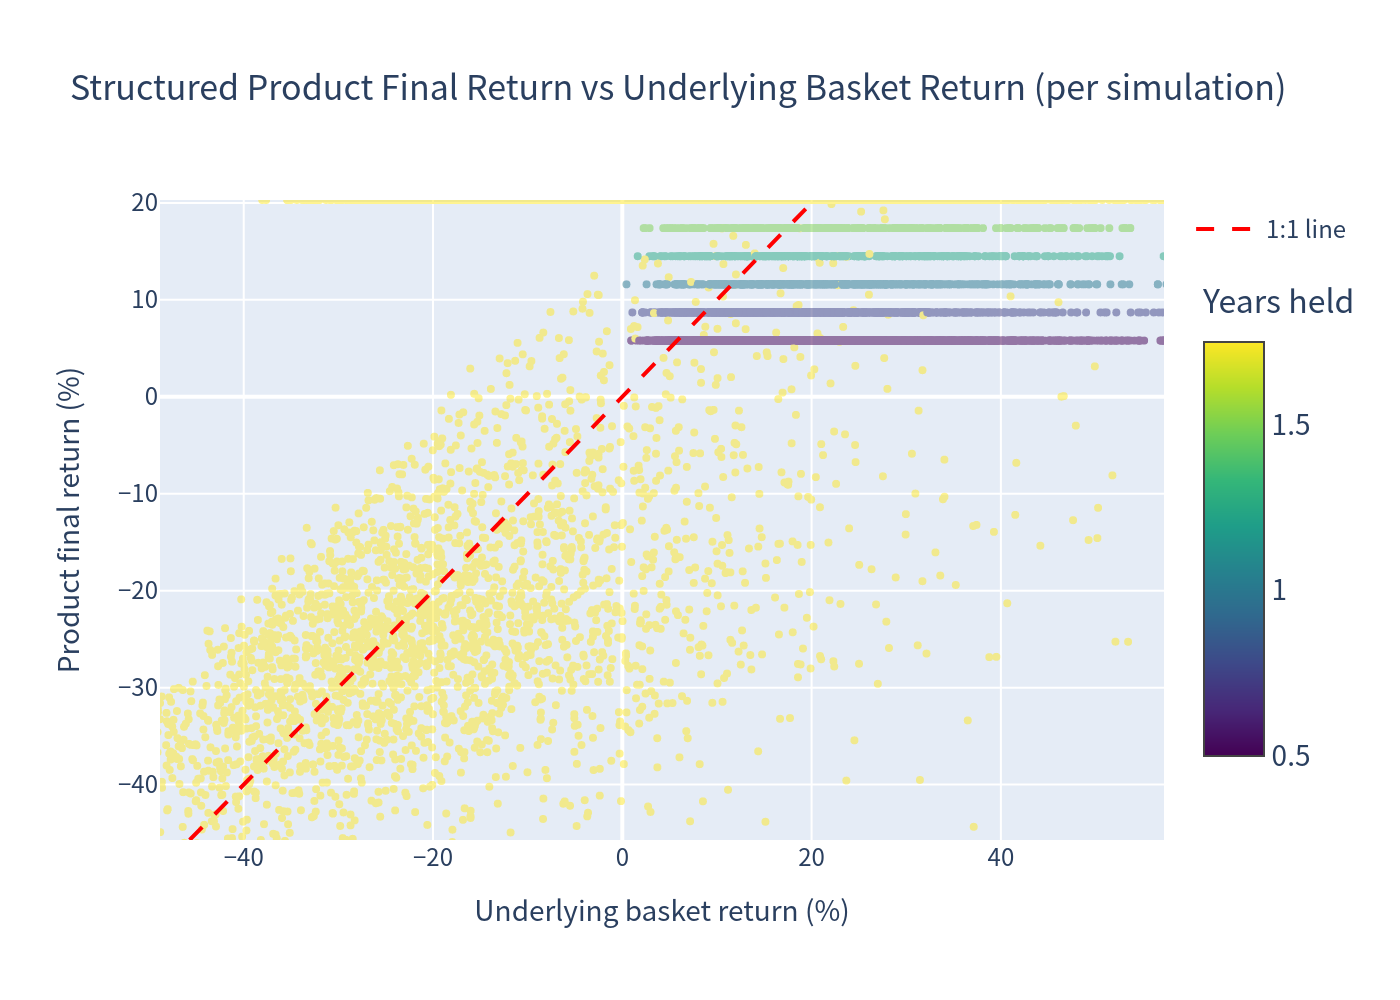
Simulation Outcomes — Product vs Underlying Return
Scatter of annualized returns: structured product versus the equal-weight underlying basket.
Annualized Return Histograms
Distribution of annualized returns for the underlying basket and for the structured product.
Scenario Probabilities
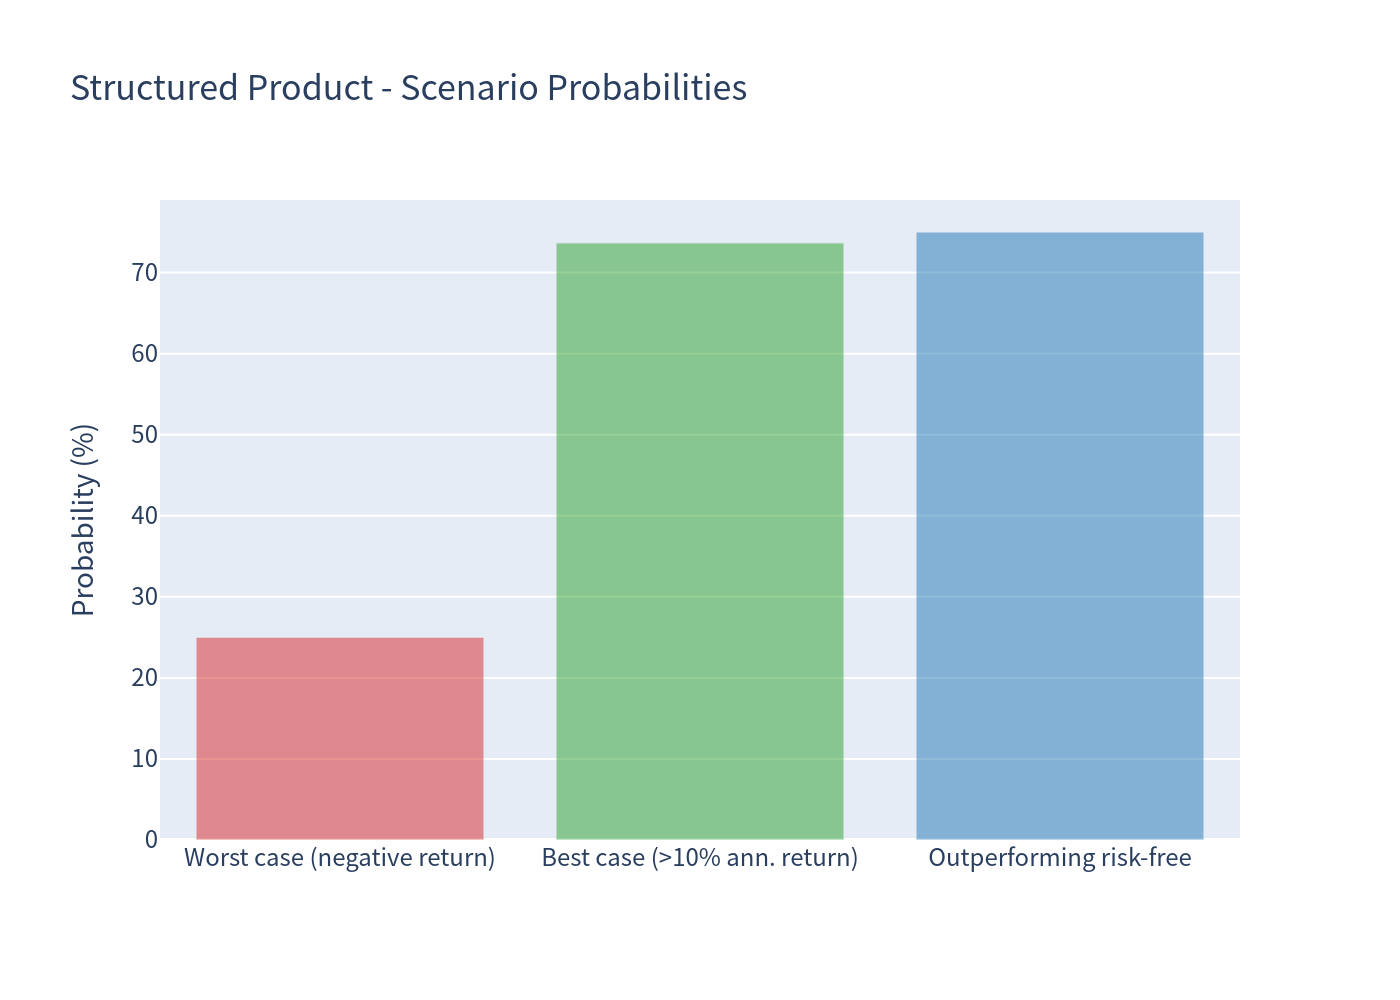
Share of simulated scenarios by outcome type (full maturity, early call, principal loss).
Risk / Return Profile
Expected return versus risk for the structured product relative to the underlying basket.
Annualized Return Distribution (Box Plot)
Box plot of the annualized return distribution, highlighting median, quartiles and tail outcomes.
Holding Period & Coupon Distributions
Distribution of realized holding periods and number of coupons received across scenarios.
Investment Commentary
Positive features
- Attractive fixed coupon: 11.60% p.a. (≈2.90% per quarter), paid unconditionally regardless of underlying performance — in 73.67% of scenarios the product's annualized return exceeds 10%.
- Conditional downside protection: principal is returned in full unless the 59% barrier is breached and the worst-performing share finishes below its initial level — only 26.39% of scenarios incur a principal loss.
- Outperforms cash: 75.01% of scenarios beat the (near-zero) Swiss franc risk-free rate; median annualized return of 11.14%.
- Diversified reference basket: worst-of structure on three large, liquid Swiss financial names.
Risks / drawbacks
- Capital loss risk: if the barrier is breached and the worst-performing share ends below its initial level, the investor receives shares worth less than par — the mean recovery in loss scenarios is 55.76 points on a 100 notional (P1 annualized return ≈ −29.47%).
- Capped upside: no participation in any underlying appreciation; returns are capped at the coupon stream.
- Issuer call feature: the product may be called from month 6, truncating the coupon stream — in strong markets (≈48% of scenarios) the product is called early and total coupon income is limited to what was received up to that point.
- Any-of barrier: the barrier is breached if any one of the three shares falls to 59%, even if the others perform well.
- Variable holding period: because the product can be called early or run to maturity, holding periods range from 6 to 21 months (expected ≈15.14 months). Annualized figures for short holding periods can look extreme; total return and holding period should be interpreted together.