
13.00% p.a. Multi Barrier Reverse Convertible on Apple, IBM & Meta Platforms
Quanto CHF · Continuous Multi-Barrier Observation · Callable · ISIN CH1555868566 · Basler Kantonalbank
Headline Simulation Results
| Metric | Structured Product | Underlying Basket (equal-weight + dividends) |
|---|---|---|
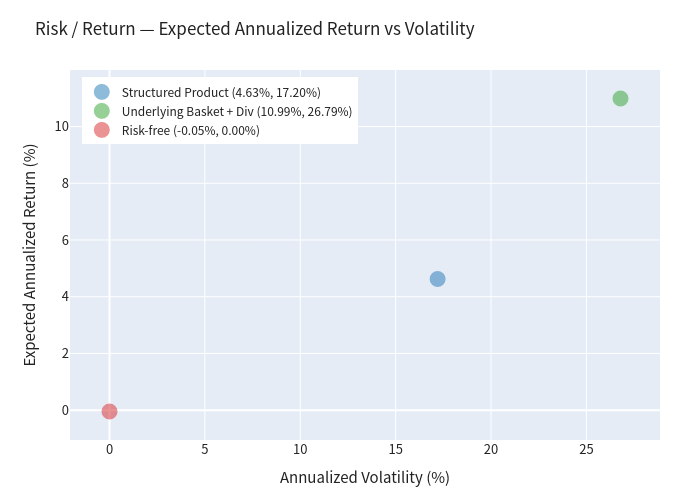
| Expected annualized return | 4.63% | 10.99% |
| Expected annualized volatility | 17.20% | 26.79% |
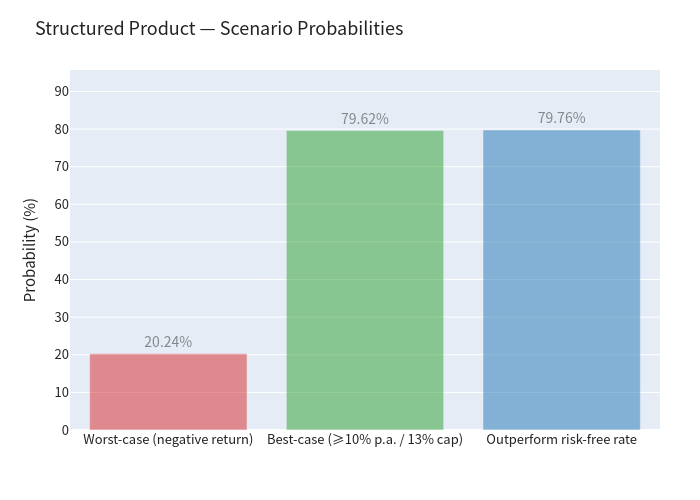
| Probability of negative return | 20.24% | 38.82% |
| 99% confidence VaR (1 year) | −45.23% | −35.86% |
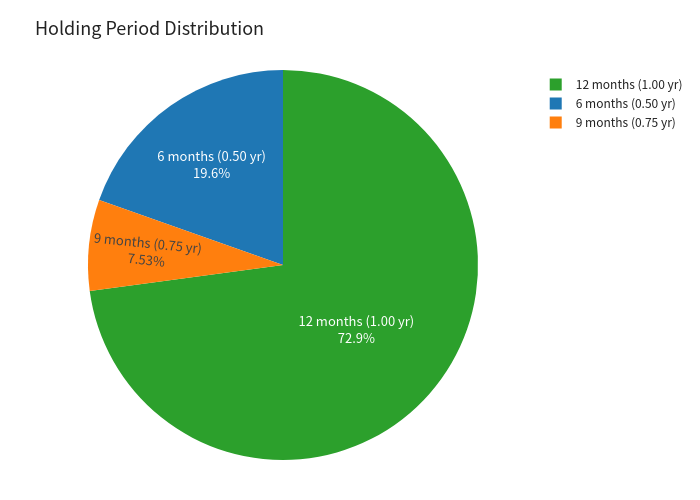
- Expected holding period: 10.60 months (~0.88 years); ~27.12% chance the note is called early.
- Probability of a positive annualized return: 79.76%.
- Probability of receiving the maximum payout (the 13.00% p.a. cap): 79.62%.
- The product pays the full coupon stream as long as it is held; over the average holding period it returns 3.11% in total (index points).
The note converts a high headline coupon into a return profile that is much less volatile than the shares (−9.6 pts of annualized vol) but gives up a large amount of upside: the expected return is roughly half that of simply holding an equal-weight basket of the three stocks. Its conditional protection works most of the time, but when it fails the loss is severe — the 1-year 99% VaR (−45.23%) is actually worse than that of the underlying basket (−35.86%).
How the Product Works (Plain Language)
You subscribe at 100% (CHF 1,000 per note) and receive a 13.00% p.a. coupon, paid quarterly as CHF 32.50 per note (18/01/27, 19/04/27, 19/07/27, 19/10/27). The coupon is paid regardless of how Apple, IBM and Meta perform.
At maturity (final fixing 11/10/2027) the redemption depends on the three shares:
- Conditional protection: if none of the three shares ever trades at or below 59% of its starting level during the whole year (barrier observed continuously), you get your full CHF 1,000 back — even if a share ends below where it started.
- If the barrier is breached (any one of the three touches 59% at any time) and the worst-performing share ends below its start level, you take that worst performer's loss 1:1 (delivery of shares, economic value = worst performance). If the worst performer is at or above its start level, you still get par.
Key mechanics
- Worst-of: the payoff looks at the weakest of the three shares — one bad share is enough to hurt you.
- Barrier at 59%: the shares must fall ~41% before protection switches off.
- Continuous observation: an intra-day dip to 59% counts, not just the close.
- Upside is capped: you never receive more than par + coupons, no matter how high the shares rally.
- Issuer call: the issuer may redeem early on 19/04/2027 or 19/07/2027; if called you receive par plus the coupon then due.
Key Statistics
| Structured Product | Underlying Basket (+ Div) | |
|---|---|---|
| Expected annualized return | 4.63% | 10.99% |
| Expected annualized volatility | 17.20% | 26.79% |
| Probability of negative return | 20.24% | 38.82% |
| 99% VaR (1 year) | −45.23% | −35.86% |
| Probability > risk-free rate | 79.76% | — |
Other simulation findings
- Barrier (kick-in) probability: ~20.7% (continuous observation; ~15.3% if only checked at month-ends).
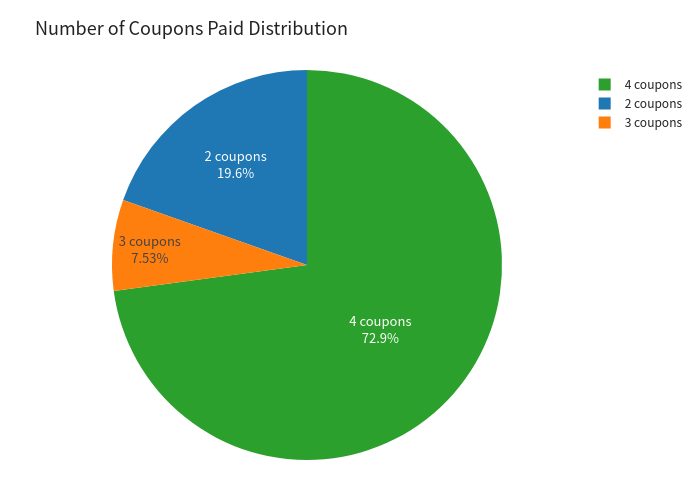
- Early-redemption (call) probability: 27.12% (19.59% at month 6, 7.53% at month 9).
- Outcome distribution is effectively two-state: ≈80% of paths land exactly on the 13.00% p.a. cap; the remaining ≈20% carry the worst performer's downside.
Charts
Simulation Outcomes — Product vs Underlying (total return)
Scatter of structured product vs underlying returns.
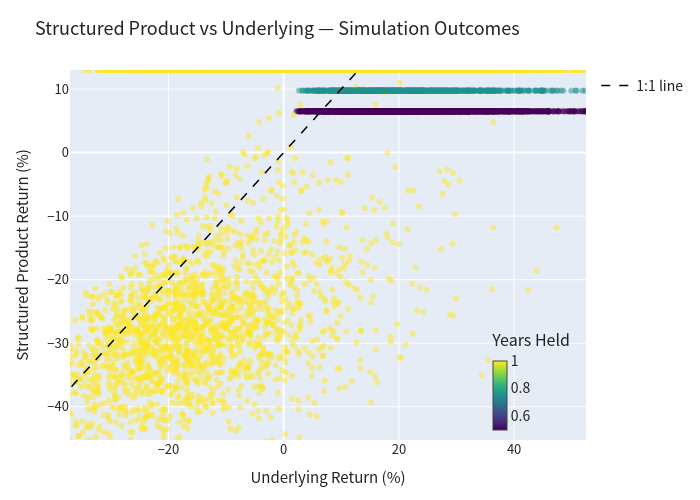
Most points sit in a flat band: when the basket is up (or only mildly down) the product is capped near +13%, while on the left the product tracks the worst-of downside, with the 1:1 line showing how the loss region behaves.
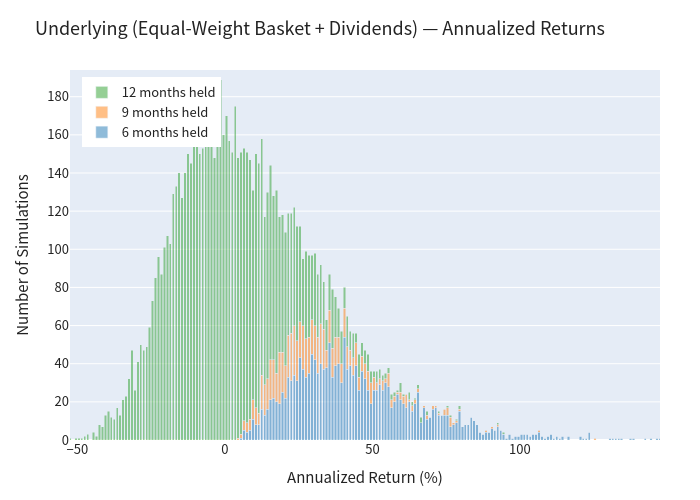
Annualized Return Histograms (stacked by holding period)
Underlying annualized return histogram.
Annualized Return Histogram — Structured Product
Structured product annualized return histogram.
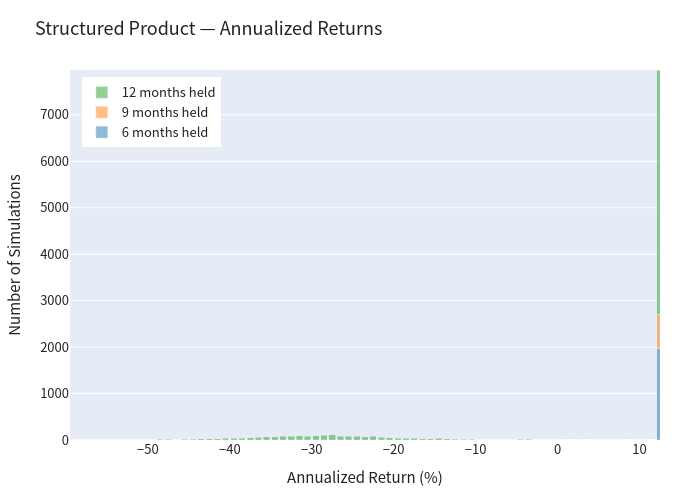
The product histogram is dominated by a single spike at the 13.00% cap (non-loss paths); the loss tail spreads down to about −60%.
Scenario Probabilities
Scenario probability bar chart.
Risk / Return Positioning
Risk return scatter.
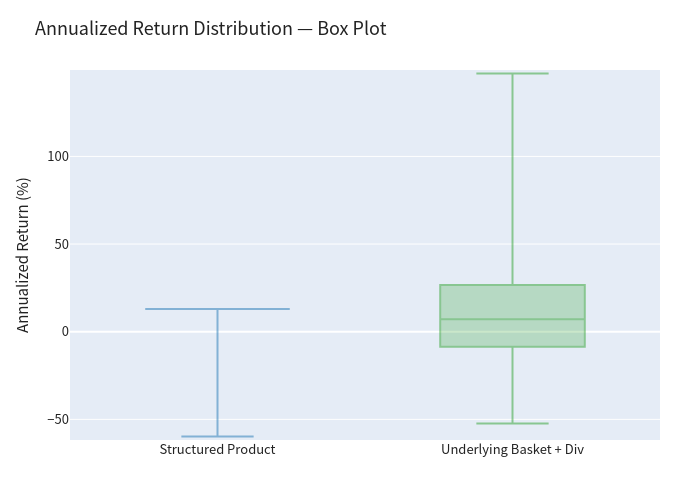
Annualized Return Distribution (Box Plot)
Box plot of annualized returns.
Holding Period and Coupon Distributions
Holding period pie chart.
Coupon Count Distribution
Coupon count pie chart.
Investment Commentary
Risks to be aware of
- Capped upside: participation is limited to the coupon; the strong historical rally of these shares is largely forgone, which is why the expected return (4.63%) is well below the basket (10.99%).
- Worst-of concentration: one weak share drives the result — all three are correlated US technology/large-cap names, so a common tech drawdown can hit the barrier in several names at once.
- Continuous barrier: intra-day touches count, so the effective breach probability is higher than a close-only test.
- Severe conditional loss: when protection switches off, the loss is taken 1:1 on the worst performer; the 1-year 99% VaR (−45.23%) is worse than the underlying basket's, reflecting a fat left tail.
- Issuer/call risk: returns are capped by the issuer's early-redemption right, and the note carries the credit risk of the issuer (Basler Kantonalbank).
This commentary is descriptive only and does not constitute investment advice or a suitability assessment.
Potential advantages