8.20% p.a. Multi Barrier Reverse Convertible (Callable) — Simulation Analysis
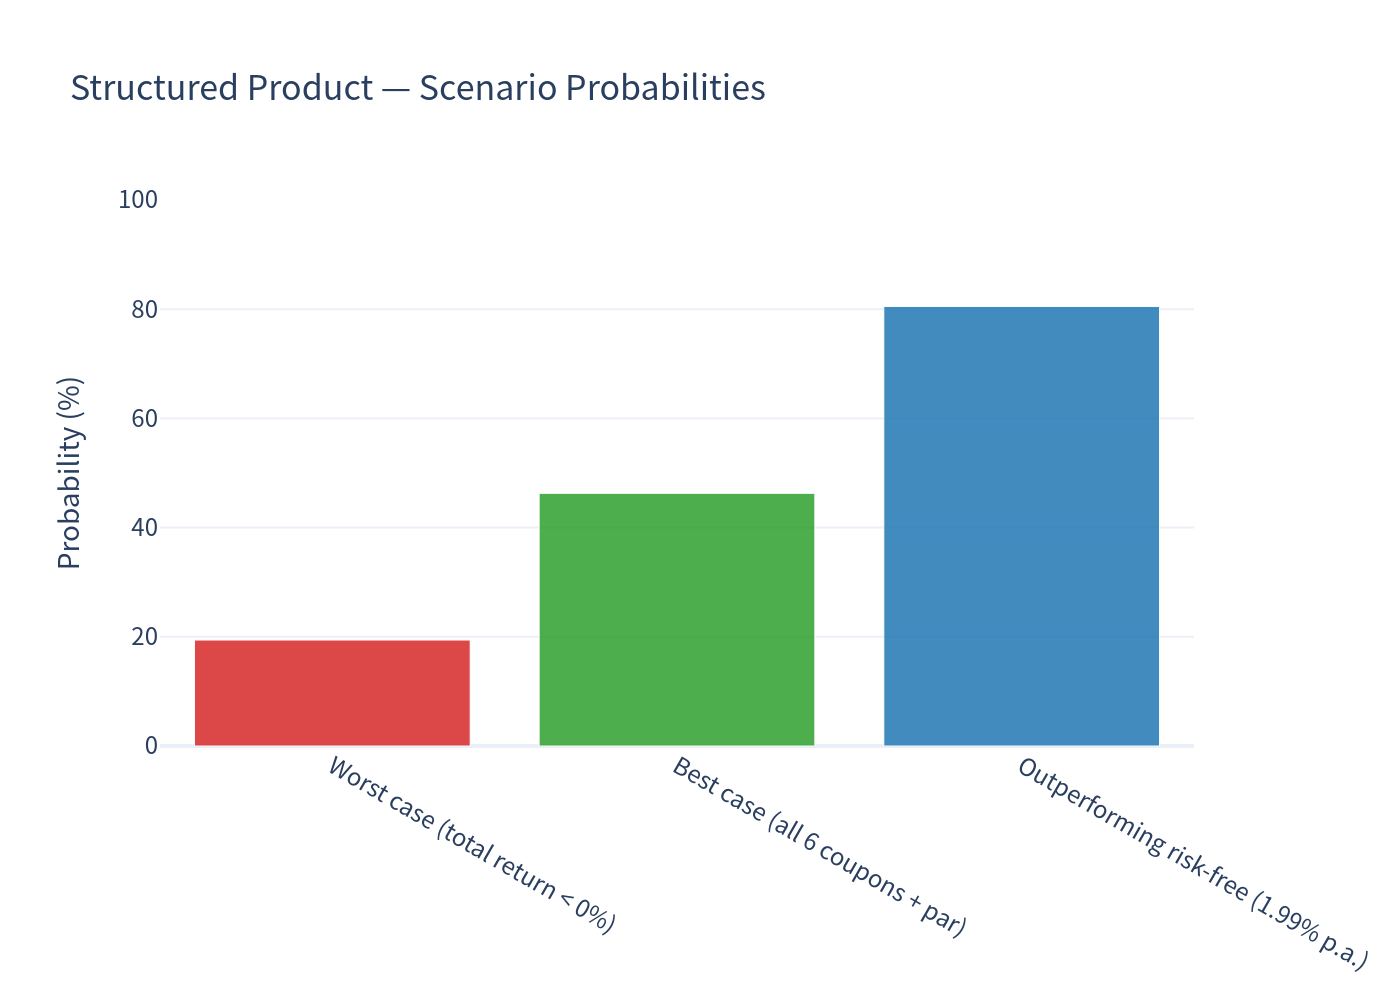
The product is expected to earn a modest premium over the ~1.99% EUR risk-free rate (it outperforms the risk-free rate in 80.51% of scenarios on a pathwise annualized basis), but it carries a fat left tail. In roughly 19.6% of scenarios the worst-performing underlying breaches the 59% barrier and finishes below its strike; the investor then receives that worst-of stock at maturity, with outcomes ranging from near break-even to steep losses (worst simulated total return: −66.30%).
Coupons are still paid in full in these scenarios, so a barrier breach alone is not a loss — the probability of an actual net loss is 19.41%. These tail outcomes dominate the expected result.
What it is: A "Multi Barrier Reverse Convertible" (SSPA type 1230) issued in EUR, linked to three German stocks — Douglas (DOU), Fielmann (FIE) and Hornbach Holding (HBH) — and callable by the Issuer. Denomination EUR 1,000 per product, ~18-month term.
- The investor receives a fixed coupon of 8.20% p.a., paid quarterly (2.05% per payment, i.e. EUR 20.50 per EUR 1,000). Over the full 18-month term this amounts to 12.30% of the notional, paid regardless of how the three shares perform.
- At maturity the capital is returned in full (100%) unless at any time during the product's life at least one of the three shares has traded at or below 59% of its starting level (the "barrier").
- If the barrier is not touched, the investor gets 100% back plus all coupons — a fully positive outcome.
- If the barrier is touched and the worst performing share finishes below its starting level, the investor receives (a value equal to) that worst share instead of 100%, converting the coupon income into a capital loss. If the worst share still finishes at or above its starting level, capital is again returned in full.
- The Issuer may redeem the product early (at 100% plus the coupon then due) on quarterly dates from month 6 onwards — in this analysis the call is assumed to be exercised when all three shares trade at or above their starting level (see assumption note).
- Upside is capped at the coupons; there is no participation in rising share prices.
| Metric (annualized) | Structured Product | Underlying Basket (w/ div) | Risk-free (EUR) |
|---|---|---|---|
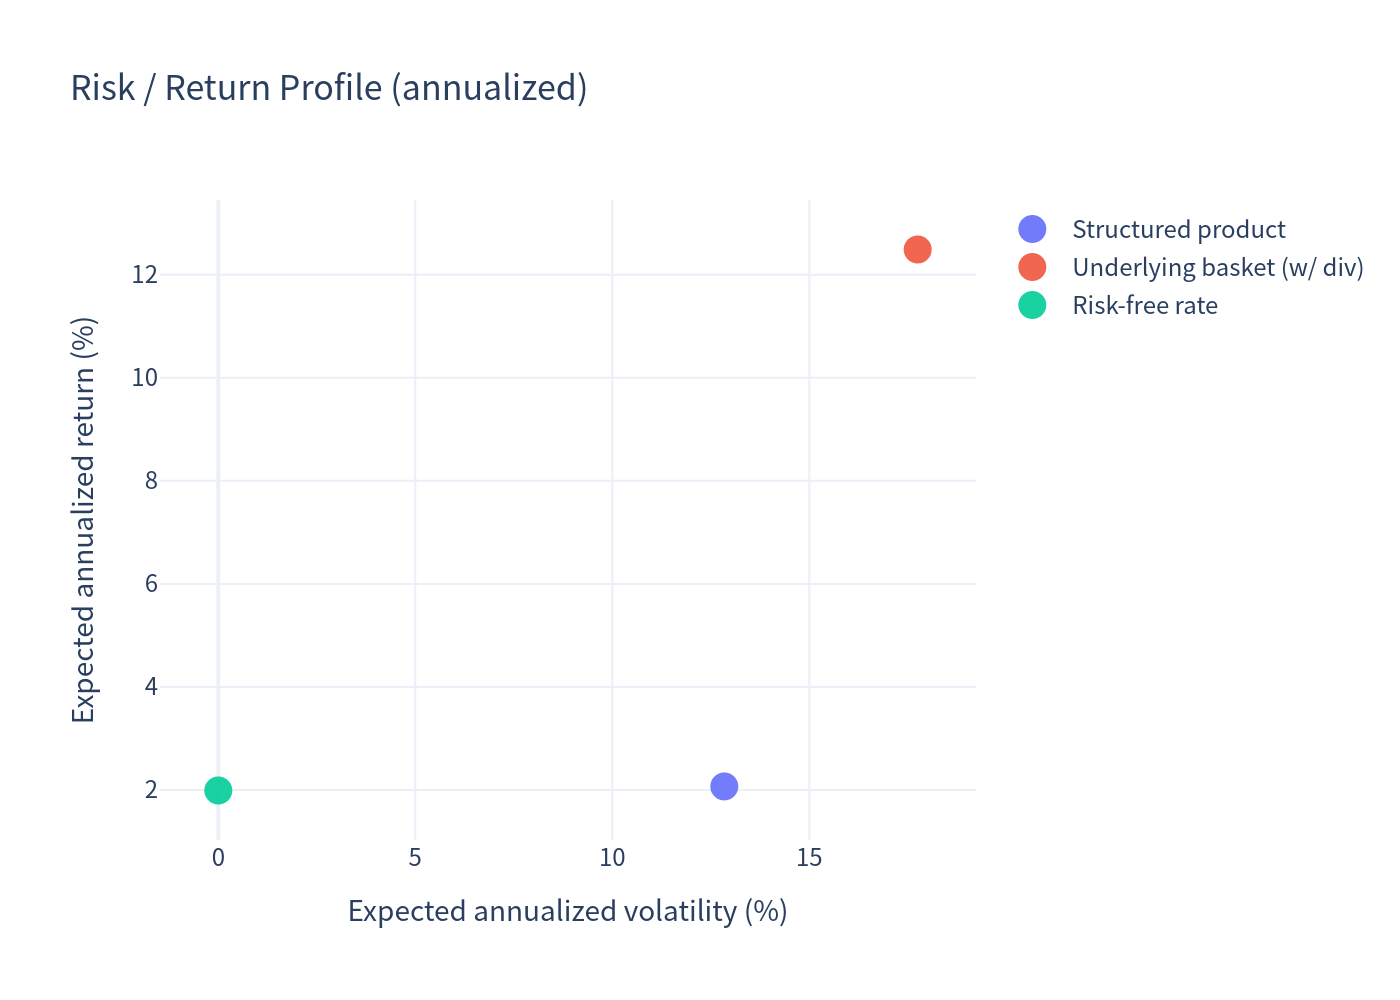
| Expected return | 2.07% | 12.49% | 1.99% |
| Volatility | 12.84% | 17.75% | 0.00% |
| Probability of loss | 19.41% | 25.52% | 0.00% |
| 99% VaR (1 year) | −37.82% | −19.30% | 1.99% |
Benchmark = equal-weight basket of the three underlyings (Douglas, Fielmann, Hornbach), including reinvested dividends, measured over the same holding period as the product in each simulation.
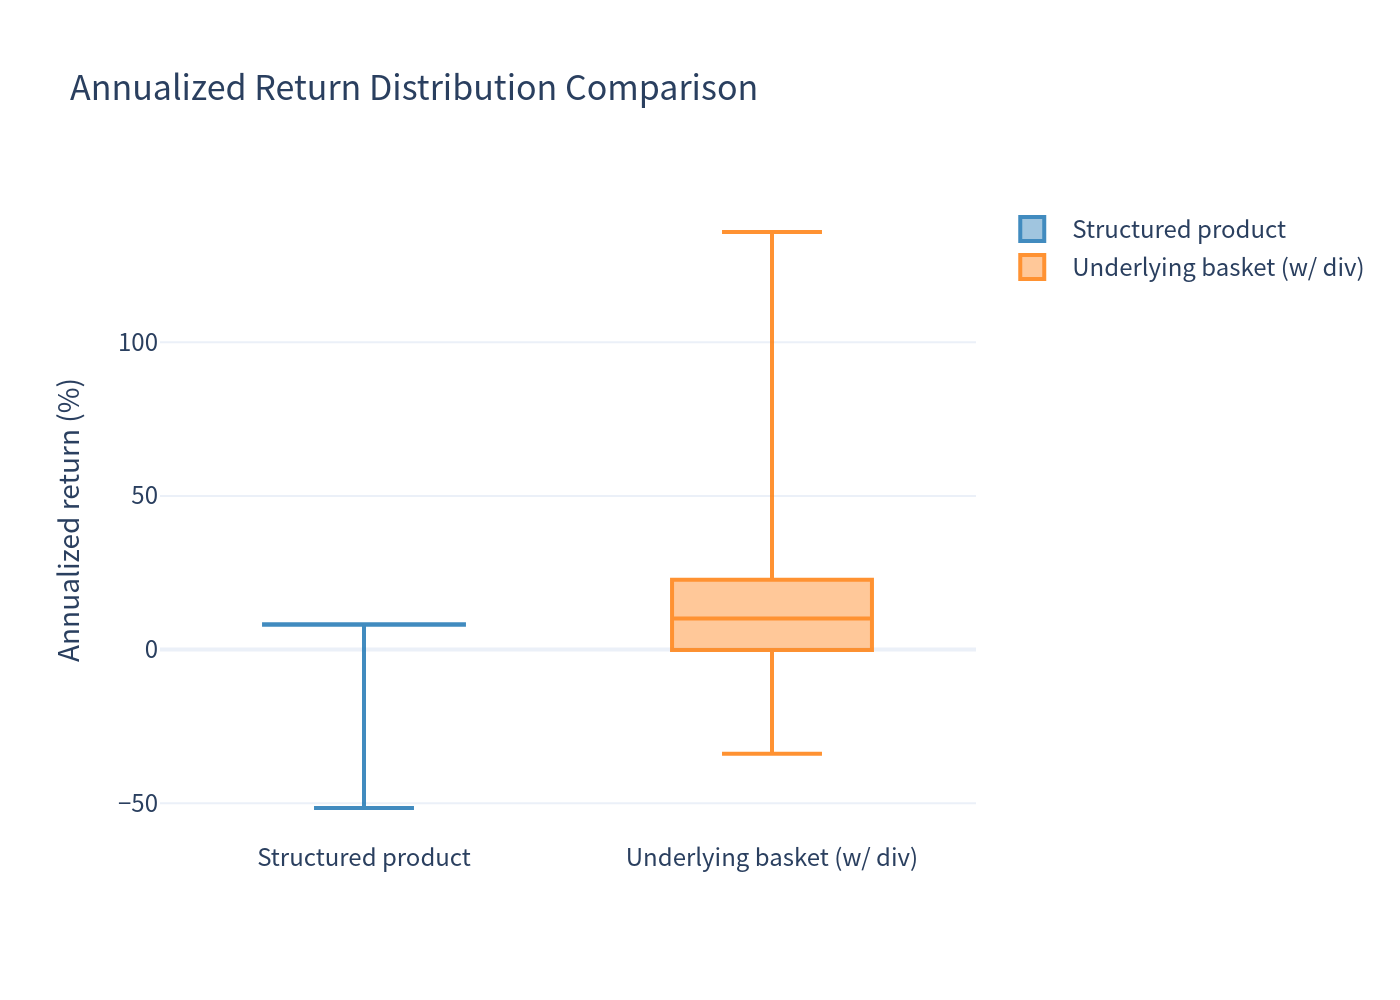
Reading the numbers: the equal-weight basket shows a higher average return and a less negative 99% VaR than the structured product. This reflects the product's worst-of construction — it concentrates downside into the single worst performer while giving up upside. In exchange, the product converts the frequent small losses of the volatile basket into a coupon stream: the probability of any loss is lower for the product (19.41% vs 25.52%) and its median outcome is a tidy ~8% annualized. The product's risk sits almost entirely in the tail of the barrier-delivery scenarios.
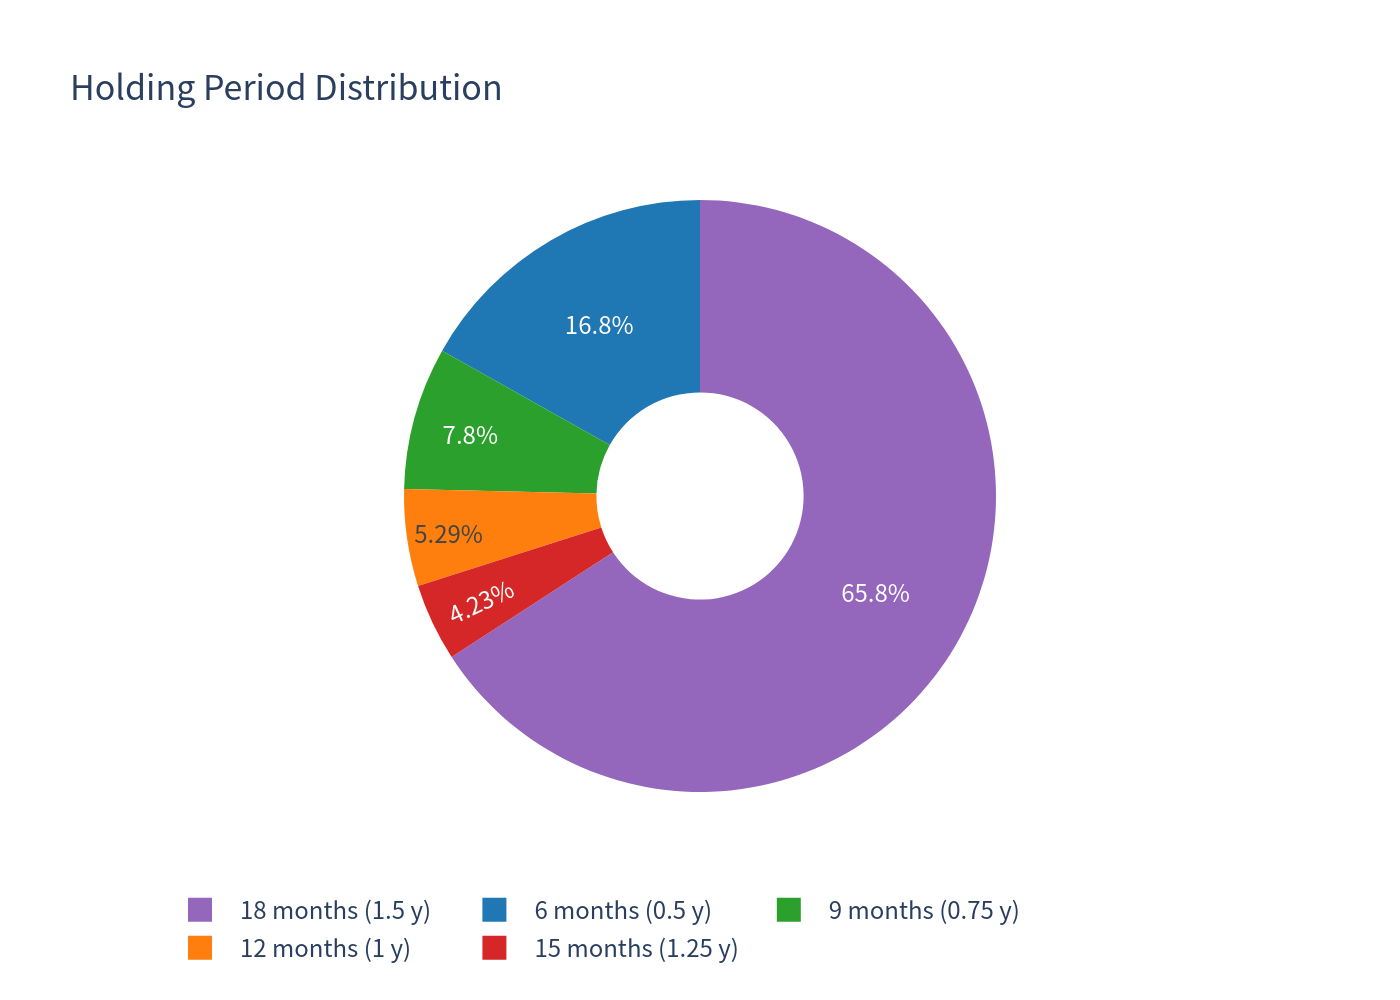
Note on holding period: because the product may be called early (34.15% of scenarios end before maturity, at months 6–15), per-simulation returns are annualized from short horizons; the average total return of 1.52% should be read together with the average holding period of 14.83 months and the mean annualized return of 2.07%.
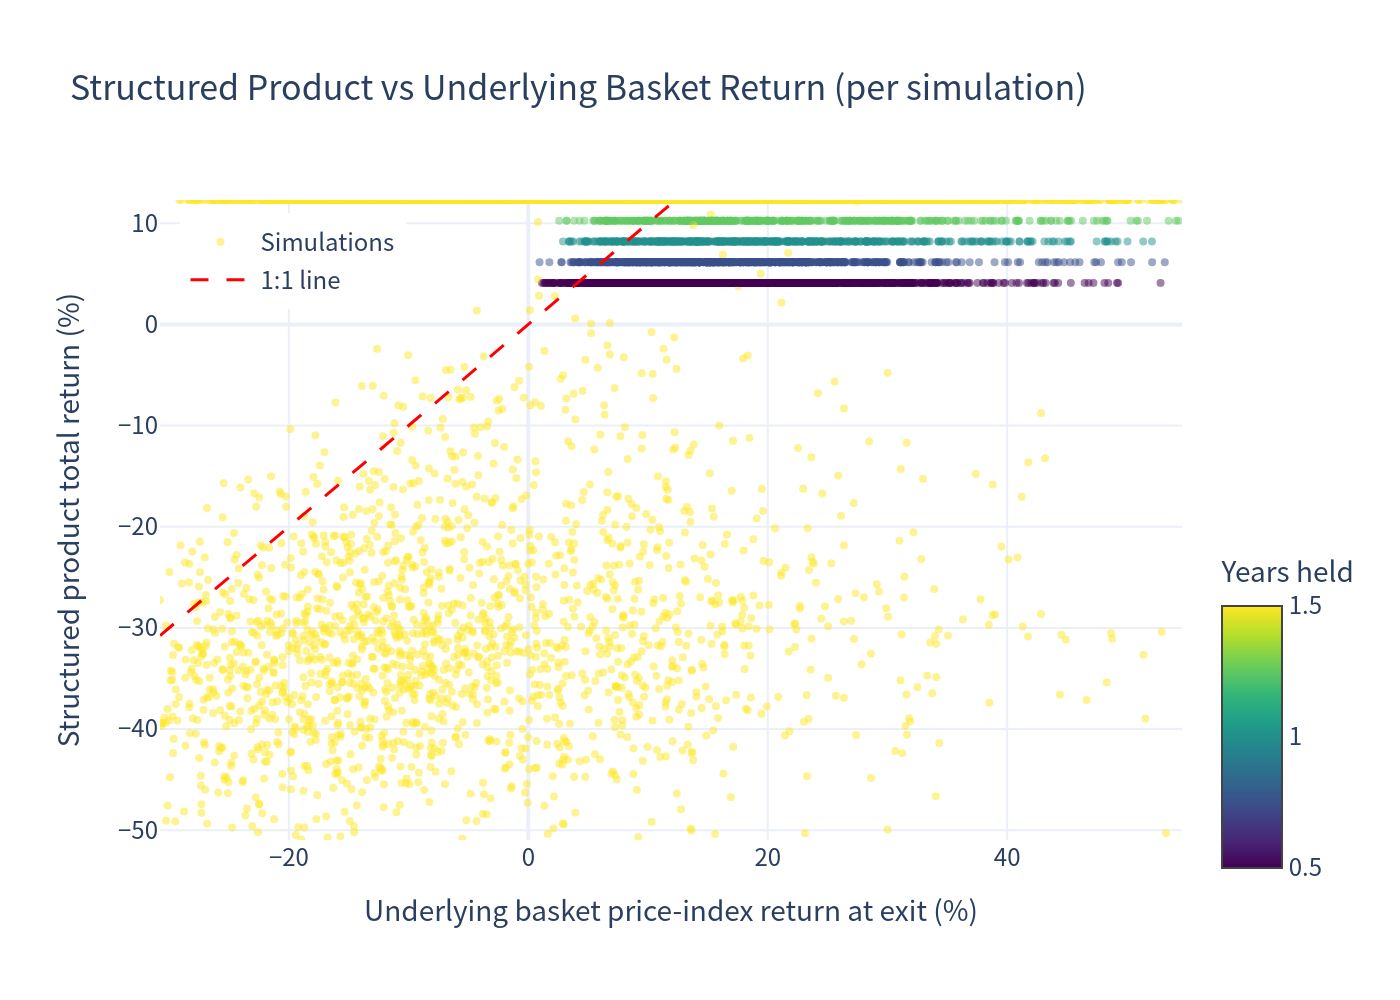
Simulation outcomes: product return vs underlying basket return
Each dot is one simulated path; the colour shows how long the product was held. The red dashed line is the 1:1 line.
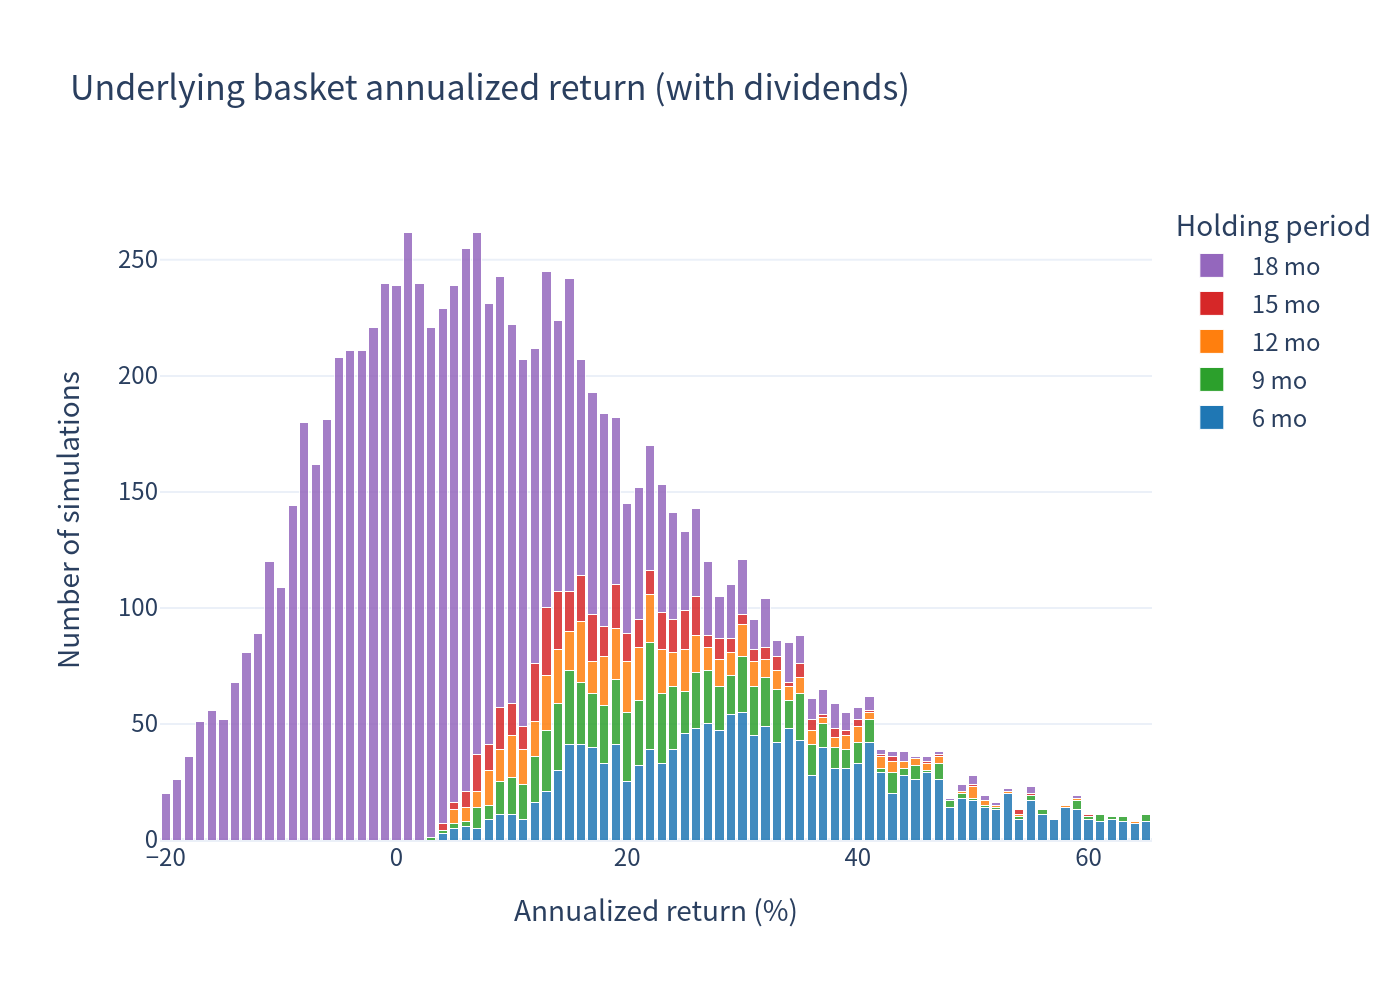
Distribution of annualized returns — underlying basket (with dividends)
Bars are 1% bins, coloured by holding period of the corresponding simulation.
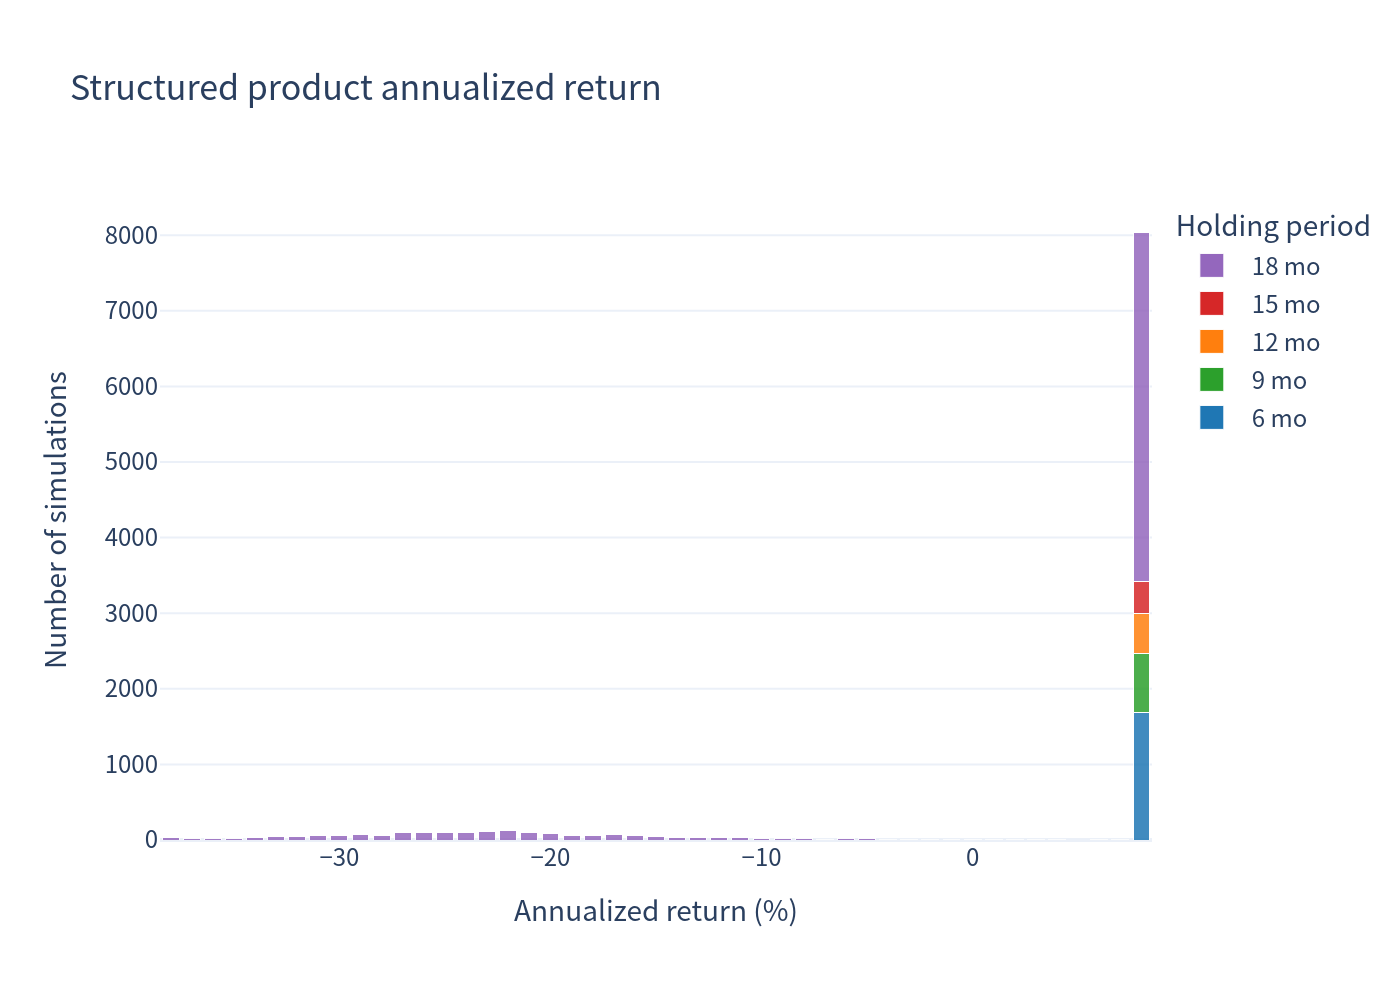
Distribution of annualized returns — structured product
Bars are 1% bins, coloured by holding period. Note the mass near +8% (coupon-like outcomes) and the long left tail from barrier-delivery scenarios.
Scenario probabilities
Worst case = negative total return; best case = all six coupons received plus full capital returned; and outperforming the risk-free rate.
Risk / return profile
Expected annualized return vs volatility for the product, the underlying basket and the risk-free rate.
Box plot — annualized return comparison
Holding period distribution
The product can end at months 6, 9, 12, 15 (Issuer call) or 18 (maturity).
Number of coupons received
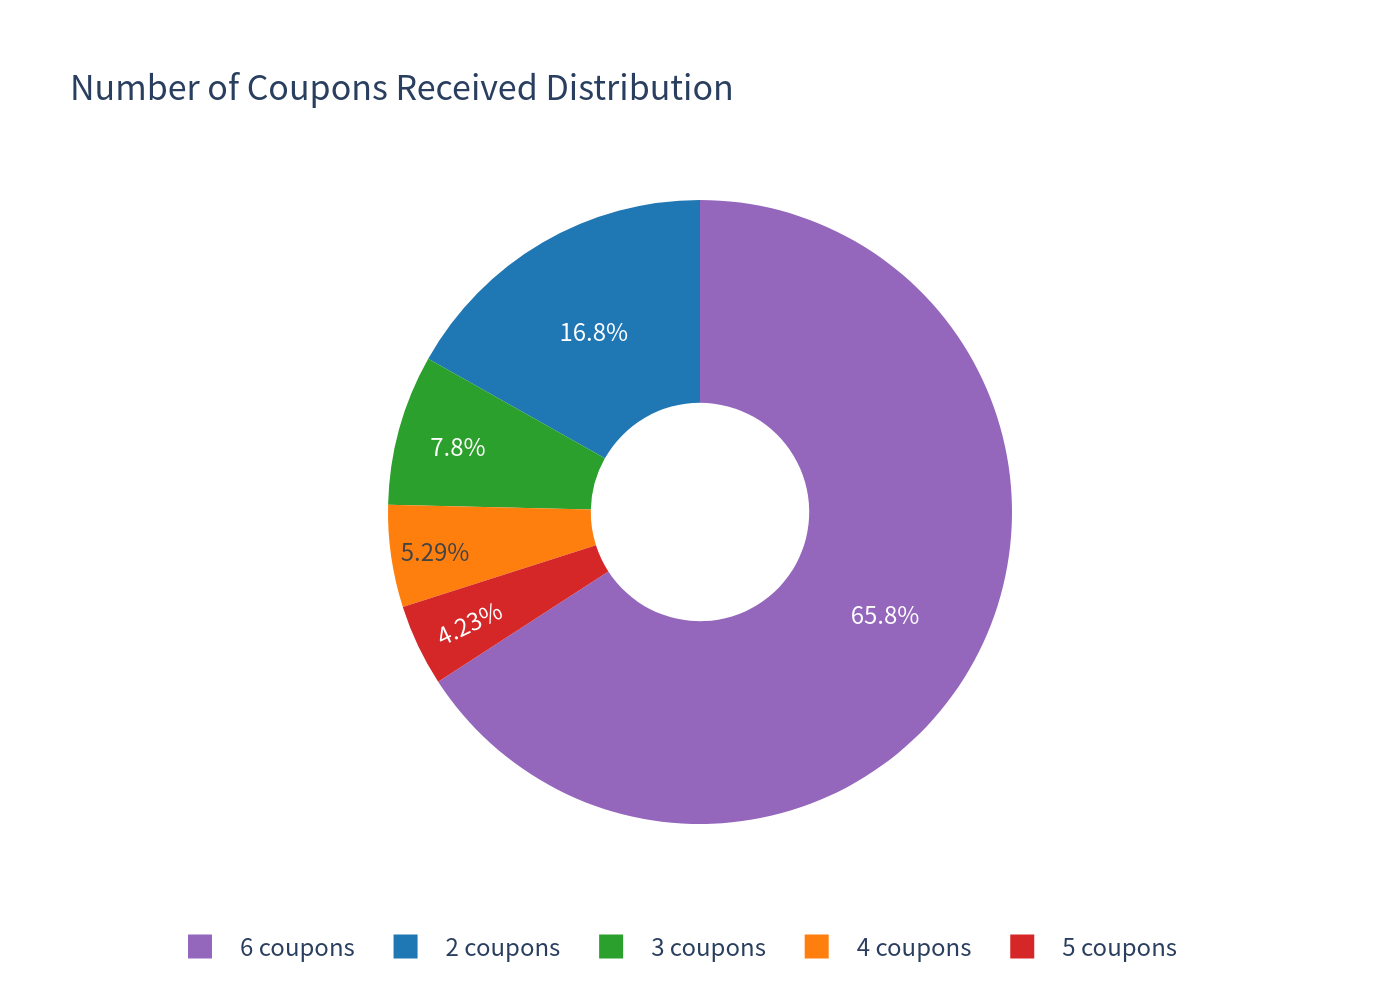
- Coupon is paid regardless of share performance — 8.20% p.a. paid quarterly; even in barrier-loss scenarios all coupons accrued up to the end are still paid (mean 4.94 coupons, ~10.14 points of the 100 notional, across all simulations).
- Deep conditional protection: the barrier at 59% (41% below initial) with a worst-of trigger is breached in only ~21% of simulated paths (monthly-monitoring approximation), and even then capital is only impaired if the worst share finishes below its start.
- High probability of a positive outcome: ~80.6% of scenarios deliver a positive return; ~46% produce the maximum outcome (all coupons + full capital), and the median annualized return is 8.04%.
- Expected return is positive and sits modestly above the EUR risk-free rate.
- Worst-of tail risk: losses, when they occur, are severe — the product's 99% VaR (−37.82%) is materially worse than the diversified basket's (−19.30%), because the investor absorbs the decline of the single worst stock rather than an average. Losses only materialise if the worst performer breaches the 59% barrier and ends below ~87.7% of its start (net of the 12.30% coupons); a breach by itself is not a loss.
- Capped upside: no participation in positive share performance; the best possible outcome is the coupon stream.
- Issuer call: under the modelling assumption, the Issuer redeems early on strong paths, which shortens the coupon stream. A held-to-maturity (no-call) sensitivity shows a mean total return of 3.68% over the full 18-month term (mean pathwise annualized ≈ 2.02%), versus 1.52% mean total return with the call (mean pathwise annualized 2.07%) — the difference reflects the shortened holding periods under the call, not a materially different annualized expectation.
- Issuer credit risk (Leonteq Securities AG) applies to all payments.