tokenengine.ai
Structured Product Evaluator |
info@tokenengine.ai
Structured Product Analysis Report
Headline Simulation Results
2.66%
Expected Annualized Return (Product)
19.05%
Probability of Negative Return
-28.96%
99% Confidence VaR (1 year)
| Metric | Structured Product | Underlying Benchmark |
|---|---|---|
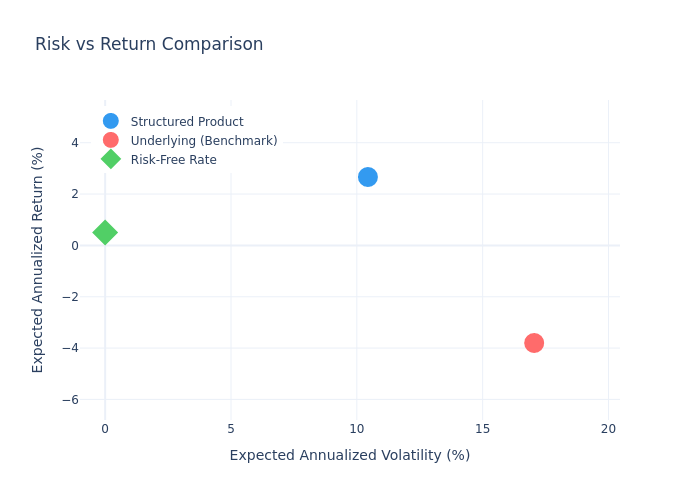
| Expected Annualized Return | 2.66% | -3.80% |
| Expected Annualized Volatility | 10.44% | 17.05% |
| Probability of Negative Return | 19.05% | 54.93% |
| 99% Confidence VaR (1 year) | -28.96% | -38.03% |
| Expected Holding Period | 1.66 years | — |
| Expected Total Return (over holding period) | 3.66% | -10.17% |
Basic Product Information
How It Works
This is a Barrier Reverse Convertible linked to a basket of three Swiss stocks: ABB Ltd, Alcon Inc, and UBS Group AG.
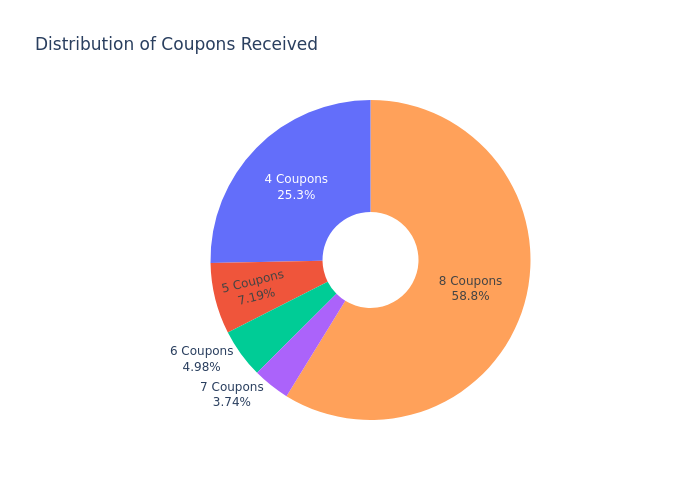
- Coupon Payments: The product pays a fixed quarterly coupon of CHF 19.25 (1.925% per quarter, 7.70% p.a.) regardless of the underlying performance.
- Barrier Protection: A 55% barrier is observed continuously. If none of the three underlyings ever trades at or below 55% of its initial level during the observation period, the investor receives full notional back at maturity.
- Downside Risk: If the barrier is breached and the worst-performing underlying is below its initial level at maturity, the investor receives a number of shares of the worst performer, equivalent to the underlying's final performance.
- Issuer Call: The issuer has the right to call (early redeem) the product quarterly starting after 12 months. If called, the investor receives full notional plus the coupon for that period.
| Parameter | Value |
|---|---|
| Product Type | Multi Barrier Reverse Convertible (SSPA 1230) |
| Underlyings | ABB, Alcon, UBS (worst-of payoff) |
| Currency | CHF |
| Coupon Rate | 7.70% p.a. (paid quarterly) |
| Barrier Level | 55% of initial (continuous observation) |
| Strike Level | 100% of initial |
| Tenor | 2 years |
| Issuer Call | Quarterly from month 12 onwards |
Charts
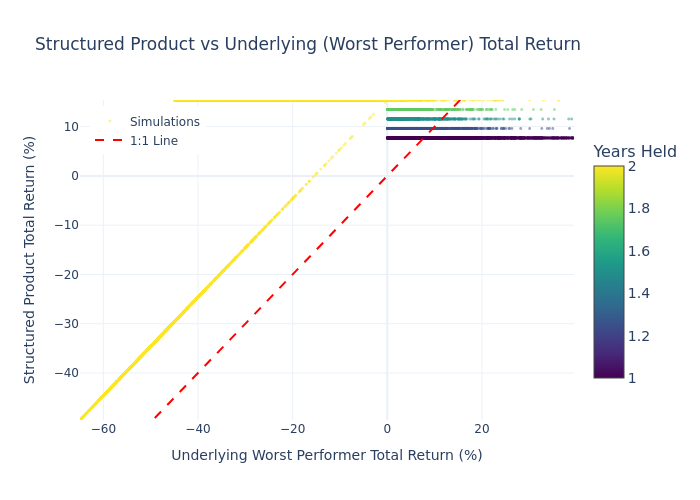
Scatter Plot: Product vs Underlying Returns
Each dot represents one simulation. The red dashed line is the 1:1 line. Simulations above the line mean the product outperformed the worst-performing underlying.
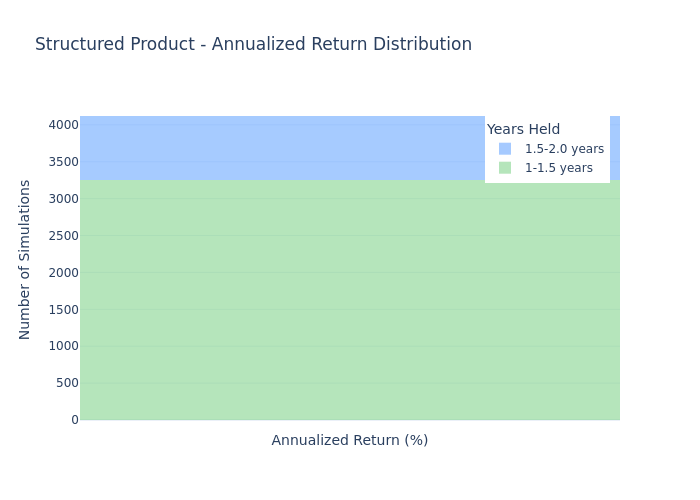
Annualized Return Distribution – Structured Product
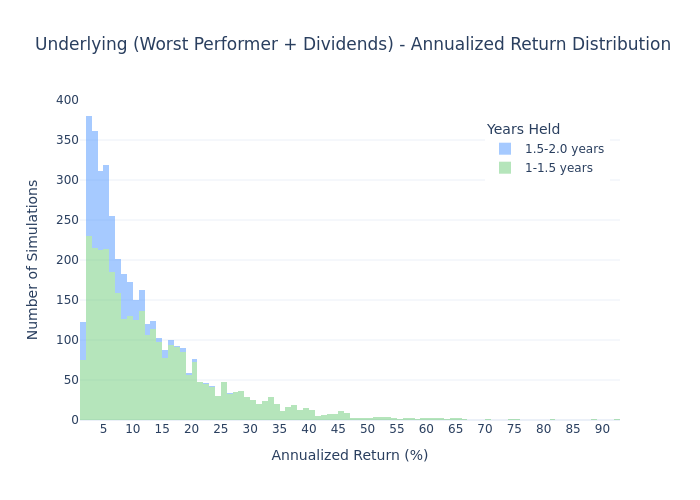
Annualized Return Distribution – Underlying (Worst Performer + Dividends)
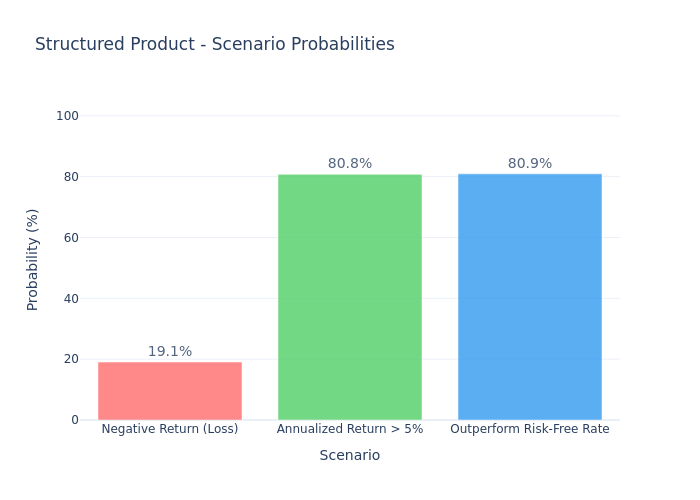
Scenario Probability Bar Chart
Risk vs Return Comparison
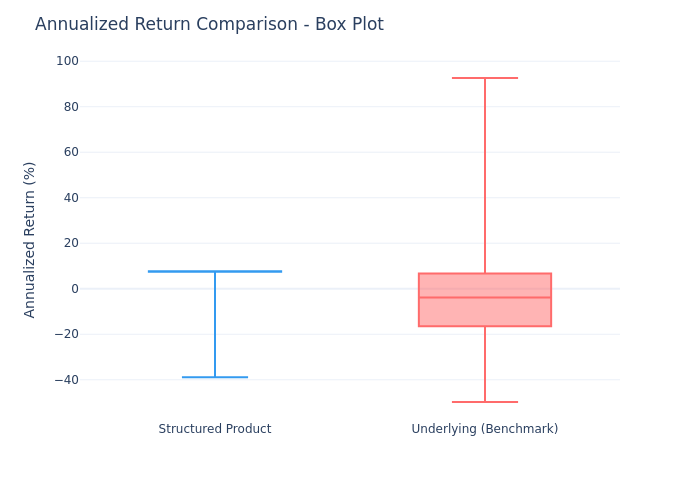
Box Plot Comparison
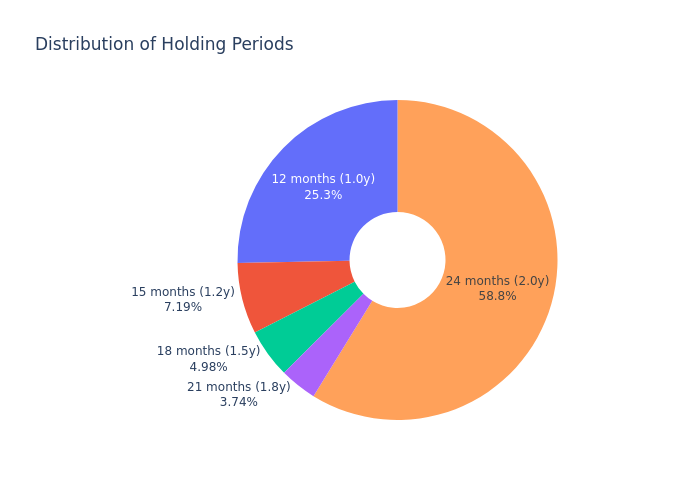
Holding Period Distribution
Distribution of Coupons Received
Key Statistics
Structured Product
| Statistic | Value |
|---|---|
| Expected Annualized Return | 2.66% |
| Median Annualized Return | 7.42% |
| Expected Annualized Volatility | 10.44% |
| Probability of Negative Return | 19.05% |
| 99% Confidence VaR (1 year) | -28.96% |
| Expected Total Return (over holding) | 3.66% |
| Expected Holding Period | 19.91 months |
| Probability of Early Redemption | 41.20% |
| Probability of Barrier Event | 19.79% |
Underlying Benchmark (Worst Performer + Dividends)
| Statistic | Value |
|---|---|
| Expected Annualized Return | -3.80% |
| Median Annualized Return | -3.89% |
| Expected Annualized Volatility | 17.05% |
| Probability of Negative Return | 54.93% |
| 99% Confidence VaR (1 year) | -38.03% |
Investment Commentary
Pros
- Attractive coupon: The 7.70% p.a. quarterly coupon is significantly higher than current CHF risk-free rates.
- Downside protection through barrier: The 55% barrier provides a substantial cushion before capital is at risk.
- Positive expected return: The structured product has a positive expected annualized return (2.66%) compared to the negative expected return of the worst-performing underlying (-3.80%).
- Reduced volatility: The product's annualized volatility (10.44%) is significantly lower than the underlying benchmark (17.05%), thanks to the coupon buffer and barrier protection.
- Low probability of loss: Only 19.05% of simulations resulted in a negative annualized return.
Cons
- Upside capped: Maximum annualized return is capped at 7.70% (the coupon rate), regardless of how well the underlyings perform.
- Worst-of structure: The product is exposed to the worst-performing of three stocks, which increases the probability of a barrier event and loss.
- Issuer call risk: The issuer can call the product early (41.20% probability), which would limit total coupon income.
- Credit risk: The product is unsecured and subject to the credit risk of the issuer (Leonteq Securities AG) and guarantor (Aargauische Kantonalbank).