
Morgan Stanley SPXFP Callable Jump Notes due September 5, 2031 — Simulation Report
Headline Results
Basic Product Information
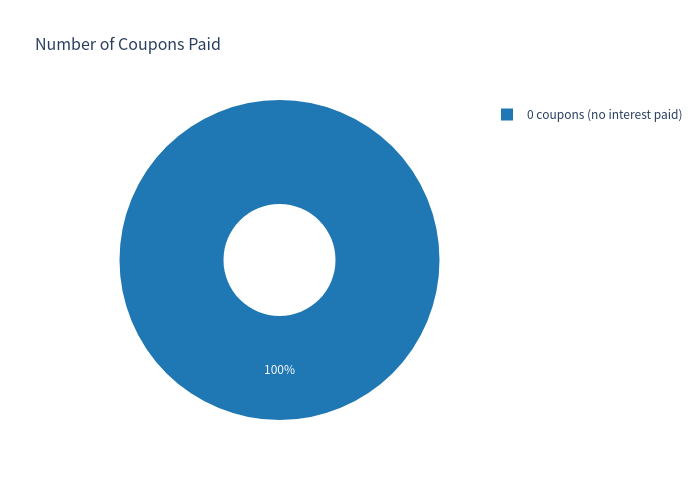
Morgan Stanley SPXFP Callable Jump Notes (CUSIP 61781DKH0, USD) reference a single underlier — the S&P 500® Futures Excess Return Index (SPXFP). The notes do not pay interest (no coupons).
- You invest $1,000 per note. At maturity the notes pay at least $1,000 — your principal is protected regardless of how far the underlier falls.
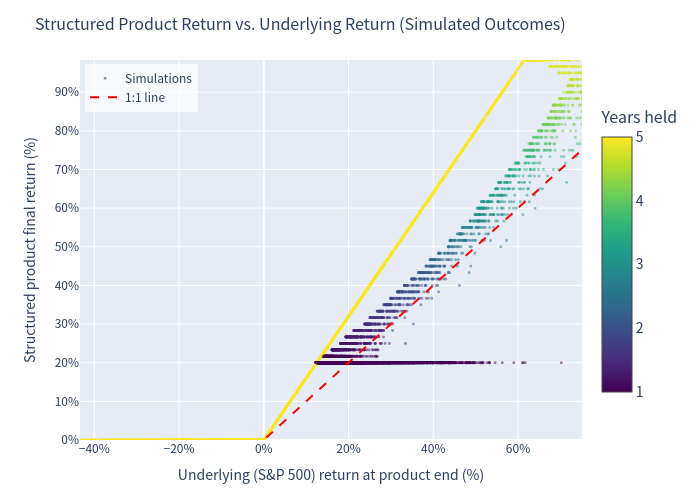
- If the underlier is up at maturity (and the notes have not been redeemed early), you receive $1,000 + 160% × the underlier gain (e.g., +20% underlier → $1,320; +60% → $1,960). Upside participation is not capped.
- Starting one year after issue (September 2027), Morgan Stanley may redeem the notes early on any of 48 monthly dates, in whole, when its risk-neutral valuation model determines that redeeming is economically rational. If called, you receive a preset amount that increases each month: $1,200 (Sep 2027) rising by $16.67/month to $1,983.33 (Aug 2031) — i.e., +20% to +98% cumulative.
- In practice the issuer tends to call early in rising markets (locking in your fixed return), while in weak markets the notes run to maturity and you receive principal protection plus any recovered upside.
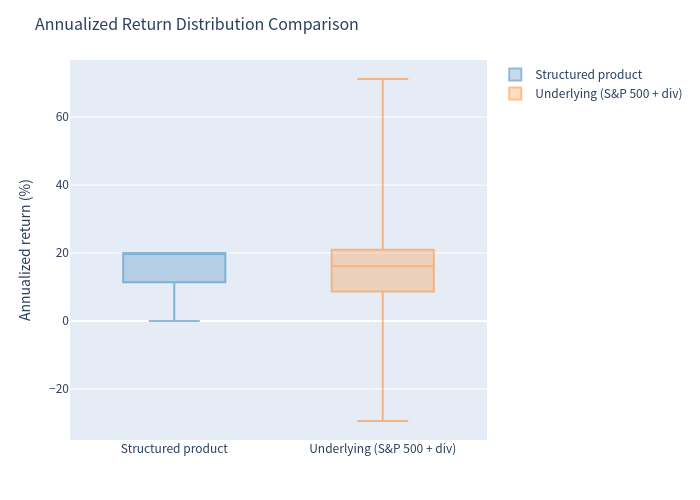
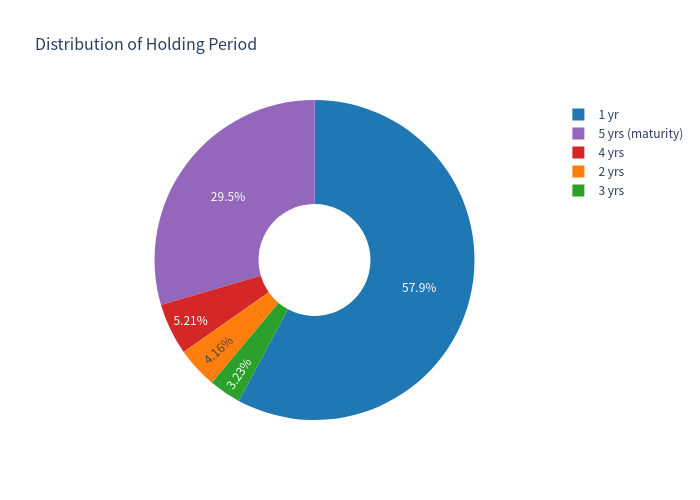
~58% of simulations are called within the first two years, ~12% between years 2–4, and ~30% run to maturity. In the simulated distribution the maximum annualized return is 20% — achieved when the notes are called at the first redemption date (+20% in one year). Although the maturity participation is contractually uncapped, in the simulation only weaker-underlier paths reach maturity, so none of the held-to-maturity payoffs exceeded a 20% annualized return.
Key Statistics (annualized)
| Metric | Structured Product | Underlying benchmark (S&P 500 total return, incl. dividends) |
|---|---|---|
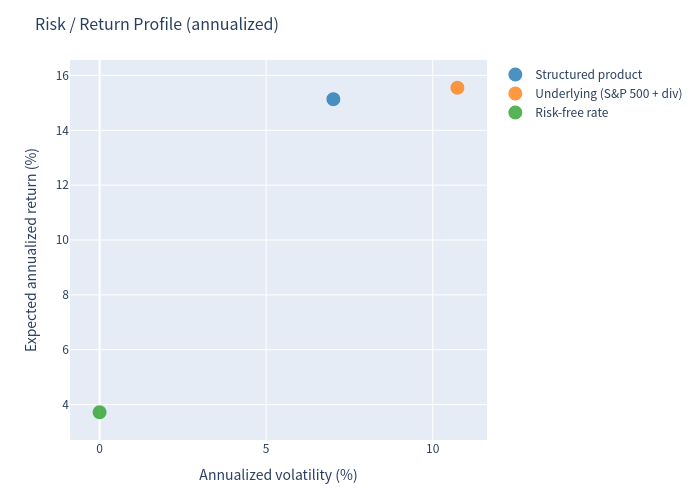
| Expected annualized return | 15.13% | 15.55% |
| Expected annualized volatility | 7.02% | 10.74% |
| Probability of loss | 0.00% | 8.03% |
| 99% confidence VaR (1-year) | 0.00% | −9.74% |
The underlying benchmark is the S&P 500 index total return (price appreciation plus dividends), used as the reference proxy for the SPXFP futures-excess-return underlier. The product payoff itself is computed on the underlier price index (no dividends).
Additional product statistics
- Expected total return over the realized holding period: 31.05% (mean holding ≈2.55 years)
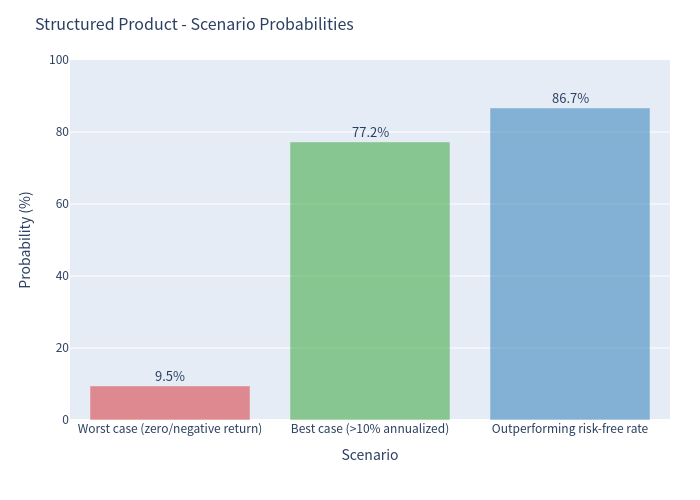
- Probability of >10% annualized return: 77.25%
- Probability of outperforming the risk-free rate (~3.7%): 86.68%
- Probability of a zero return outcome (held to maturity with flat/declining underlier): 9.47%
Charts
Simulation Outcomes: Structured Product vs. Underlying
Scatter plot of simulated outcomes for the structured product against the underlying index.
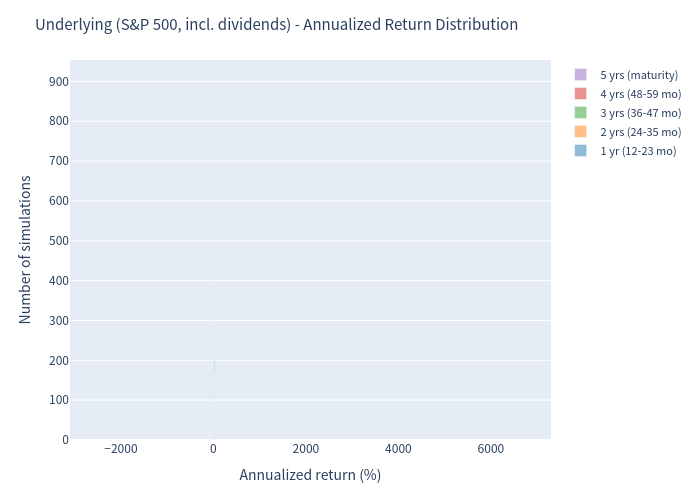
Annualized Return Distributions (1% bins, colored by holding period)
Distribution of annualized returns for the underlying benchmark (left) and the structured product (right).
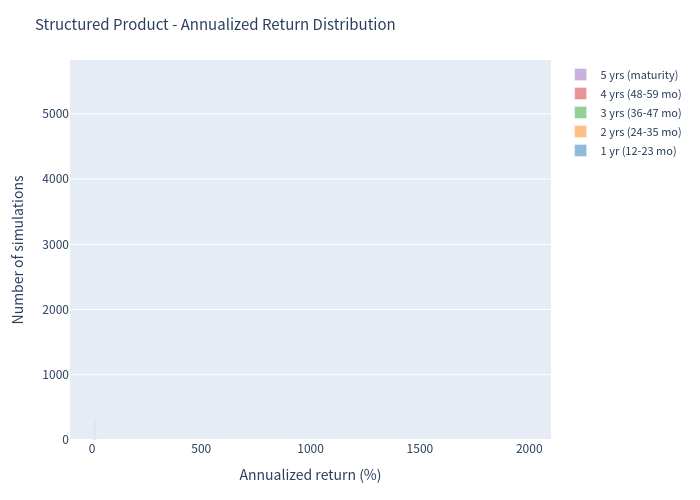
Product Annualized Return Distribution
Distribution of annualized returns for the structured product, colored by holding period.
Scenario Probabilities
Probability of each scenario outcome across the simulation.
Risk / Return Profile
Risk-return positioning of the structured product relative to the underlying benchmark.
Return Distribution Comparison (Box Plot)
Box plot comparing the distribution of returns between the structured product and the underlying.
Holding Period
Distribution of realized holding periods across simulations (pie chart).
Coupons
Coupon outcomes across simulations (pie chart).
Investment Commentary
- Full principal protection at maturity — the simulation shows a 0.00% probability of loss on the contractual payoff and a 99% VaR of 0.00%, a genuinely rare profile for an equity-linked investment.
- Strong expected return (15.13% annualized) driven by the early-redemption schedule: a large share of simulations (≈45%) are called at the first redemption date, delivering a +20% return in roughly one year.
- High probability of beating cash: 86.68% of simulations outperform the ~3.7% risk-free rate, and 77.25% exceed 10% annualized.
- Lower volatility than the underlier (7.02% vs. 10.74% annualized) with a comparable expected return.
- The issuer's early-redemption right caps the practical upside in rising markets: when the notes are called (≈70% of simulations), the holder receives the fixed redemption amount rather than the 160% participation, so the simulated maximum annualized return is 20%.
- In weak markets the notes tend to be held to maturity; about 9.5% of simulations end with a 0% total return over the full 5-year term (principal returned, no gain) — an opportunity cost versus the risk-free rate.
- Because many simulations end within the first two years, annualized figures should be interpreted together with the expected total return (31.05%) and holding period (≈2.55 years).
- The notes carry issuer/guarantor credit risk and are subject to early-redemption (call) risk; secondary-market value may differ from the payoff profile shown.
This analysis is for informational purposes only and does not constitute investment advice or a suitability assessment.