
Headline simulation results
Based on 10,000 Monte-Carlo simulations of the five-stock worst-of basket over the 21-month life.
| Metric | Structured Product |
|---|---|
| Expected annualized return | 7.06% |
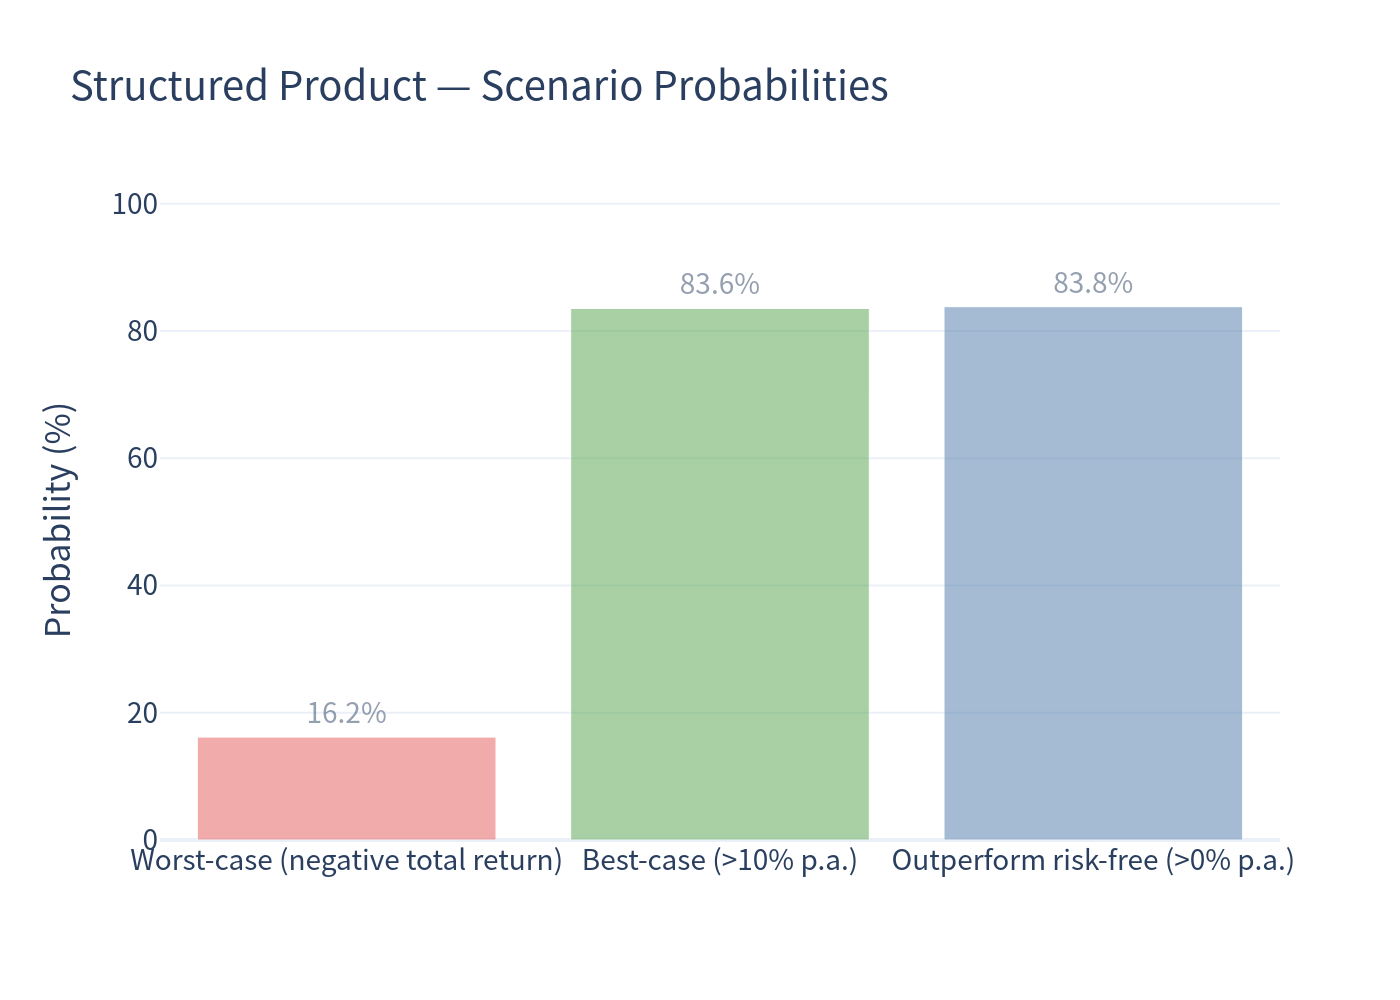
| Probability of a negative return | 16.17% |
| 99% VaR (1 year, annualized) | −27.45% |
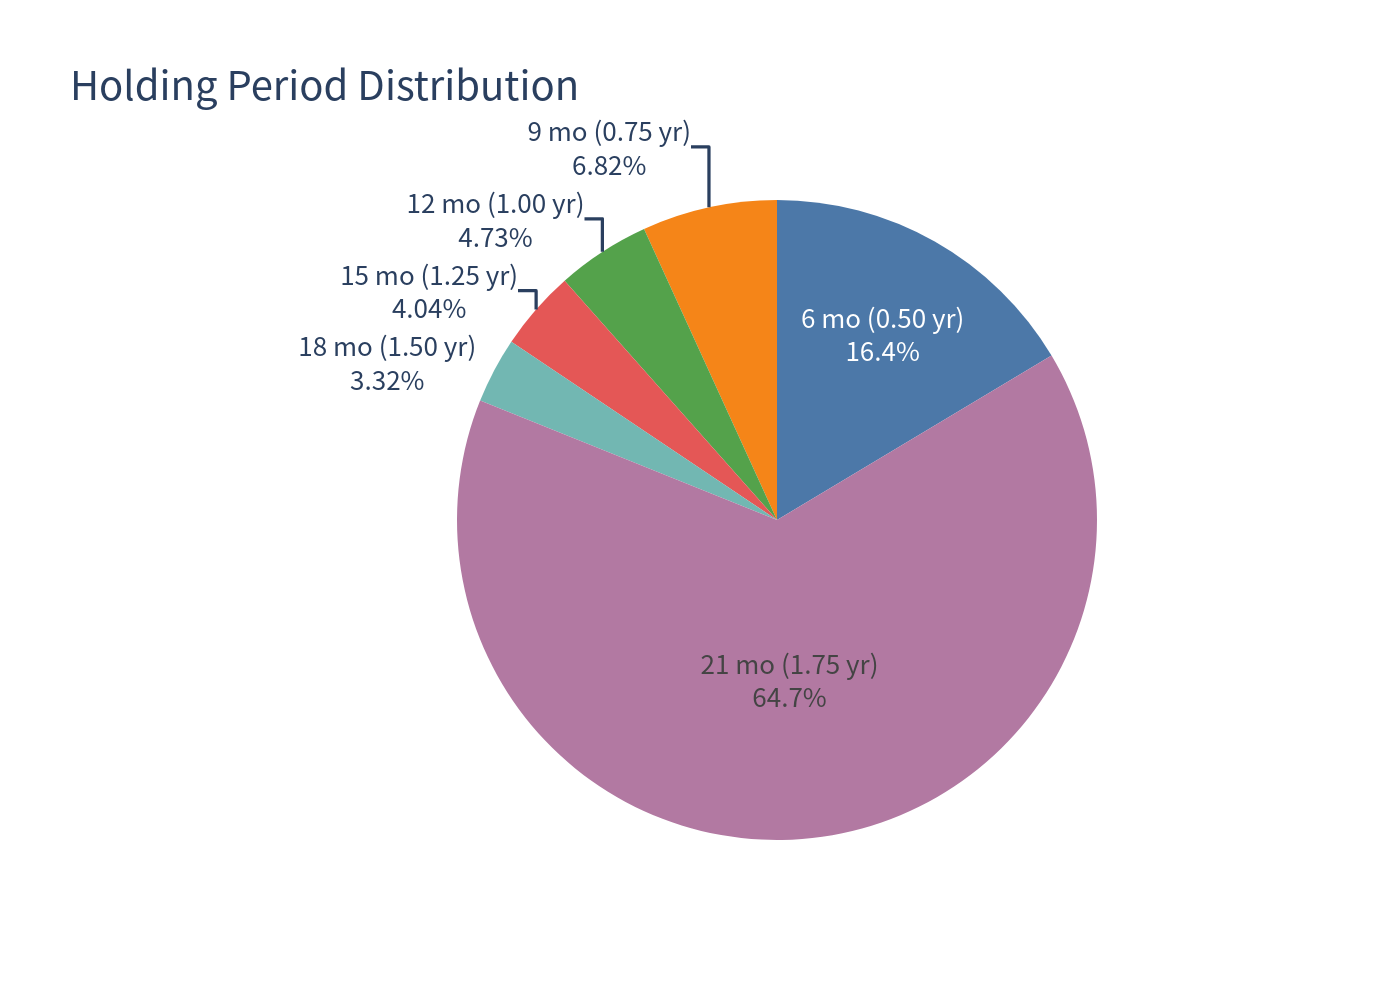
| Expected holding period | ≈ 16.9 months (1.41 yr) |
| Expected total return (over the realized holding period) | 9.11% |
| Median annualized return | 11.51% |
| Probability of beating the risk-free rate (≈0%) | 83.83% |
The payoff is deliberately “barbell”-shaped. In roughly 84% of simulations the note behaves like a high-coupon bond, delivering a fairly steady ~11.5%–12.0% p.a. In about 16% of simulations the 55% barrier is breached and the investor takes a real loss — averaging −25.2% total return in those paths. Because the note is callable and its holding period varies from 6 to 21 months, the annualized numbers should always be read together with the total return and holding period; the expected total return of 9.11% over an expected 1.41-year holding period is the most intuitive headline.
Product at a glance
- Issuer: Leonteq Securities AG (Guernsey Branch) — Fitch BBB−
- Structure: worst-of Multi Barrier Reverse Convertible, callable by the issuer
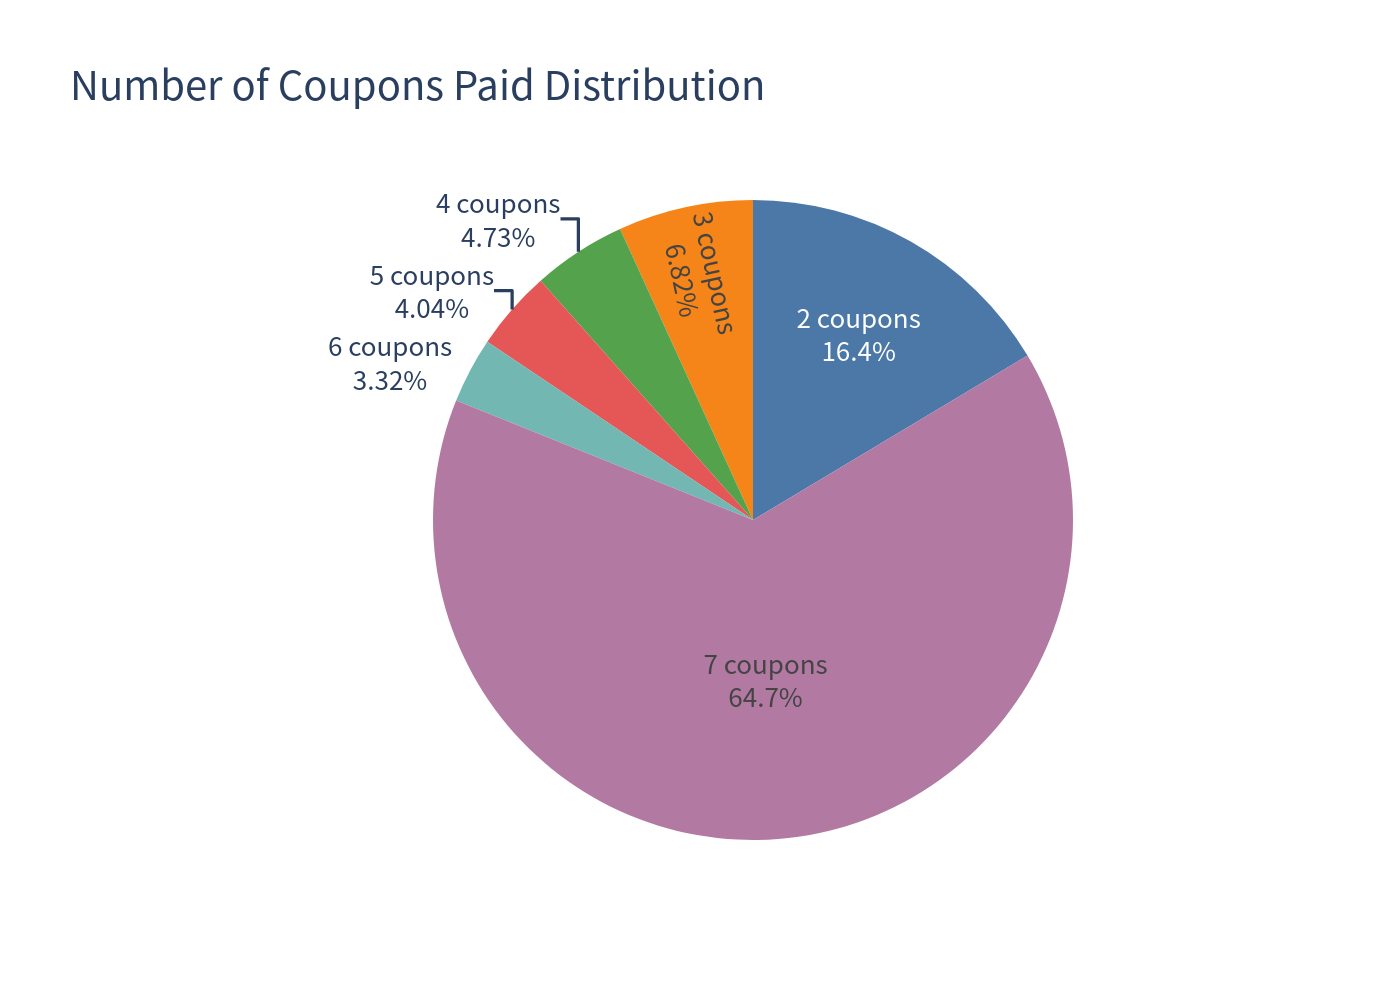
- Coupon: 12.00% p.a., paid quarterly (3.00% per quarter) in any case while the note is alive
- Underlyings: ABB, Roche Holding, Swiss Re, UBS Group, Zurich Insurance (equal weight for the basket)
- Barrier: 55% of initial level, continuously observed on a worst-of basis
- Strike: 100% · Upside: capped
- Maturity: 14 July 2028 (21 months), with quarterly issuer call dates
How it works (in plain terms)
- You are paid 12% a year in quarterly coupons regardless of how the five stocks perform, as long as you hold the note.
- You are taking “worst-of” risk on five large Swiss blue chips. If the weakest of the five never drops to 55% of its starting level, you receive 100% of your capital back at maturity, plus all coupons.
- If the weakest stock touches its 55% barrier at any moment, principal protection switches off. From then on, at maturity you get your full 100% back only if the weakest stock has recovered to at least its starting level; otherwise you receive that stock’s performance — i.e. you absorb its full decline.
- The issuer can call the note early on the scheduled quarterly call dates (from month 6 onward), handing back principal plus the coupon. This caps how long you can keep collecting the 12% and removes any upside.
Key statistics — structured product vs underlying basket
| Metric | Structured Product | Underlying Basket (total return) |
|---|---|---|
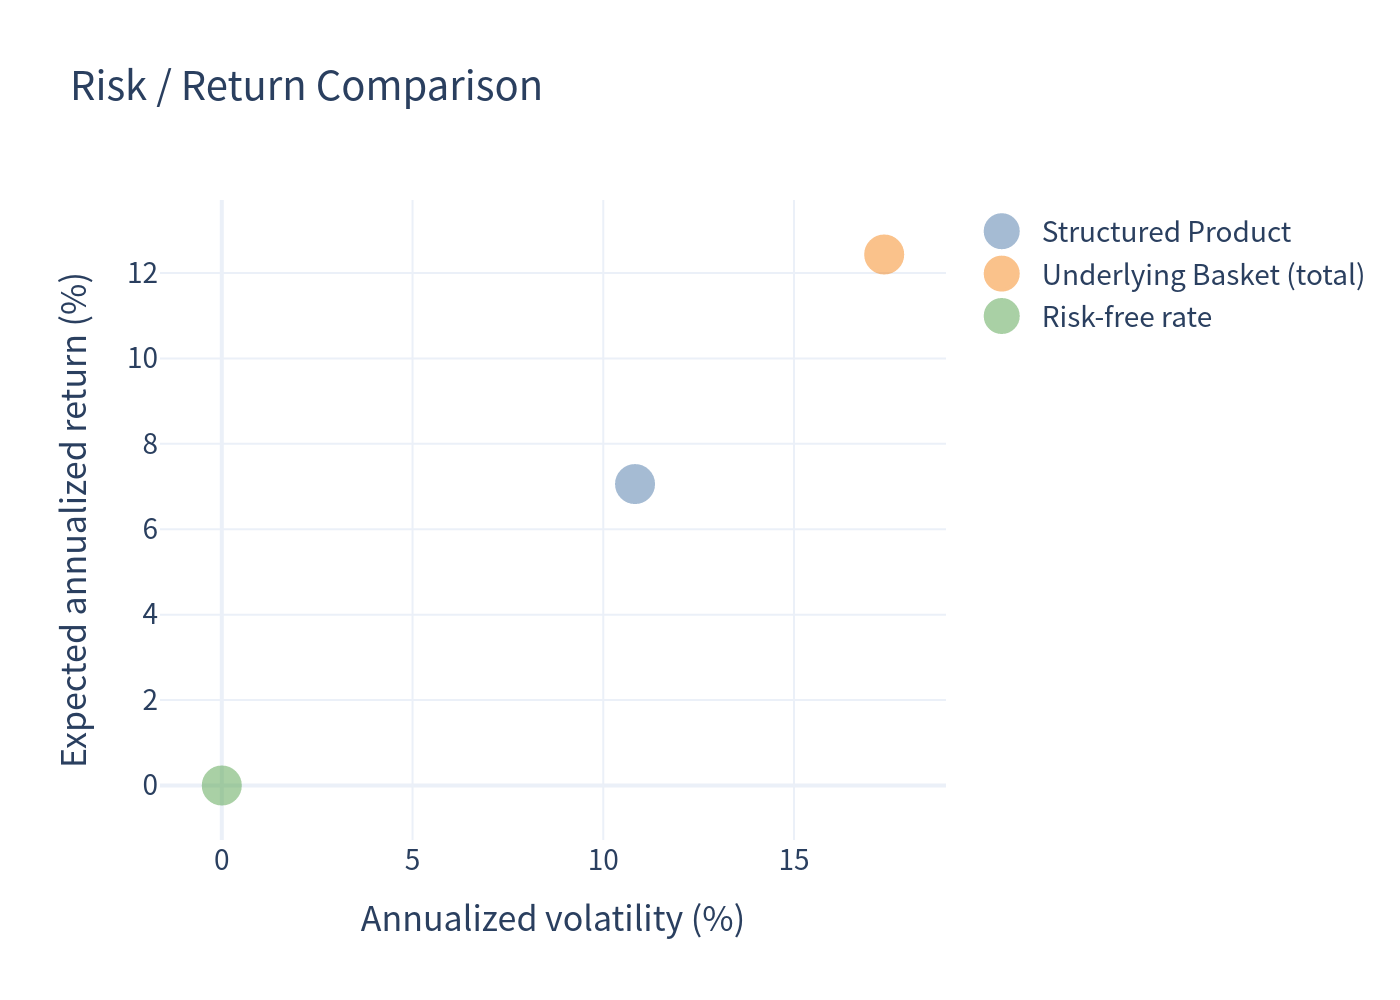
| Expected annualized return | 7.06% | 12.43% |
| Expected annualized volatility | 10.83% | 17.36% |
| Probability of loss | 16.17% | 25.14% |
| 99% VaR (1 year, annualized) | −27.45% | −19.15% |
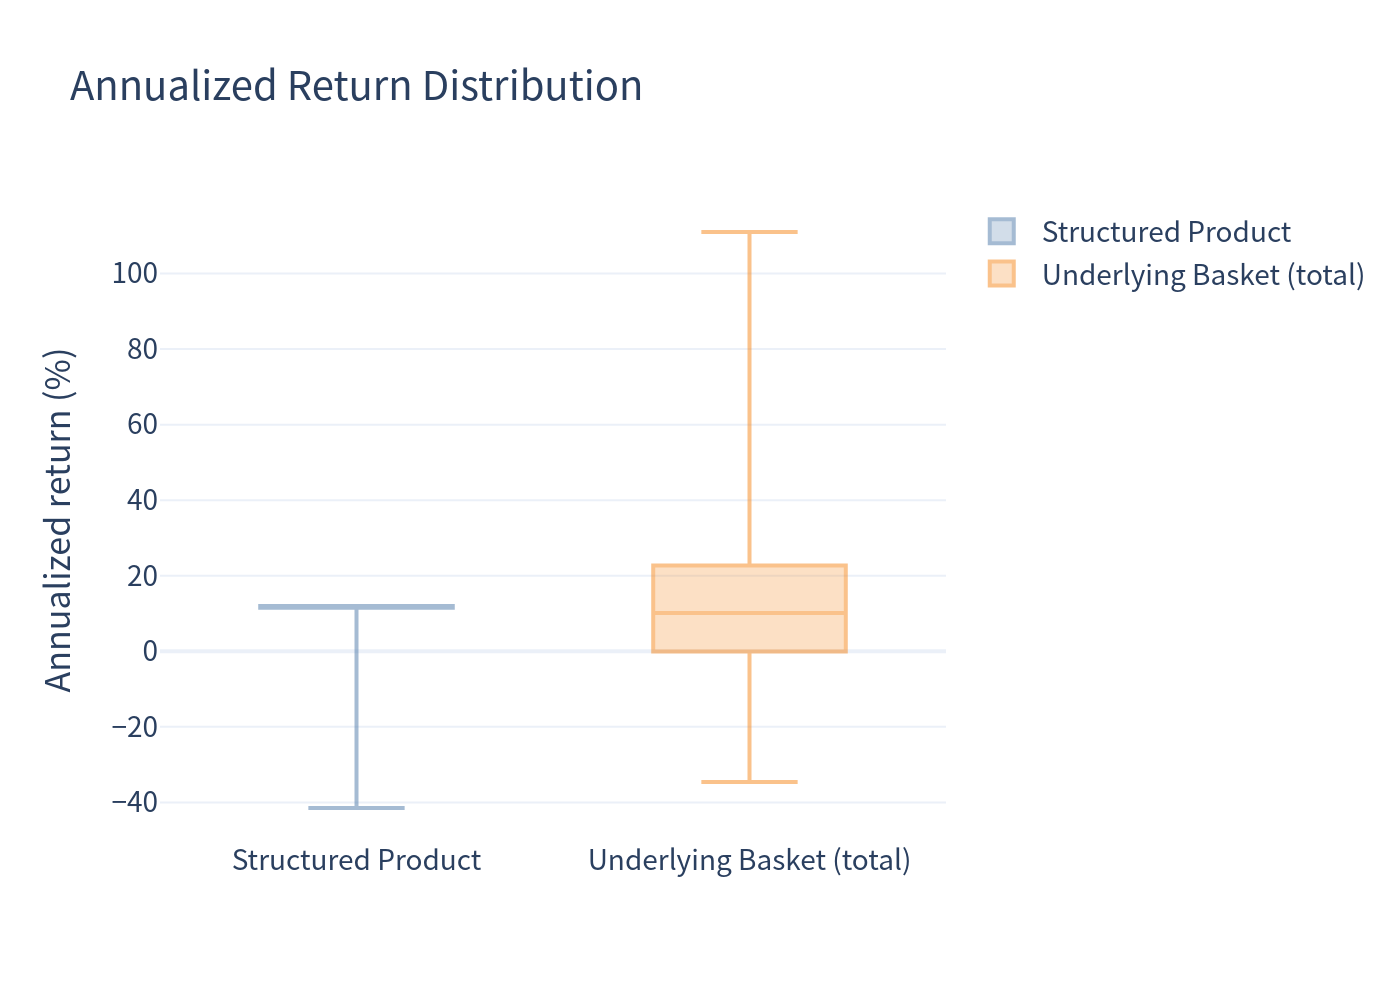
The basket benchmark is an equal-weight basket of the five underlyings on a total-return basis (capital plus reinvested dividends; the five names currently yield ~3.1% on average). The comparison shows the trade-off clearly: the note has lower volatility and a lower probability of loss than simply holding the basket, but its upside is capped, so its average return is lower, and — because the barrier removes protection — its worst-case (VaR) outcome is actually deeper than the basket’s.
Charts
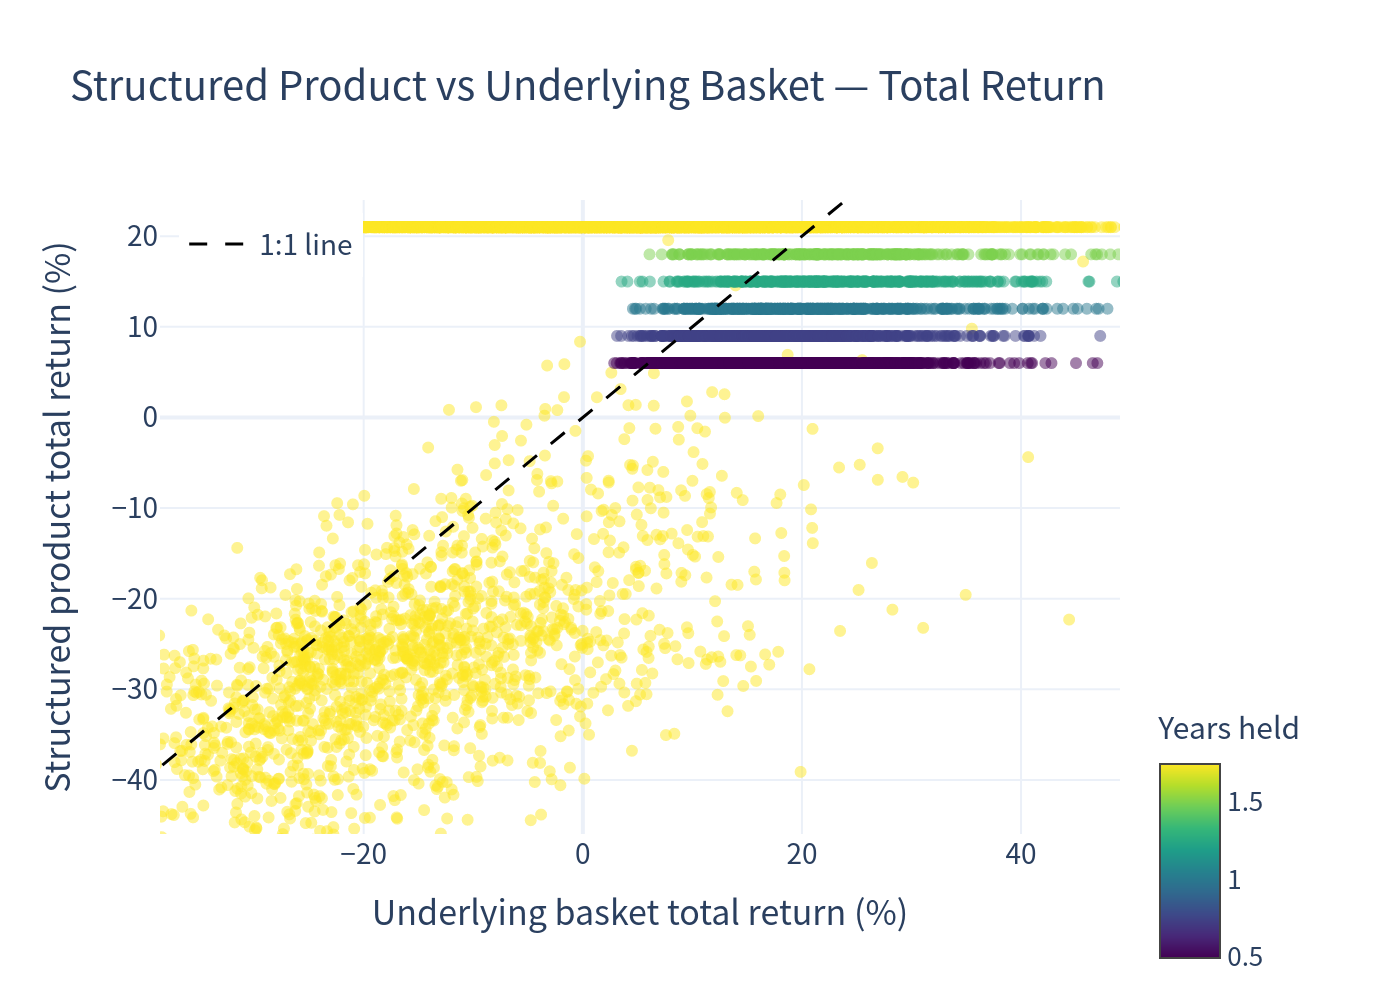
Simulated outcomes (product vs underlying basket)
Each dot is one simulation; colour shows the number of years the note was held. The dashed line is 1:1.
Distribution of simulated annualized returns
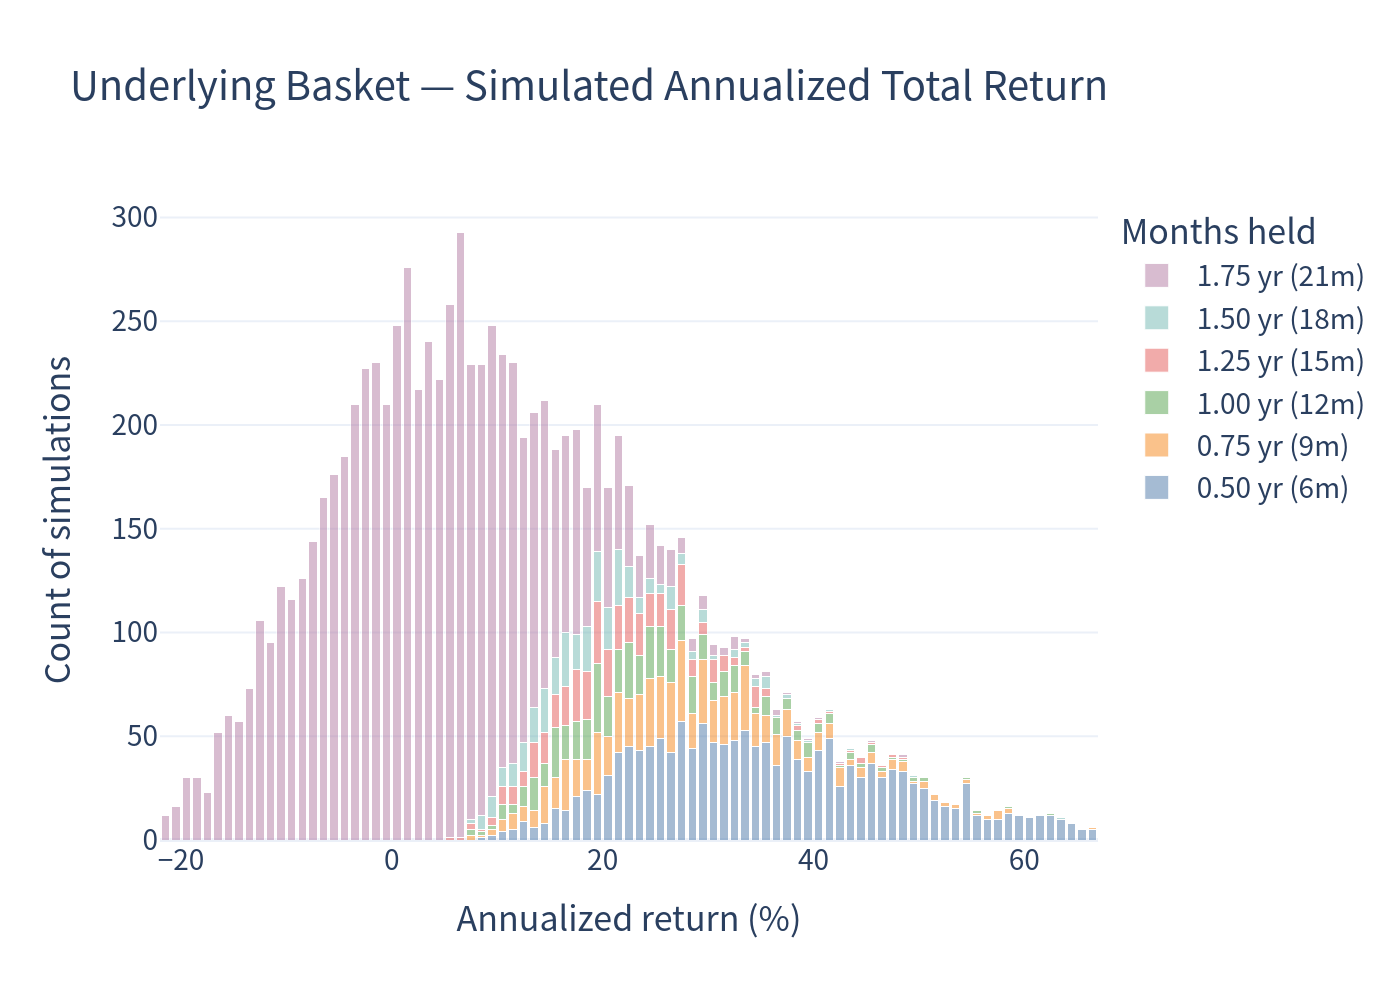
Underlying basket (total return), stacked by holding period:
Structured product, stacked by holding period:
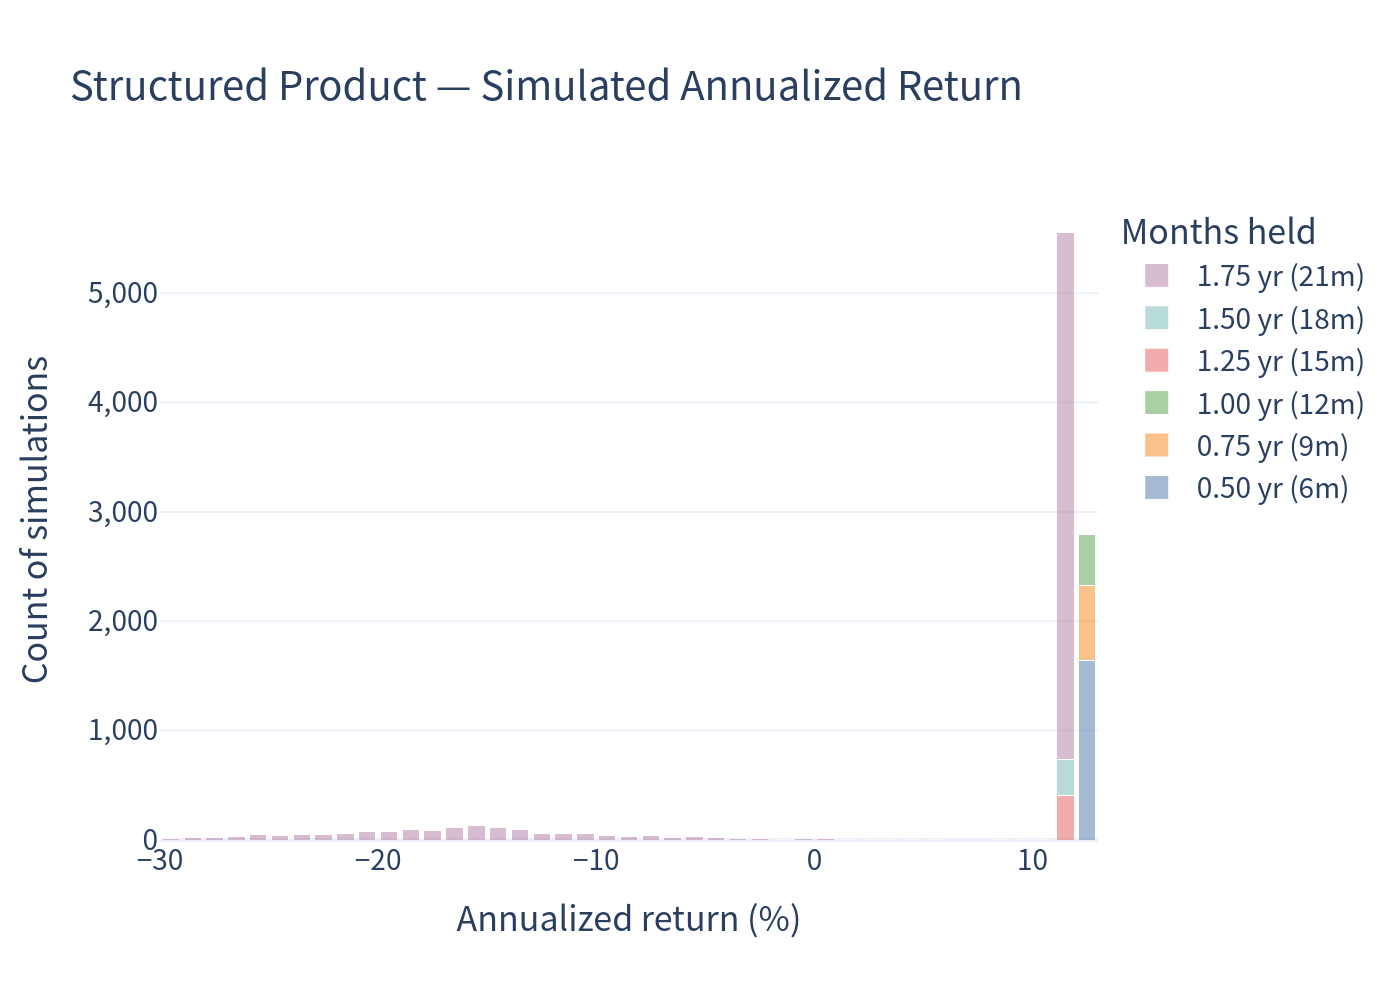
The product’s histogram is strongly two-sided: a large spike around +11.5%–12% (coupons, no loss) and a long negative tail created by barrier breaches. The basket’s returns are more symmetric and spread out, with a much fatter upside tail and a higher overall probability of loss (25.14% vs 16.17% for the note), but a shallower extreme downside tail (VaR −19.15% vs −27.45%).
Scenario probabilities
Risk / return comparison
Annualized-return box plot
Holding period and coupon-count distributions
If the note is not always held to maturity:
Coupon payments received:
Investment commentary
Strengths
- High running yield: 12% p.a. paid quarterly, and coupons are paid in any case while the note is alive — even if a barrier event occurs.
- Contingent capital protection: in ~84% of simulated paths the investor does not lose money; if the 55% barrier is never breached, capital is fully returned.
- Lower volatility than the basket: the capped, coupon-led profile produces roughly 10.8% annualized volatility vs 17.4% for the underlying basket.
- Diversified, high-quality reference basket: five large, cash-generative Swiss blue chips spanning industrials, pharma, reinsurance, banking and insurance; a relatively short 21-month tenor.
- Frequent call optionality: the issuer may redeem early, returning principal plus coupon.
Risks to keep in mind
- Worst-of barrier: monitoring the weakest of five names materially raises the chance of a breach versus a single-name note. Simulated barrier-breach probability is ~17%.
- Capped upside: the investor never participates in equity upside beyond the coupon.
- Loss severity once breached: after a breach the investor is exposed to the weakest stock’s full decline from its starting level. The 99% VaR of −27.45% illustrates that the note’s downside, when it materialises, is deeper than the basket’s own tail.
- Call risk: the issuer will typically call when it is cheapest to do so, truncating the period over which the 12% coupon is earned.
- Issuer credit risk: repayment depends on Leonteq Securities AG (Fitch BBB−).