
Structured Product Analysis Report
12.00% p.a. Multi Barrier Reverse Convertible on Allianz, Deutsche Bank & Munich Re (Issuer-Callable, Worst-of)
Headline Simulation Results
Basic Product Information
How it works (layman terms): The investor lends EUR 1,000 per product for up to 2 years and receives a high fixed coupon of 3% every quarter (12% p.a., EUR 30 per quarter) — paid regardless of how the three German financial stocks (Allianz, Deutsche Bank, Munich Re) perform, for as long as the product is outstanding. At maturity the investor gets their money back (100%) in cash unless both of the following happen: (i) a "barrier event" has occurred — at some point during the 2 years at least one of the three stocks traded at or below 59% of its starting level — and (ii) at maturity the worst-performing stock closes at or below its starting level (100%). Only in that combined case does the investor receive that worst stock instead of cash (typically worth less than the original investment). The upside is fully capped: no matter how well the stocks do, the investor only receives the coupons plus their money back. The issuer may also terminate ("call") the product early at its discretion around each coupon date from month 12 onward, repaying 100% plus the coupon then due.
Product type: Reverse Convertible with continuous multi-barrier observation, coupon 12.00% p.a. (quarterly), barrier 59.00%, strike 100%, issuer-callable quarterly from month 12 (Sep 2027). Denomination EUR 1,000, listed on SIX Swiss Exchange.
Key Statistics — Structured Product vs Underlying Benchmark
Benchmark = equal-weight basket of Allianz, Deutsche Bank and Munich Re (price index total return incl. dividends), measured over the same holding horizon as the product in each scenario.
| Statistic (annualized) | Structured Product | Underlying Basket (total return) |
|---|---|---|
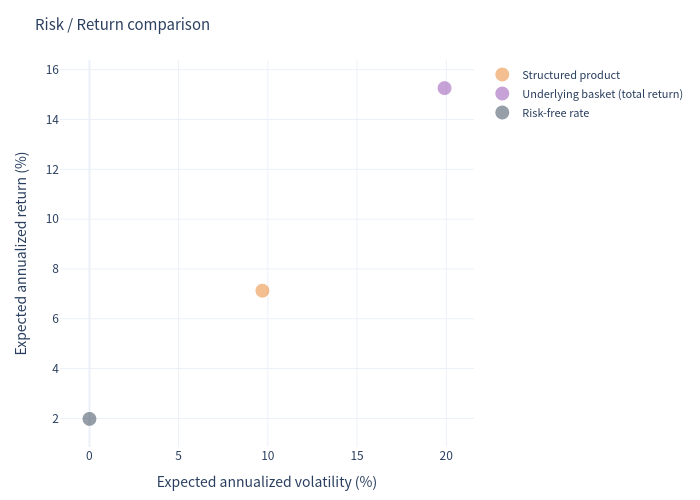
| Expected annualized return | 7.13% | 15.26% |
| Expected annualized volatility | 9.70% | 19.90% |
| Probability of loss | 18.68% | 23.00% |
| 99% VaR (1 year) | -23.80% | -23.36% |
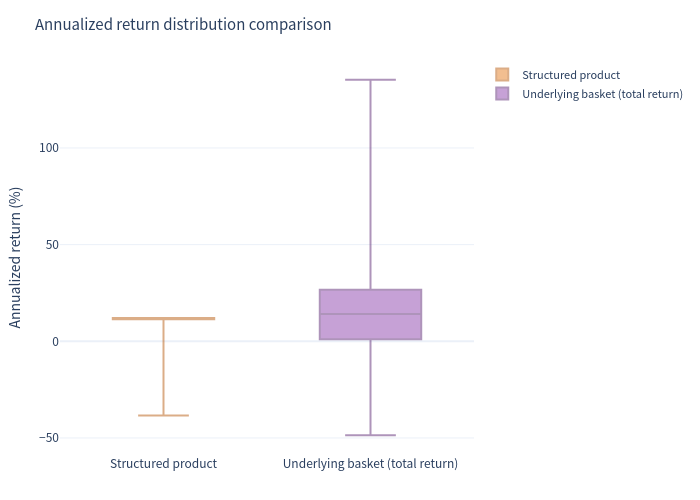
| Best scenario (max) | 12.00% | 135.3% |
| Worst scenario (min, annualized) | -38.40% | -48.60% |
| Worst scenario (min, total over holding) | -62.01% | -48.6% |
Risk-free (EUR, 1-yr avg): 1.98%. The product's downside protection is visible in its materially lower volatility and lower loss probability than the stocks; in exchange, upside is capped at the 12% p.a. coupon stream.
Product mechanics observed in simulation:
- Early redemption (issuer call) in 53.9% of scenarios — typically returning par + all coupons accrued to that date (total return 12.0%–21.0% depending on call date).
- Barrier breached in ~22.3% of scenarios; 20.7% of scenarios end at maturity with the barrier breached and the worst stock at/below its start, triggering share delivery (redemption below par — which can still be a positive total return once the 24 coupon points are included).
- Worst simulated outcome: total return ≈ -62.0% over the full holding (≈ -38.4% annualized over 24 months, deep barrier breach at maturity).
Charts
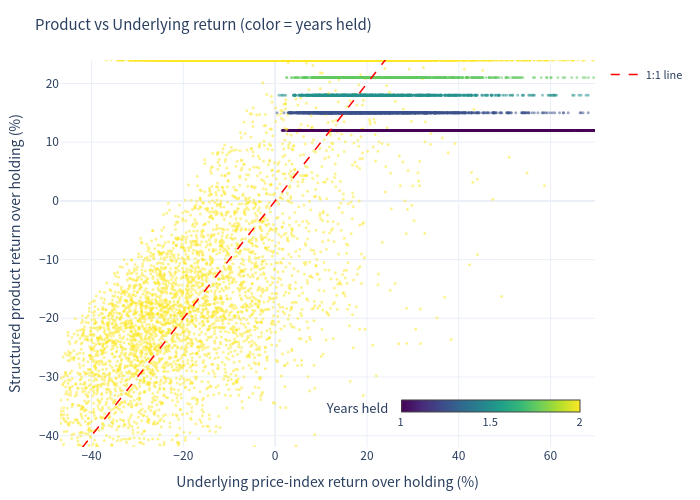
Product vs Underlying Return Scatter
Each point is one simulated outcome. Colour = years held. The 1:1 line is shown for reference; the product's capped/flat payoff profile is clearly visible.
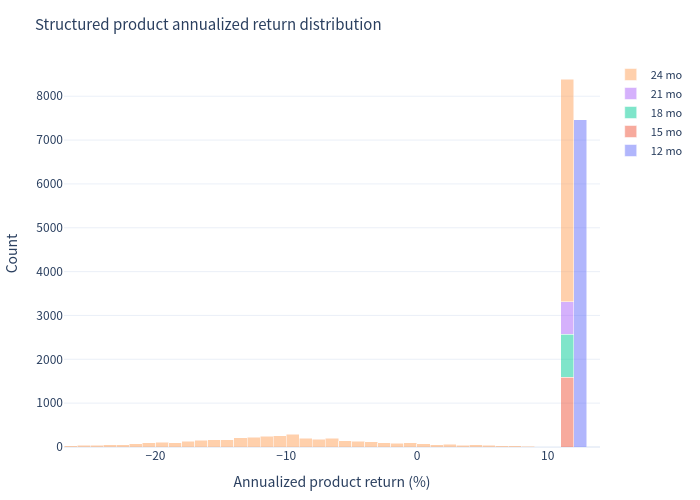
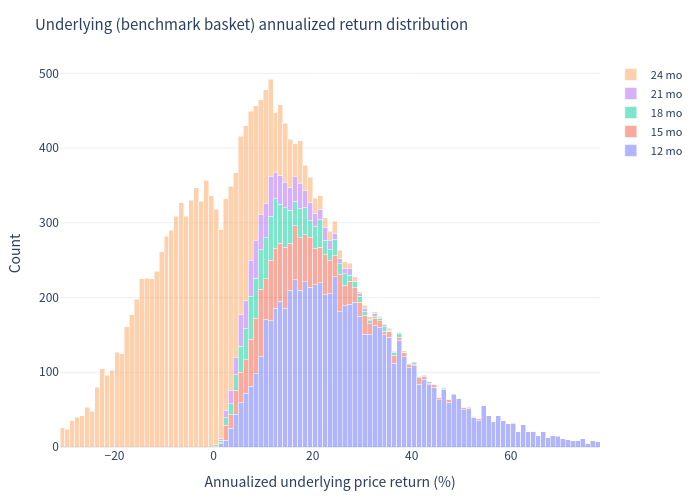
Annualized Return Distributions (stacked by months held)
Distribution of annualized total returns for the structured product and for the underlying basket, stacked by the number of months each scenario was held.
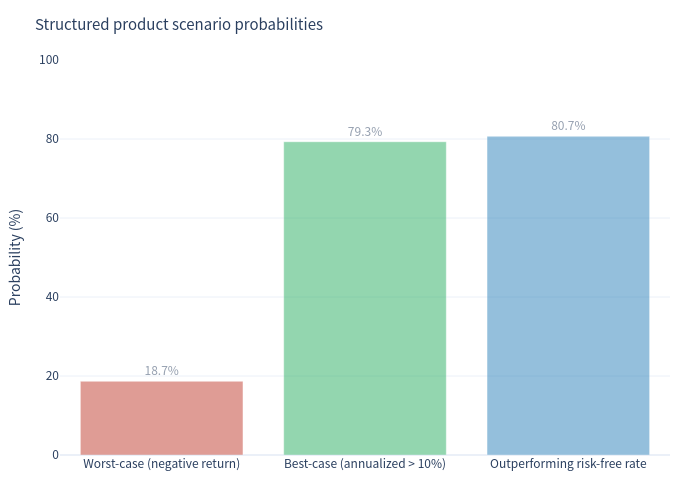
Scenario Probabilities
Share of simulated scenarios by outcome type — early redemption, held to maturity with cash repayment, and share delivery.
Risk / Return
Annualized expected return against risk (volatility) for the structured product versus the direct underlying basket.
Return Distribution Comparison
Box-whisker comparison of the full distribution of simulated outcomes for the product and the underlying basket.
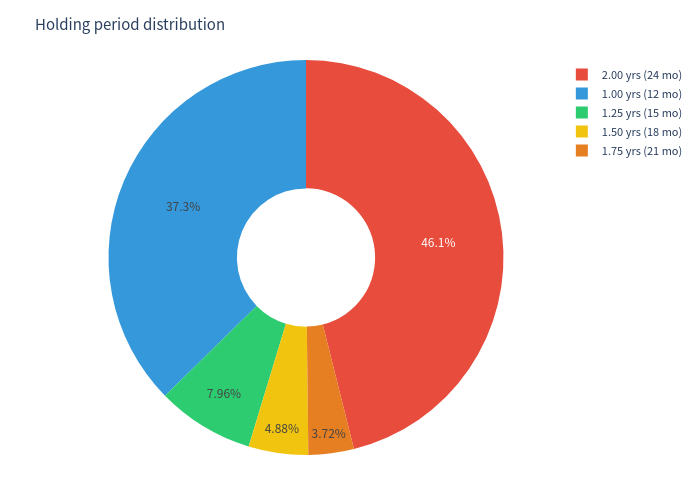
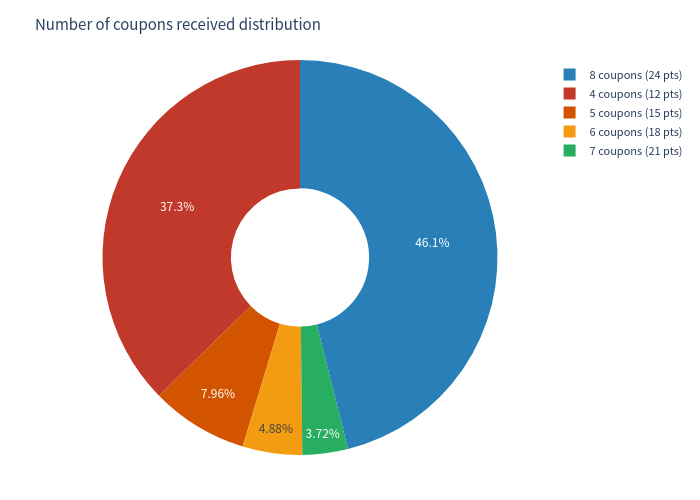
Holding Period & Coupon Distributions
Distribution of simulated holding periods (years held until redemption/maturity) and of the number of coupons received per scenario.
Investment Commentary
Attractive features
- High running yield: 12.00% p.a. paid quarterly (3.00% per coupon); coupons are paid regardless of underlying performance for as long as the product is outstanding, and the final coupon is always received (including on any early-redemption date).
- Downside cushion vs. direct equity investment: 59% continuous multi-barrier with all coupons and 100% of capital repaid unless a stock trades at/below 59% of its start AND the worst stock finishes below its start at maturity. Loss probability (~18.7%) and volatility (9.7%) are clearly lower than for the three stocks held directly (loss prob. ~23%, vol ~19.9%).
- Strong expected outcome: positive expected annualized return of ~7.1%, and the product beats the ~2% risk-free rate in ~81% of scenarios; ~79% of scenarios earn more than 10% p.a. annualized (mostly the early-redemption cases returning par plus 12–21% total).
- No currency mismatch: product and all three underlyings are EUR-denominated.
Considerations
- Upside fully capped: gains are limited to the fixed coupon; in strongly rising markets the direct stock basket (expected ~15.3% p.a.) is expected to outperform.
- Capital-at-risk tail: if the barrier is breached (any one stock ≤59%) and the worst stock closes below its start at maturity, the investor receives shares worth less than par — worst simulated total return ≈ -62% over the full holding. Losses cluster in the ~46% of scenarios held to full maturity.
- Issuer call optionality: the issuer (not the investor) decides whether to redeem early; holders cannot rely on receiving the full 2-year coupon stream (only ~46% of scenarios receive all 8 coupons).
- Credit risk: investor is exposed to Basler Kantonalbank as issuer; product is a debt instrument, not a collective investment scheme.
Note: issuer call behaviour is discretionary and modelled under a stated assumption (issuer redeems when the worst stock is at/above its start level on an observation date). Results are robust across alternative call assumptions (expected annualized return 6.6%–7.6%). No fees or commissions are reflected; dividend yields are only applied to the benchmark comparison.
This report is for information only and does not constitute investment advice or a suitability assessment.