
info@tokenengine.ai
Investment Analysis Report: 10.75% p.a. CHF Autocall Barrier Reverse Convertible
This structured product is an Autocallable Barrier Reverse Convertible linked to the worst performance of three European equities: Bayer AG (Germany), EMS-CHEMIE Holding AG (Switzerland), and Lonza Group AG (Switzerland).
- Coupon payments: Pays a fixed quarterly coupon of 2.6875% (10.75% p.a.) regardless of underlying performance.
- Automatic Early Redemption (Autocall): If on any quarterly observation date (months 6, 9, 12, 15), ALL three underlyings are at or above their initial levels, the product is automatically redeemed at par (100%) plus the coupon for that period.
- Capital Protection (conditional): At maturity, if no Kick-In event occurred (none of the underlyings fell below 60% of initial during the observation period), the investor receives full par (100%).
- Kick-In Risk: If any underlying falls below 60% of its initial level during the observation period (continuously monitored), the capital guarantee is voided:
- If all three are at or above initial levels at maturity: full par returned.
- If the worst performer is below initial at maturity: investor receives the depreciated value of that worst-performing underlying.
- Upside cap: Returns are capped at the coupon stream. There is no participation in underlying price appreciation beyond the fixed coupon.
| Metric | Structured Product | Benchmark (Equal-Weight Basket with Dividends) |
|---|---|---|
| Expected Annualized Return | 3.06% | 12.38% |
| Annualized Volatility | 13.86% | 24.58% |
| Probability of Loss | 24.38% | 35.07% |
| 99% Confidence VaR (1-year) | -35.59% | -30.56% |
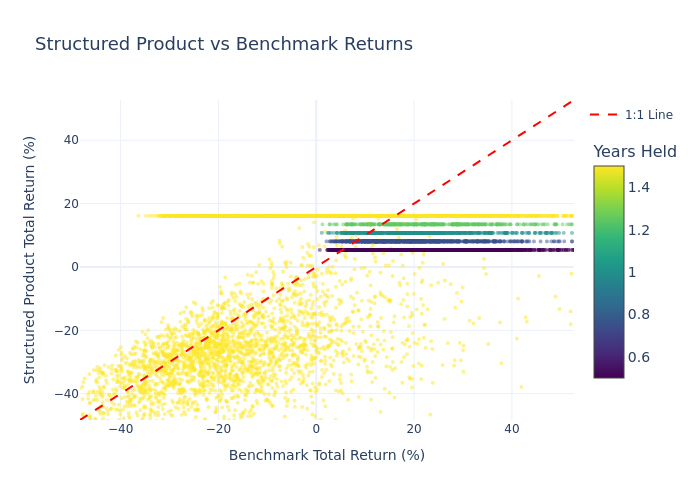
Scatter Plot: Product vs Benchmark Returns
The scatter plot compares the total return of the structured product against the benchmark (equal-weight basket of the three underlyings). Points above the 1:1 red dashed line indicate simulations where the structured product outperformed the benchmark. Colors indicate the holding period in years. The product's capped nature creates the horizontal ceiling at approximately 16.12% (maximum total return from all coupons).
Annualized Return Distributions
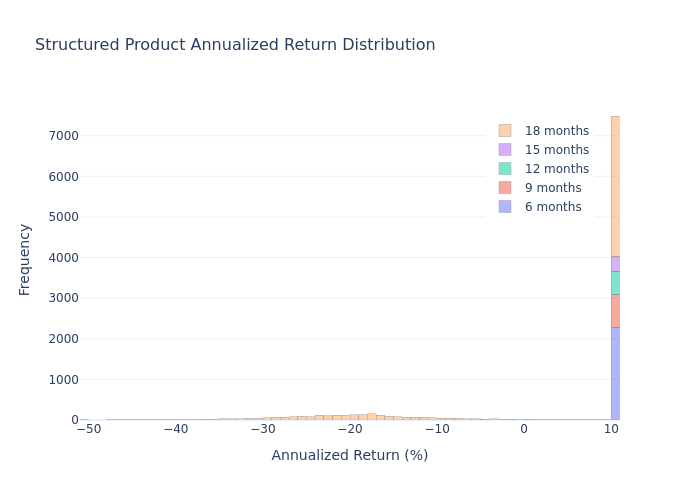
Structured Product
The structured product histogram shows a multi-modal distribution reflecting different holding periods. Early-redemption simulations (6-15 months) cluster around 10.75% annualized return, while maturity-held simulations show a wider dispersion including losses.
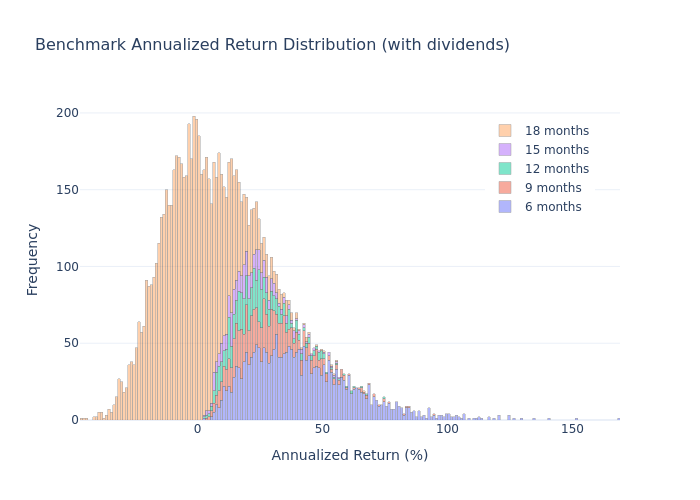
Benchmark (with Dividends)
The benchmark shows a more symmetric distribution centered around 12.38%, with wider tails reflecting the higher volatility of direct equity exposure.
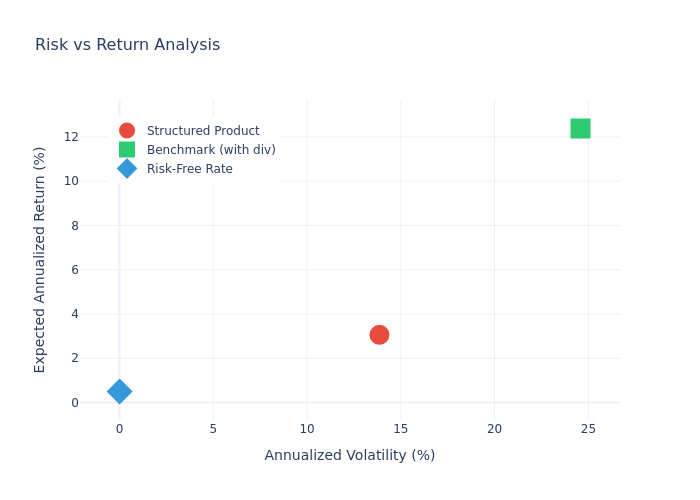
Risk vs Return Profile
The risk/return scatter shows that the structured product offers lower expected return (3.06%) but also significantly lower volatility (13.86%) compared to the benchmark (12.38% return, 24.58% volatility). The risk-free rate (0.50%) is shown for reference.
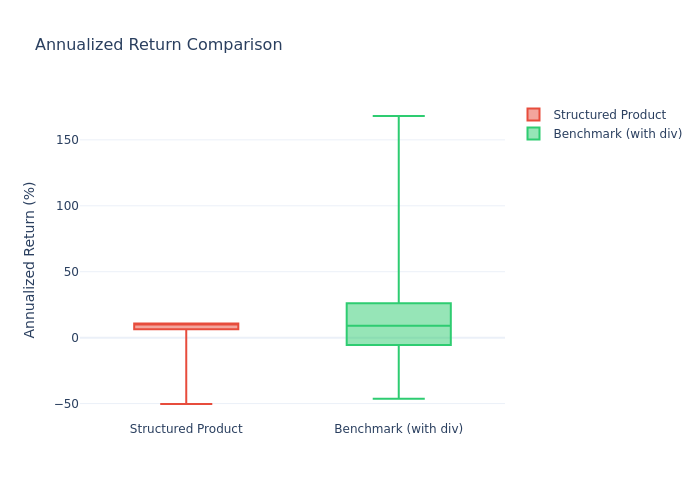
Return Comparison (Box Plot)
The box plot shows the structured product has a narrower interquartile range and fewer extreme negative outcomes compared to the direct equity investment. The product's median annualized return is significantly higher than the benchmark's median, though the mean is lower due to the effect of negative tail scenarios.
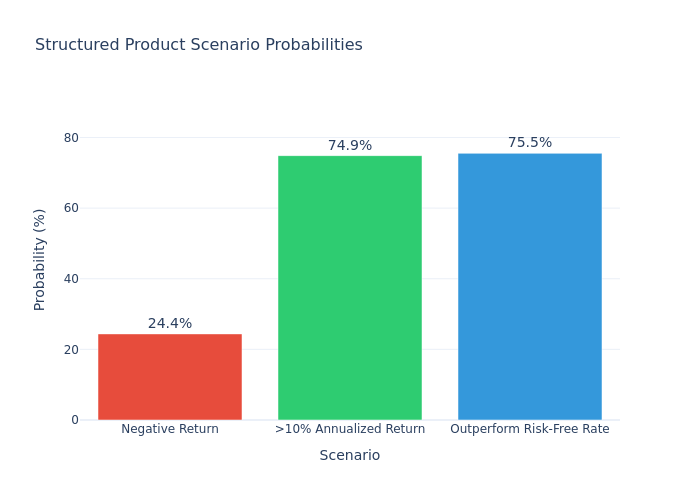
Key probability breakdowns from the simulation analysis:
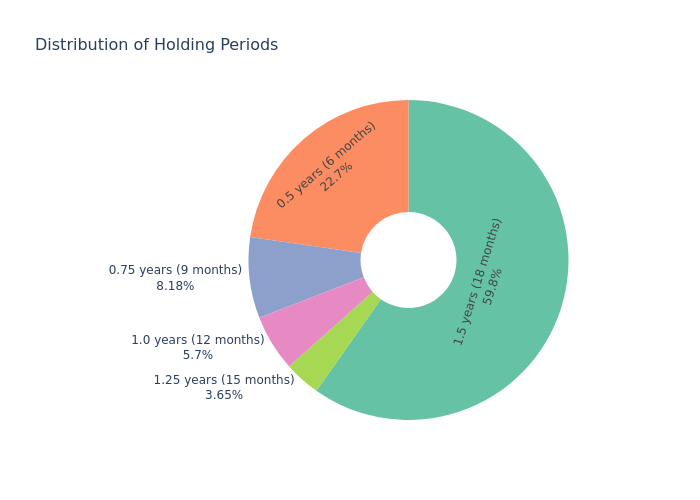
Distribution of Holding Periods
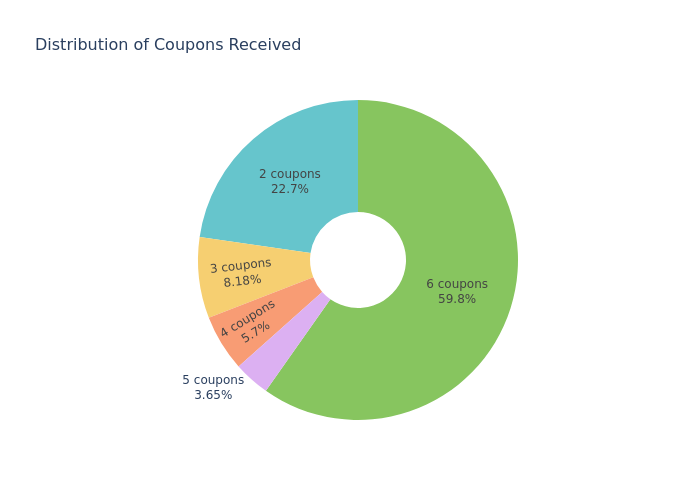
Distribution of Coupons Received
| Holding Period | Probability |
|---|---|
| Held to full maturity (18 months / 1.5 years) | 59.76% |
| Early redemption at month 6 (0.5 years) | 22.71% |
| Early redemption at month 9 (0.75 years) | 8.18% |
| Early redemption at month 12 (1.0 years) | 5.70% |
| Early redemption at month 15 (1.25 years) | 3.65% |
| Coupons Received | Probability |
|---|---|
| All 6 coupons (held to maturity) | 59.76% |
| 2 coupons (early redemption at month 6) | 22.71% |
| 3 coupons (early redemption at month 9) | 8.18% |
| 4 coupons (early redemption at month 12) | 5.70% |
| 5 coupons (early redemption at month 15) | 3.65% |
Key Strengths
- Attractive coupon income: 10.75% p.a. paid quarterly provides substantial regular income, significantly above current Swiss bond yields.
- Partial downside cushion: The 60% barrier provides meaningful buffer against moderate market declines before capital is at risk.
- Autocall feature: Early redemption at par can occur if all three stocks perform well, allowing reinvestment opportunities.
- Reduced volatility: The product exhibits lower annualized volatility (13.86%) compared to the direct equity basket (24.58%).
Key Risks
- Kick-In barrier risk: If any of the three underlyings breaches the 60% barrier, full downside exposure to the worst-performing stock applies at maturity.
- Worst-of structure: Having three name-concentrated underlyings with the payoff depending on the worst performer significantly increases the probability of loss compared to a diversified portfolio.
- Capped upside: Maximum return is limited to the coupon stream regardless of how much the underlying equities appreciate.
- Issuer credit risk: The product is an unsecured obligation of UBS AG and is not covered by deposit protection schemes.
- Concentration risk: All three underlyings are in the chemicals/pharma/life sciences sector, providing limited diversification benefit.
info@tokenengine.ai
© 2025 tokenengine.ai. All rights reserved.