
Morgan Stanley Step-Up Jump Market-Linked CD (Auto-Callable) — Analysis
Linked to the Morgan Stanley Amplitude Index™ — maturity 1 Nov 2033 (7 years)
Headline simulation results
| Metric | Result |
|---|---|
| Expected annualized return | +13.83% |
| Probability of negative returns | 0.00% |
| 99% confidence VaR (1-year) | 0.00% |
| Expected total return (over realized holding period) | +20.44% |
| Expected holding period | ~19.88 months (1.66 years) |
| Probability of being auto-called | 95.93% |
Basic product information
- Type: FDIC-insured market-linked Certificate of Deposit with a step-up, auto-callable (autocall) feature.
- Deposit amount: $1,000 per CD (fully paid up front). Currency: USD.
- No regular interest / coupon is paid.
- Principal protection: at maturity the deposit amount is repaid in full (100 index points), regardless of the underlier's performance. Protection is subject to the issuer's credit risk and to FDIC limits ($250k per depositor per ownership capacity).
- Estimated value at issue: ~$884.40 per CD (embedded costs).
How it works (plain English)
- Auto-call (the main event): On each annual "determination date" (years 1–6), if the underlier closes at or above a step-up threshold (101%, 102%, 103%, 104%, 105%, 106% of its starting level), the CD is automatically redeemed and you receive a step-up cash amount equivalent to roughly 14.75% per annum on the amount of time elapsed (e.g. $1,147.50 after 1 year, $1,295.00 after 2 years, … $1,885.00 after 6 years). Because the first trigger is only +1%, the CD is very likely to be redeemed early.
- If never called (you hold all 7 years): At maturity, if the index finished above its starting level you receive the deposit plus 100% participation in the gain (uncapped upside). If the index finished flat or down, you simply get your deposit back (no loss of principal).
- Net effect: You are effectively lending your money for up to 7 years at a ~0% floor, receiving a fixed step-up amount of ~14.75% per annum whenever the equity market clears the call threshold, and keeping full upside only in the rare case the CD survives to maturity.
Key statistics
| Metric | Structured Product | S&P 500 Total Return (benchmark) |
|---|---|---|
| Expected annualized return | 13.83% | 14.31% |
| Expected annualized volatility | 2.83% | 10.46% |
| Probability of loss | 0.00% | 2.30% |
| 99% VaR (1-year) | 0.00% | -4.40% |
The product delivers a return very close to the equity benchmark's expected return but with dramatically lower volatility (2.83% vs 10.46%) thanks to early auto-calling and principal protection. The trade-off is a cap on the return in bullish scenarios: once the index clears its call threshold the CD is redeemed at the fixed step-up amount and the extra equity upside is forgone.
Simulation outcomes
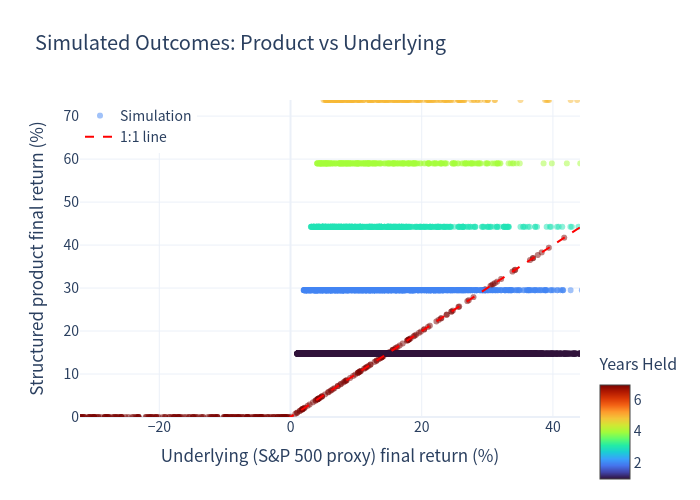
Each dot is one simulated path; the X-axis is the underlier return and the Y-axis the product return, coloured by the number of years held. Note the strong horizontal "floor" at 0% (principal protection) and the vertical stack of early calls.
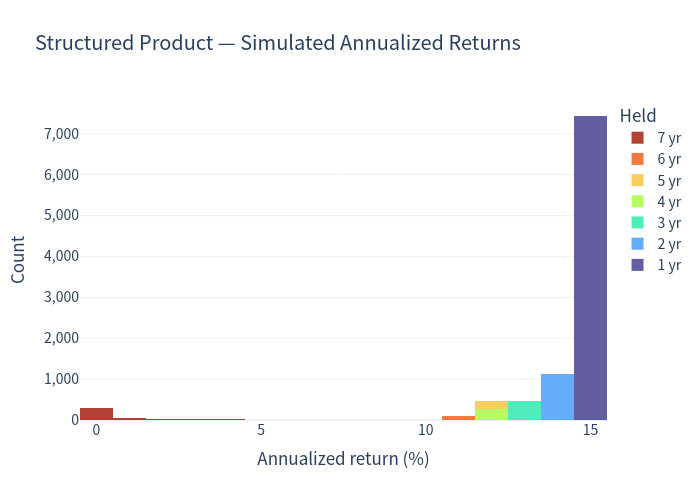
Structured product — annualized return distribution
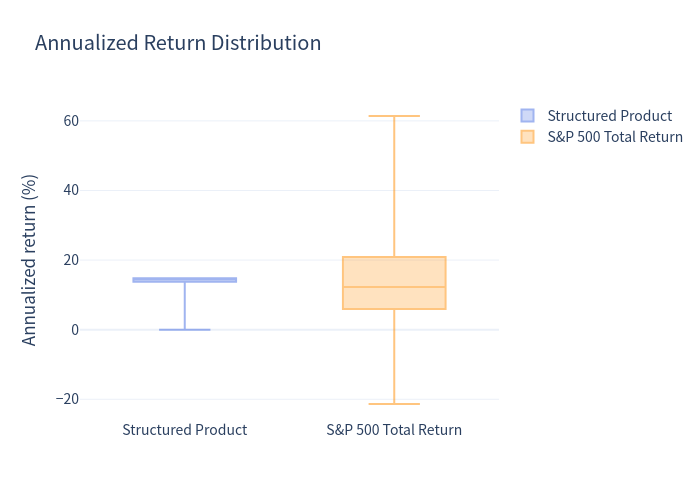
The distribution is highly concentrated: the vast majority of paths pay the fixed annual step-up (most commonly redeemed after year 1). The 0% bar is the principal-protected, never-called outcome.
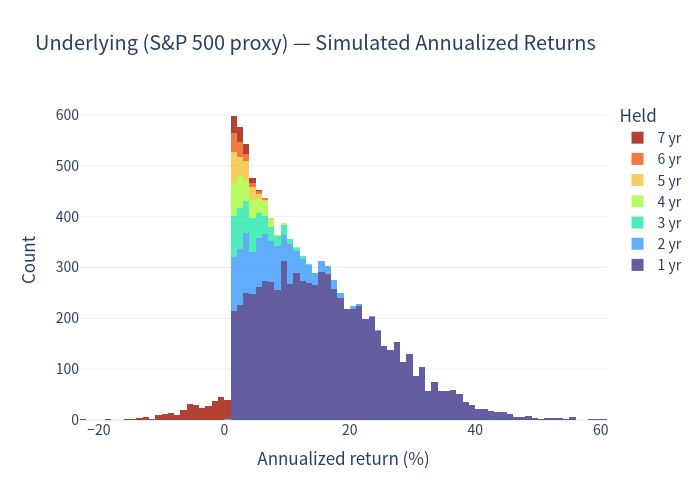
Underlying (S&P 500 proxy) — annualized return distribution
For comparison, the underlier spans a much wider range. Because most paths are held only one year before auto-call, these "annualized" figures are dominated by one-year return dispersion (σ ≈ 10.5%), reaching roughly −22% on the downside and +60% on the upside in the fat tails — genuine equity risk that the CD largely shields the investor from.
Scenario probabilities
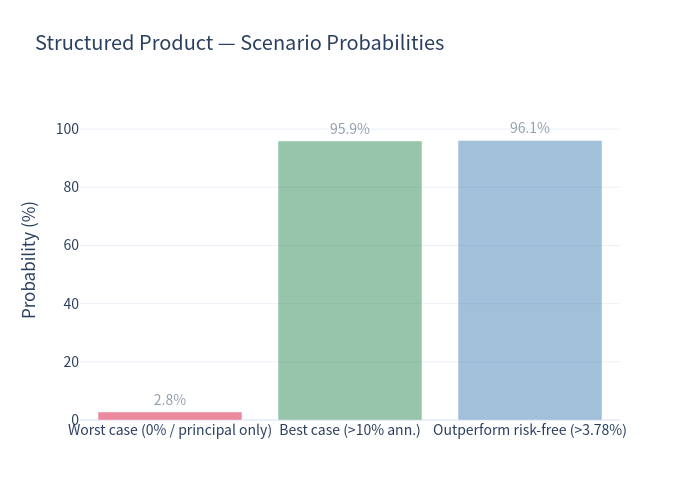
- Worst case (principal only, 0%): 2.76%
- Best case (>10% annualized): 95.93%
- Outperform the risk-free rate (3.78%): 96.12%
Risk / return comparison
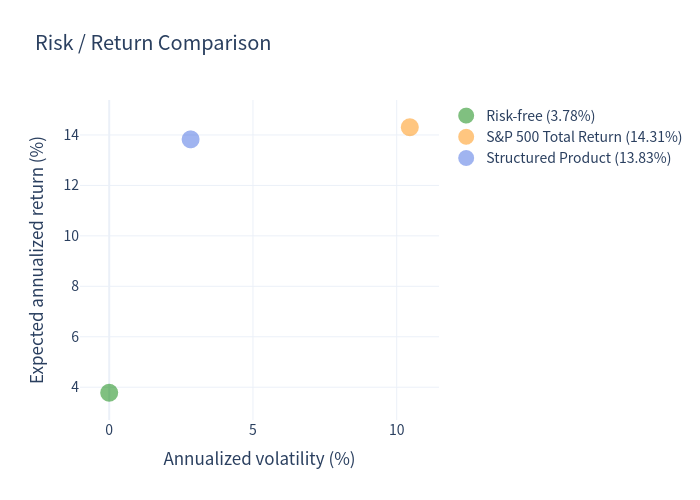
The structured product sits far to the left of the S&P 500 total return: nearly the same expected return with only about a quarter of the volatility.
Return distribution comparison
Holding-period distribution
Because the CD auto-calls on the first determination date the index clears its step-up threshold, the vast majority of paths are held only 1 year, with a small tail running to maturity.
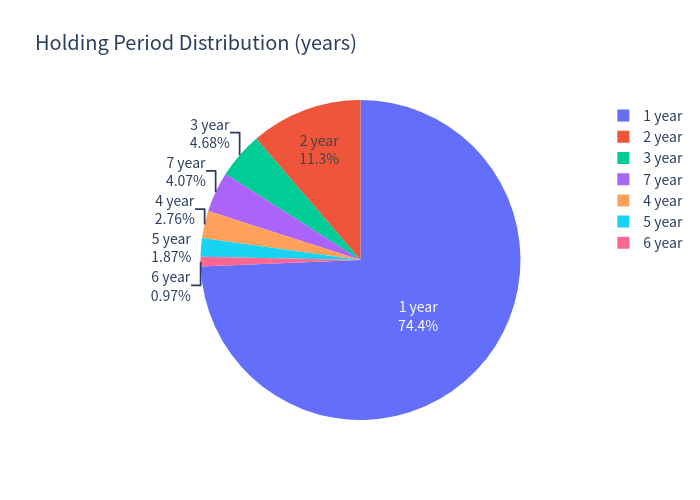
- Called after year 1: 74.35% | year 2: 11.30% | year 3: 4.68% | year 4: 2.76% | year 5: 1.87% | year 6: 0.97%
- Held all the way to maturity (year 7): 4.07%
Investment commentary
Pros
- Capital protection: the deposit amount is repaid at maturity even if the equity market falls — the worst simulated outcome is a 0% total return, never a loss of principal (credit/FDIC caveats aside).
- High, low-volatility fixed return: a ~14.75% per-annum step-up amount on early redemption, achieved with a simulated volatility of only 2.83%.
- Attractive risk-adjusted profile: the product matched the benchmark's expected return with roughly one-quarter of its volatility, and outperformed a ~3.78% risk-free rate in ~96% of simulations.
- Easy first trigger: with a year-1 threshold of just 101%, the CD is redeemed (locking in the 14.75% step-up) in the large majority of scenarios.
Cons / considerations
- Return is capped in up markets: on auto-call you receive the fixed step-up amount and give up any further equity upside; strong rallies are fully forgone.
- Opportunity cost: if the index drifts flat/down and the CD is never called, you earn 0% over up to 7 years, underperforming cash/T-bills.
- Long maximum tenor with no interim liquidity: if not called, funds are tied up to maturity; secondary market pricing may be unfavourable.
- Issuer credit risk on any amount above the FDIC insurance limit.
This analysis is a quantitative simulation for information purposes only and is not investment advice or a suitability assessment.