
Investment Analysis: 26.00% p.a. Multi Barrier Reverse Convertible (Worst-of) on Eli Lilly & Moderna
Headline Simulation Results
| Metric (annualized) | Result |
|---|---|
| Expected annualized return | 16.55% |
| Probability of a negative return | 17.20% |
| 99% confidence VaR (1-year) | -44.07% |
| Expected total return over realized holding period | 13.40% |
| Average holding period | 11.39 months |
Across 10,000 simulated scenarios the note most often delivers a coupon-and-par outcome, but carries a meaningful left tail: in roughly 1 in 6 paths the investor ends with a loss (driven by a barrier breach combined with a sharp decline in the worst-performing stock), and the 1%-worst outcome is around -44.07% annualized.
What This Product Is (in plain terms)
This is a yield-enhancement note linked to the worse of two US pharmaceutical/biotech stocks — Eli Lilly (LLY) and Moderna (MRNA). The investor collects a high 26% annual coupon (paid quarterly) in exchange for accepting downside risk on the two shares.
- Coupons are always paid while the note is alive (roughly USD 325 per USD 5,000 per quarter).
- Capital protection is conditional. If neither stock ever falls to or below 49% of its starting level during the note's life — i.e. no "barrier event" — the investor gets the full principal (par) back at maturity, plus all coupons.
- If a barrier event occurs (at least one stock trades at or below 49% at some point) and, at maturity, the worst stock is below its starting level, the investor does not get par — they receive that worst-performing stock (or its cash equivalent) at a value equal to its final percentage of the start. In other words, they absorb the loss below par.
- If the barrier is breached but the worst stock recovers to at or above its starting level by maturity, the investor still gets par back.
- The issuer may call the note early on any quarterly observation date (from ~6 months). When called, the investor receives par plus that period's coupon, and the note ends. Upside is capped at coupons + par — the investor never participates in a rally in the shares.
In short: the investor is paid a large coupon to sell downside protection on two volatile stocks, with a buffer down to 49% and a cap on all upside.
Key Risk & Return Statistics — Product vs. Benchmark
The benchmark is an equal-weight basket of LLY and MRNA (total return, i.e. including dividends), evaluated over the same holding period as each simulated note path.
| Metric | Structured Product | Underlying Basket (total return) |
|---|---|---|
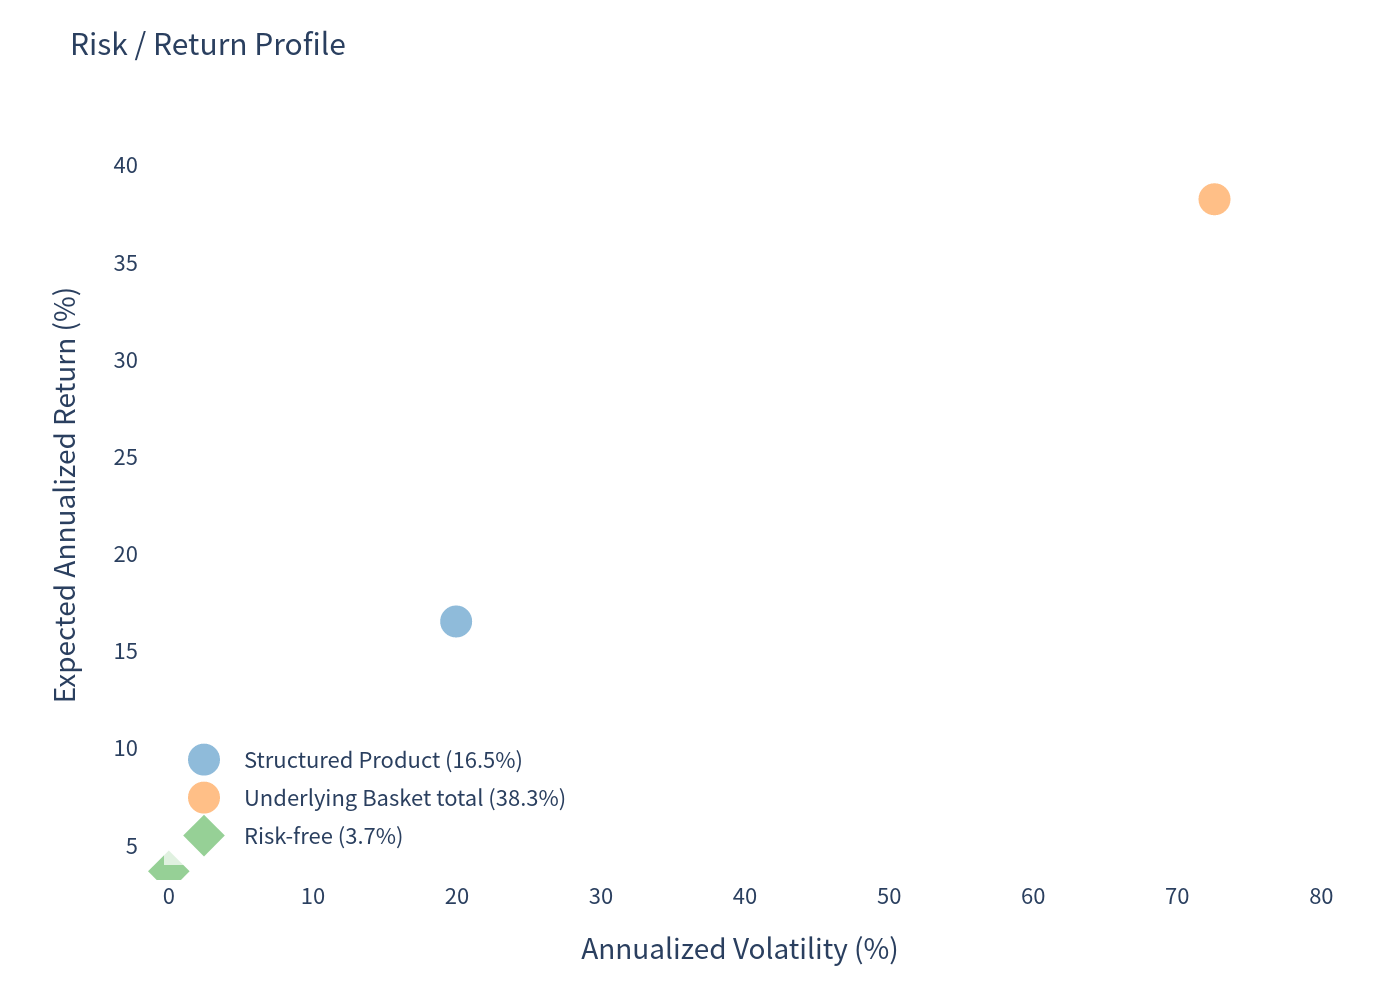
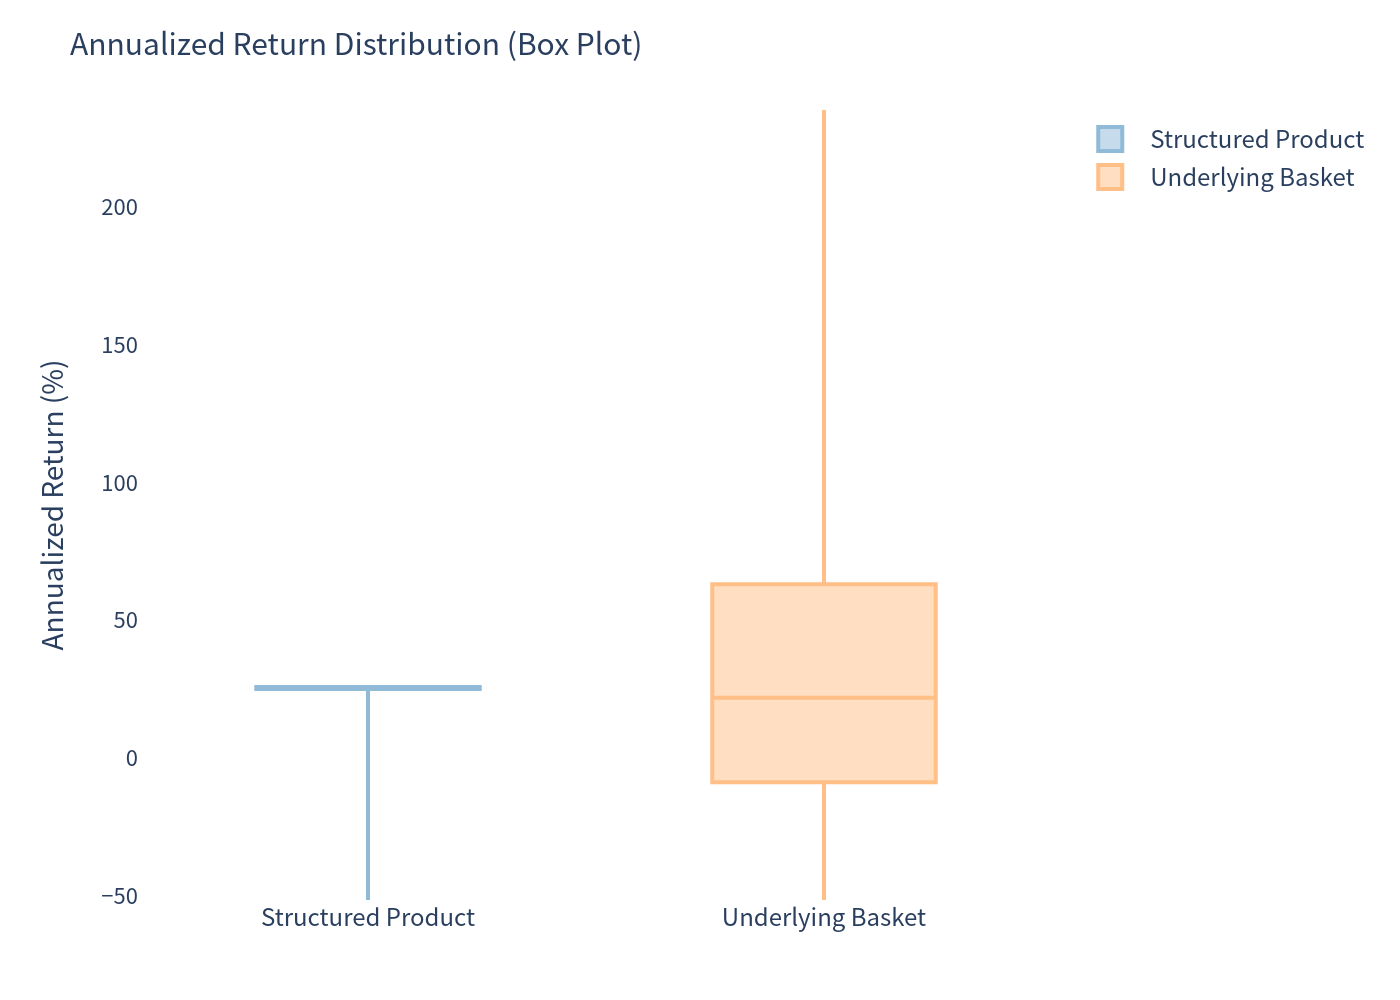
| Expected annualized return — mean | 16.55% | 38.27% |
| Expected annualized return — median | 25.25% | 22.30% |
| Expected annualized volatility | 19.95% | 72.59% |
| Probability of loss | 17.20% | 31.11% |
| 99% confidence VaR (1-year) | -44.07% | -48.48% |
| Mean total return over realized holding period | 13.40% | 23.99% |
| Risk-free rate (1-yr) | 3.69% | 3.69% |
Simulation Charts
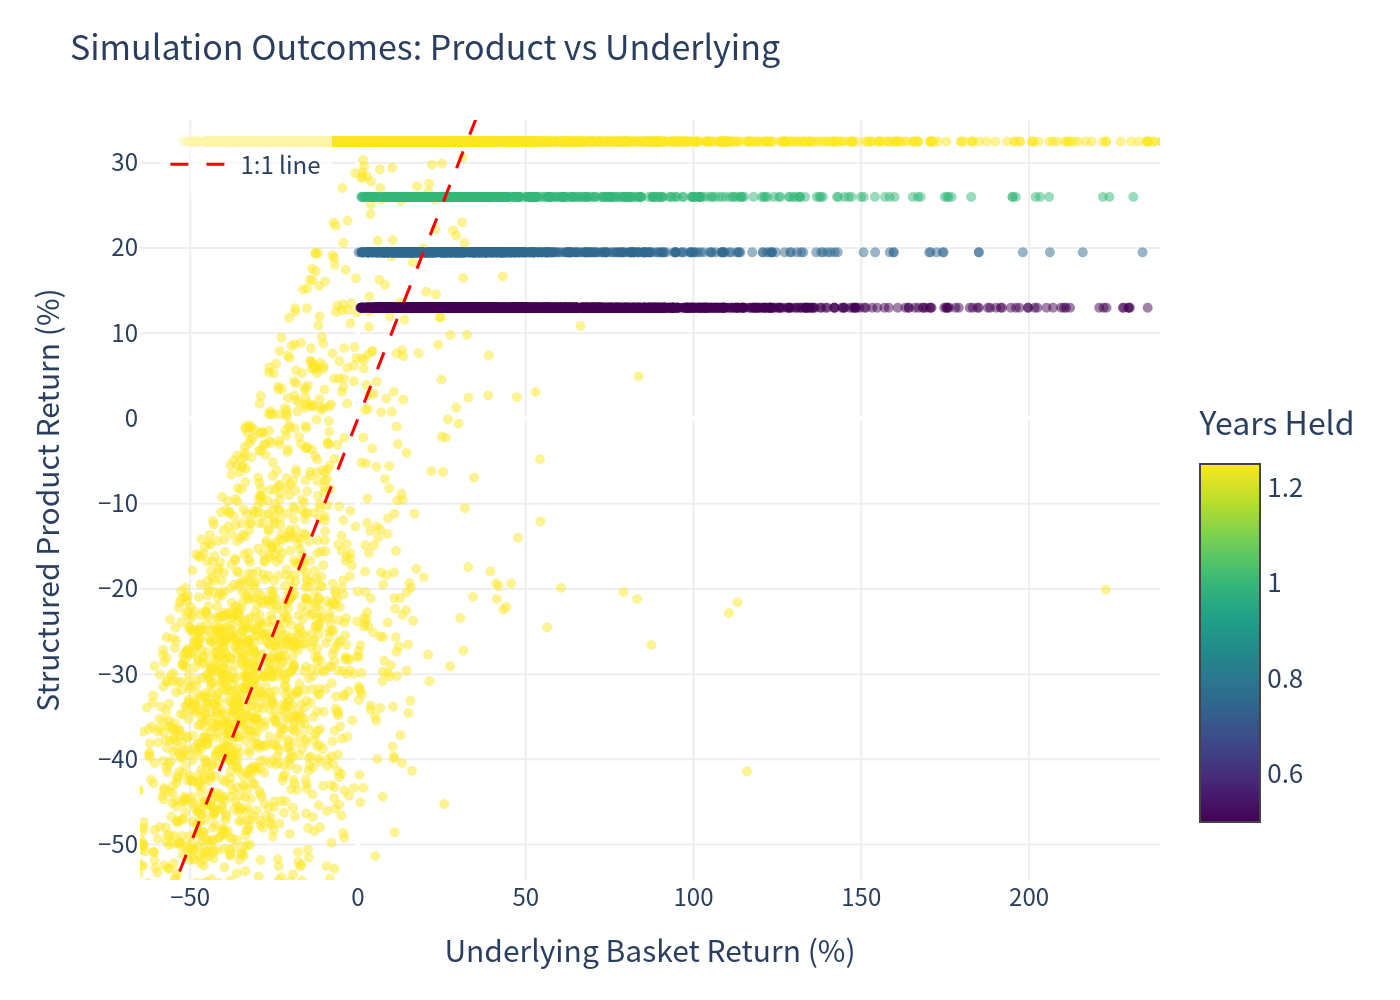
1. Outcome scatter — product vs. underlying (each dot = one scenario, total return)
Both axes show total return over the simulated holding period. The product's total return is capped (dots flatten near +30–35%, i.e. par plus the maximum coupon stack) no matter how far the basket rises, while it still participates in downside once the barrier is breached. Colour = years held.
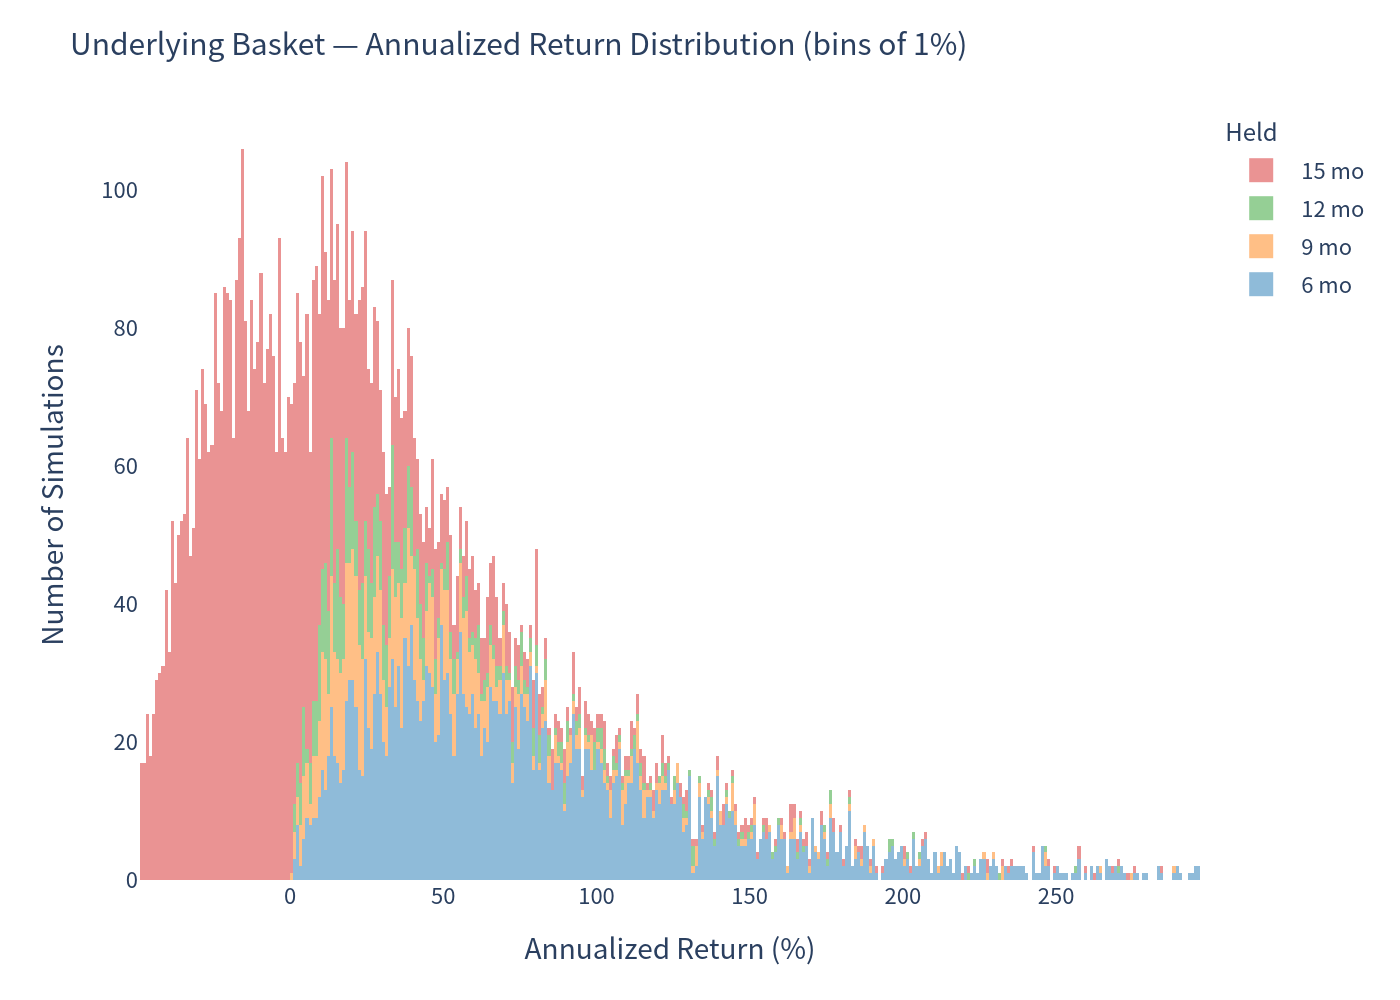
2. Distribution of annualized returns — Underlying basket
Very wide and right-skewed: the benchmark spans large losses to very large gains (1%–99% of paths fall roughly between −49% and +297% annualized).
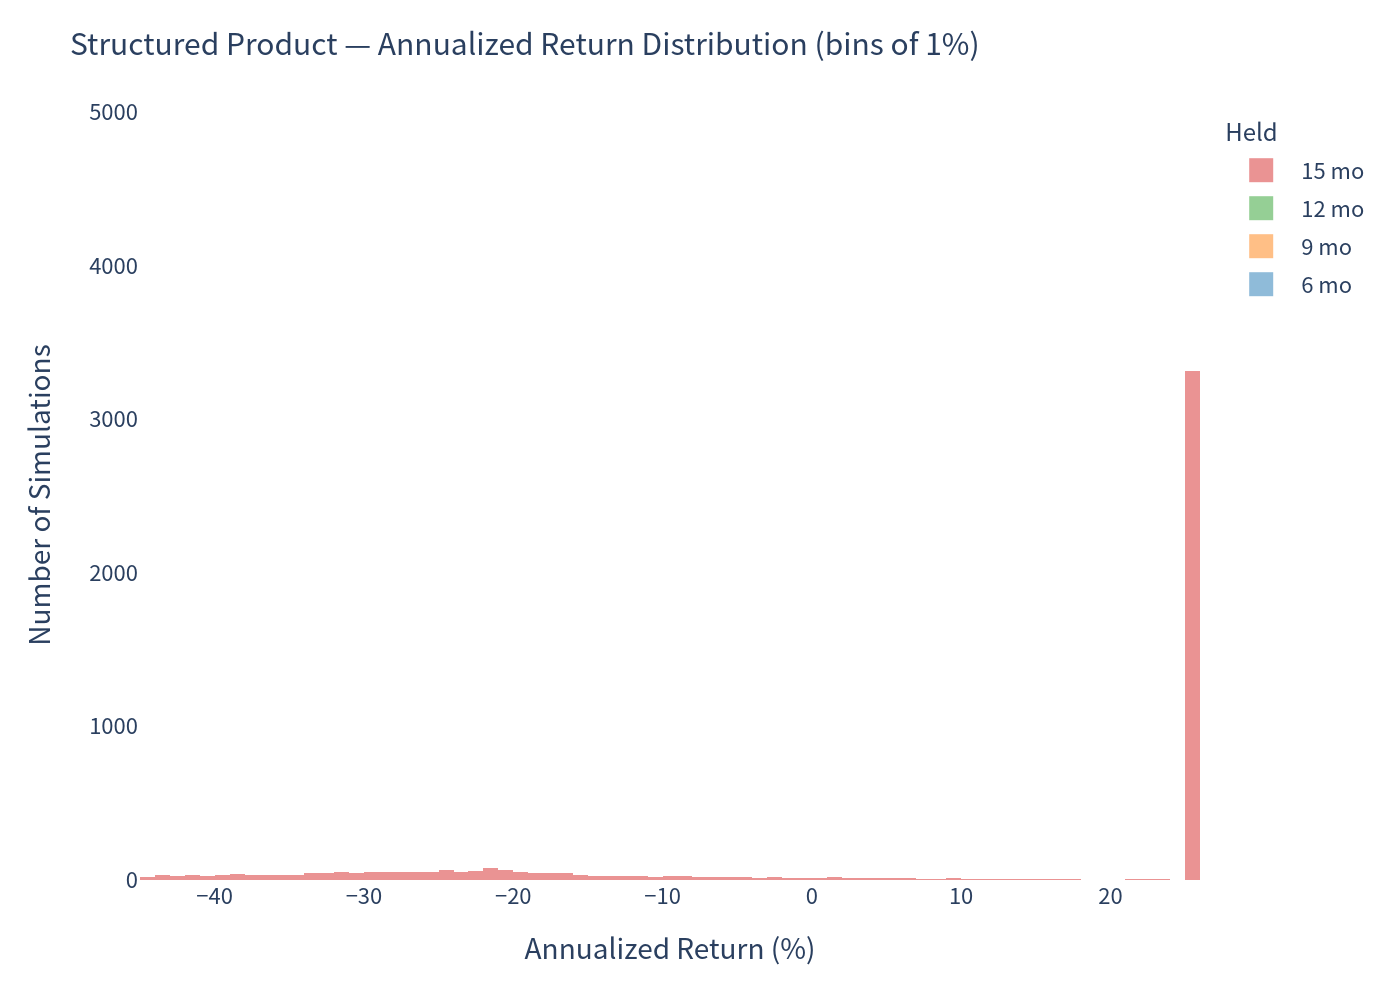
3. Distribution of annualized returns — Structured product
Much more concentrated: most outcomes cluster around a coupon-supported positive return, with a distinct left tail for barrier-breach/loss scenarios.
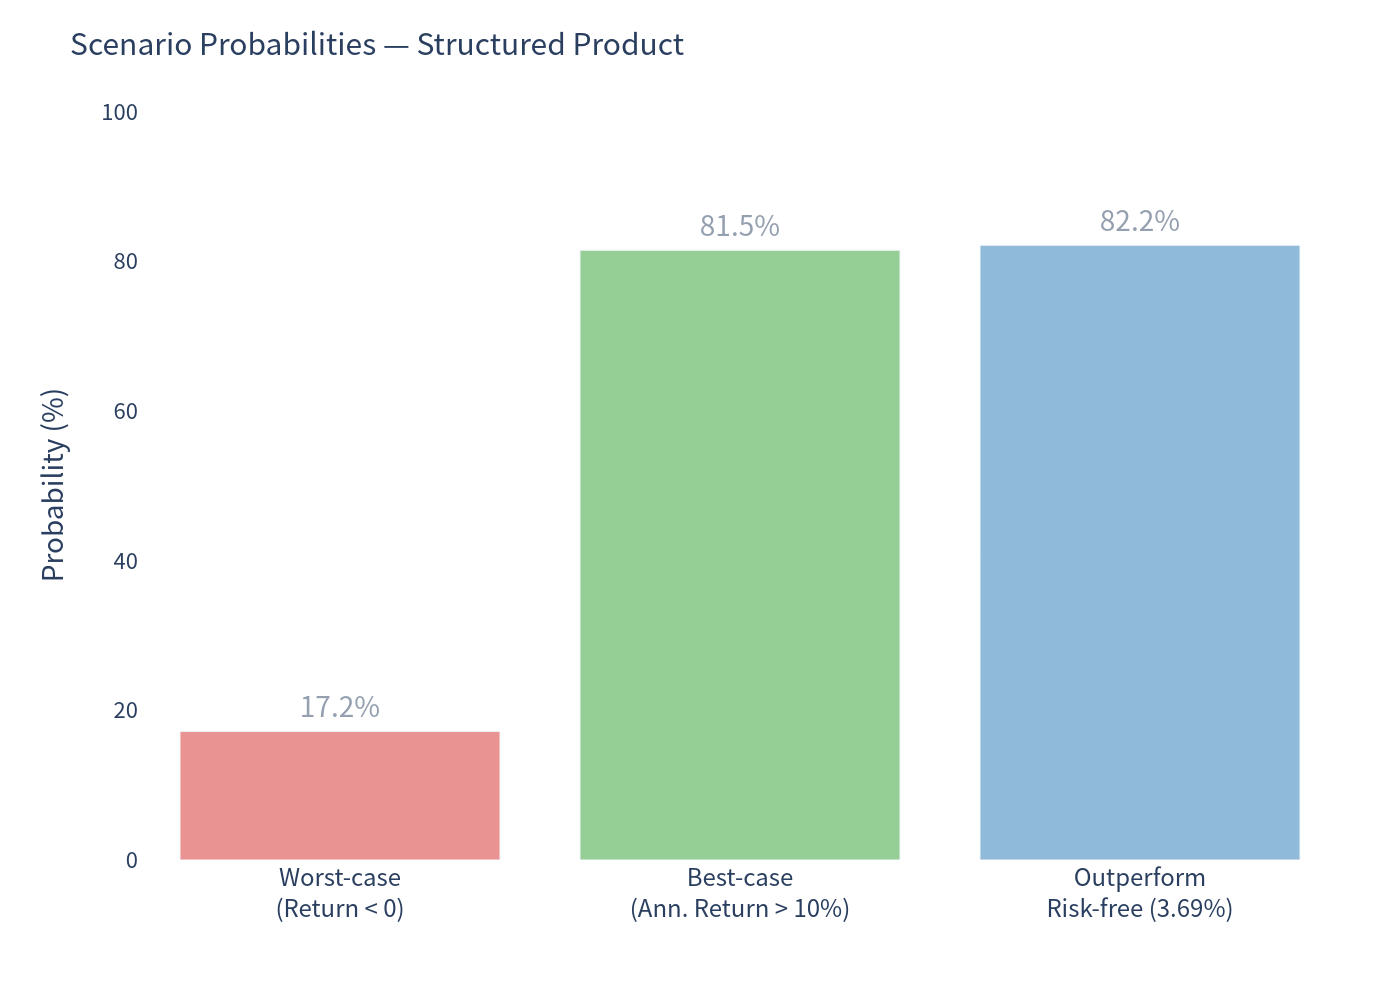
4. Scenario probabilities
- Worst-case (a loss) 17.20%
- Best-case (annualized return above 10%) 81.54%
- Beats the risk-free rate (3.69%) 82.21%
5. Risk / return profile
Relative to the underlying basket, the product sits at a markedly lower volatility with a comparable-or-better median return — but well below the basket's tail-driven mean.
6. Return distribution comparison (box plot)
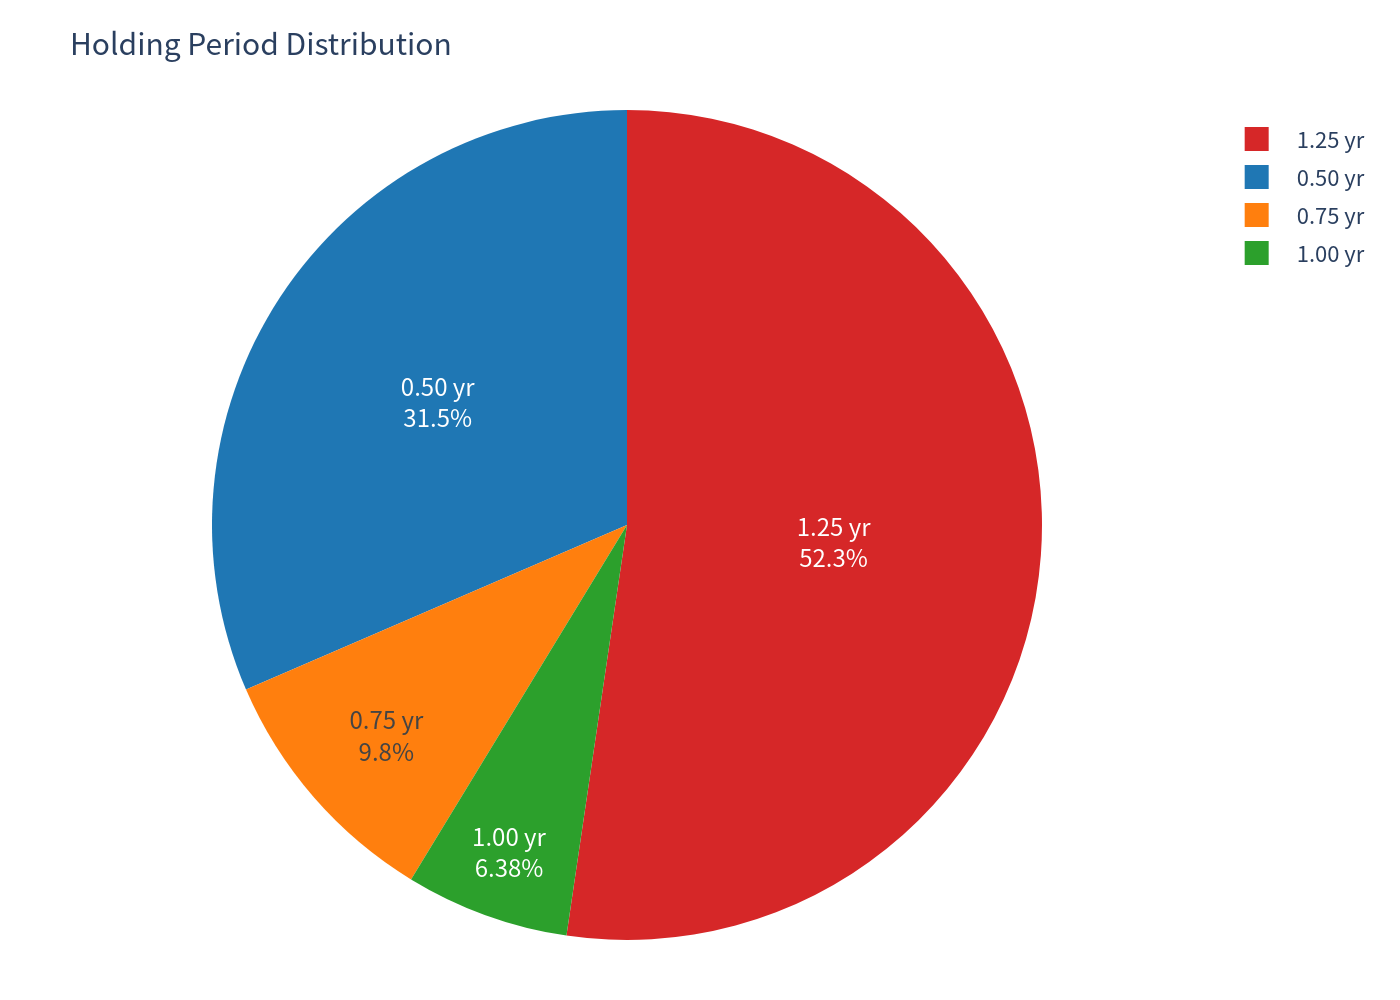
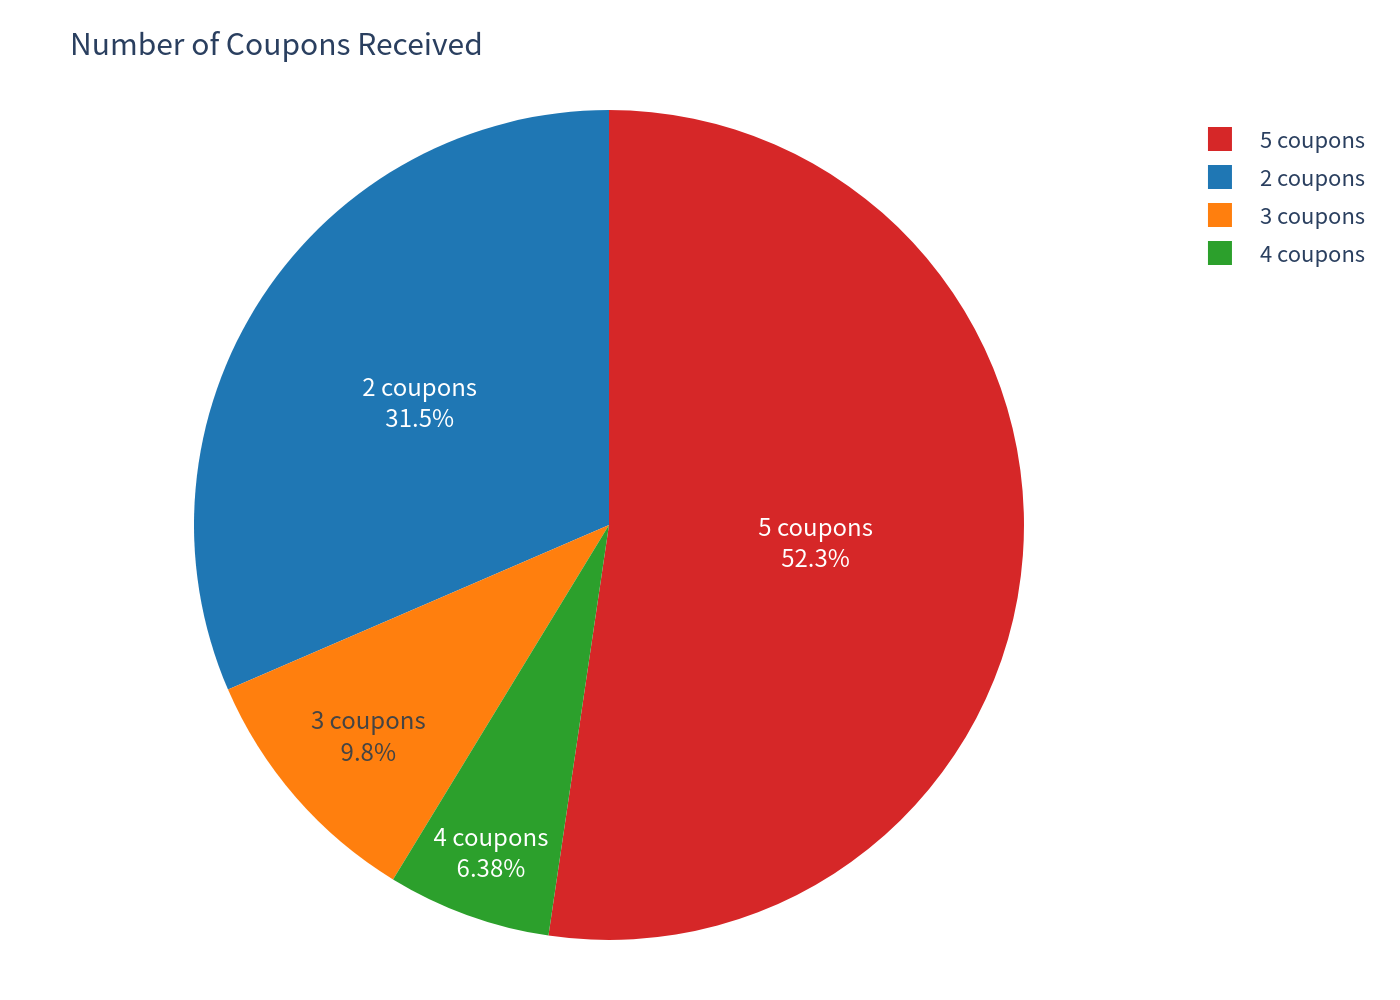
7. Holding-period and coupon-count probabilities
The issuer-call feature makes the holding period variable. Roughly 47.67% of paths are called early; the rest run to maturity.
Investment Commentary
Favourable characteristics observed in the simulation
- High, regular income. The 26% p.a. coupon is paid while the note is alive, and it is paid even in scenarios where the shares fall modestly — income is not contingent on performance.
- Conditional 49% buffer. A barrier as low as 49% means each stock can fall almost by half before principal is at risk. In the simulation, a barrier event occurred in only about 21.41% of paths, and a loss requires a breach to coincide with the worst stock finishing far enough below its start that the principal impairment exceeds the coupons collected.
- Lower volatility, smoother outcome. Annualized volatility of ~19.95% is far below the basket's ~72.59%, and the median outcome compares well to the underlying.
- Frequent early exit at par + coupon. In nearly half of scenarios the note is called within ~6–12 months, returning principal plus accrued coupons early, which lifts the realized annualized return.
Trade-offs to be aware of (characteristics, not advice)
- Upside is fully capped. Any rally beyond the coupons is forgone (product max ≈ +26% annualized vs the basket reaching +200%+ in its best paths).
- Negative convexity. The issuer calls in strong markets but keeps the note outstanding in weak ones — so the investor systematically stays exposed to the bad scenarios and is exited in the good ones.
- Worst-of exposure with a very volatile name. MRNA's volatility is historically several times LLY's, so the worst-of payoff is effectively dominated by MRNA's downside; a single sharp MRNA drawdown can push the note into a loss even if LLY performs well.
- Tail risk remains. The 99% VaR of about -44.07% shows that barrier-breach scenarios can produce substantial losses close to the worst stock's decline.