
Morgan Stanley Trigger PLUS due May 31, 2030 — Simulation Analysis
Linked to the worst-performing of the Russell 2000® Index (RTY) and the S&P 500® Index (SPX)
Headline Simulation Results
The notes pay no interest. Returns are driven entirely by the price performance of the worse-performing of the two indices at maturity (May 28, 2030), so the simulation shows a wide, asymmetric spread of outcomes: a leveraged upside when both indices rise, a flat "par" zone for small declines, and full downside (1% lost per 1% fall) once a barrier is breached.
Basic Product Information
| Item | Detail |
|---|---|
| Issuer / Guarantor | Morgan Stanley Finance LLC / Morgan Stanley |
| Underliers | Russell 2000® Index (RTY) and S&P 500® Index (SPX) — worst-of |
| Stated principal | $1,000 per security (USD) |
| Coupon | None |
| Term | ~4 years (issue May 29, 2026 → maturity May 31, 2030) |
| Leverage factor | 130% (term sheet range 130%–135%) |
| Downside threshold | 75% of each index's initial level |
| Early redemption | None |
| Upside cap | None |
How it works (plain language)
- Both indices up at maturity: you receive your principal plus 130% of the gain of the worse-performing index. The upside is uncapped.
- Small decline (worse performer between -25% and 0%): you simply get your principal back (par). This is the protective "buffer" zone.
- Worse performer down more than 25% (below 75% of its start): the buffer disappears and you lose 1% of principal for every 1% the worse index dropped — the loss can be very large.
Because the payoff references the worse of the two indices, a strong result in one index offers no help if the other falls below its barrier — there is no diversification benefit.
Key Risk / Return Statistics
| Metric | Structured Product | Underlying (Equal-Weight Basket, total return) |
|---|---|---|
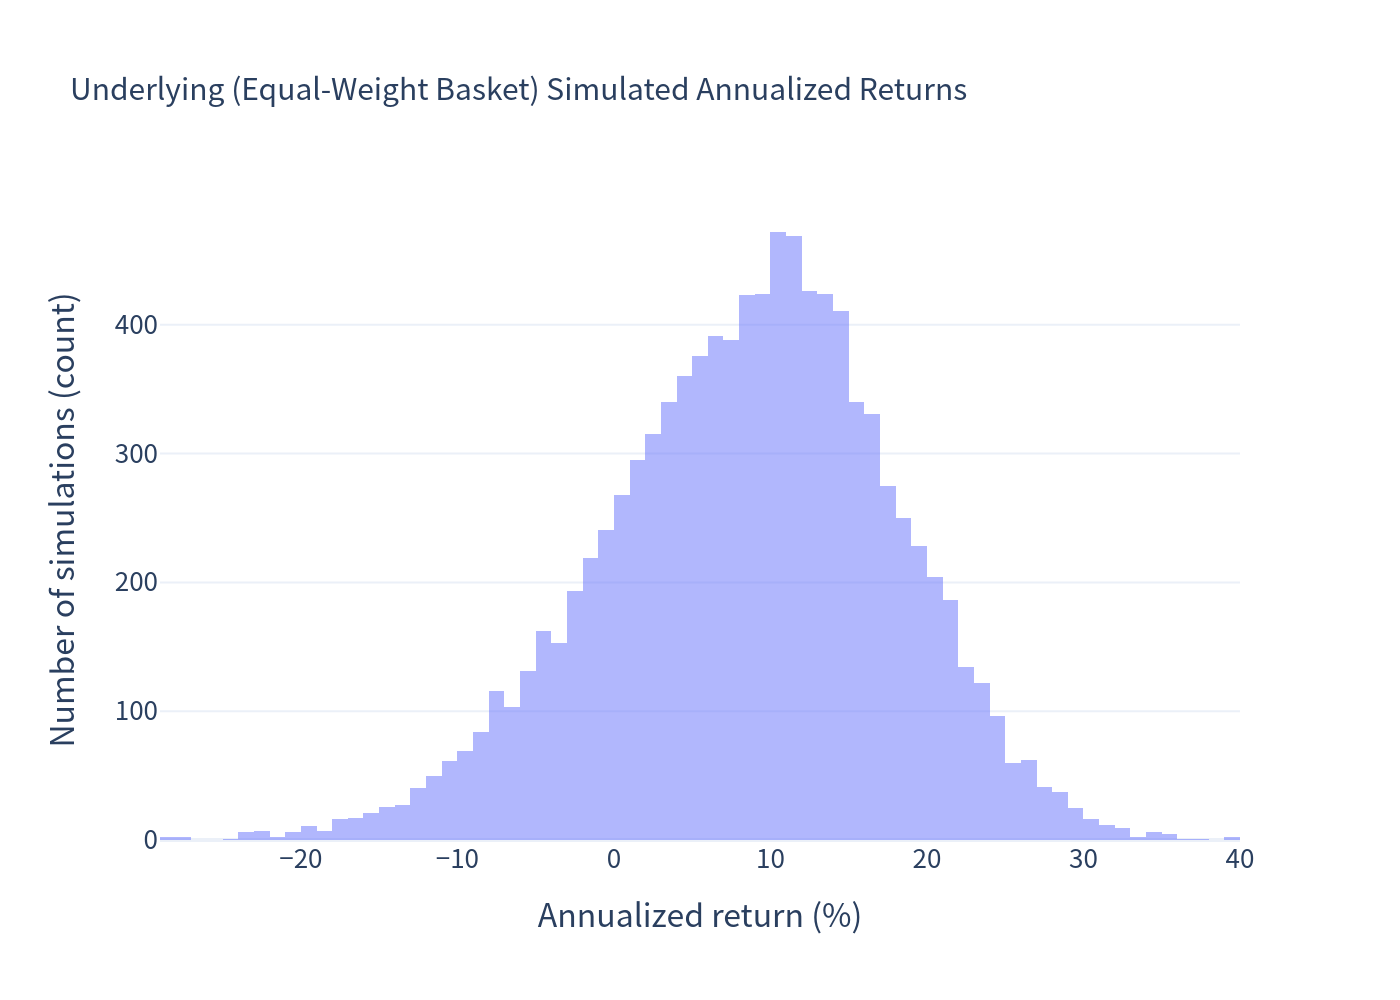
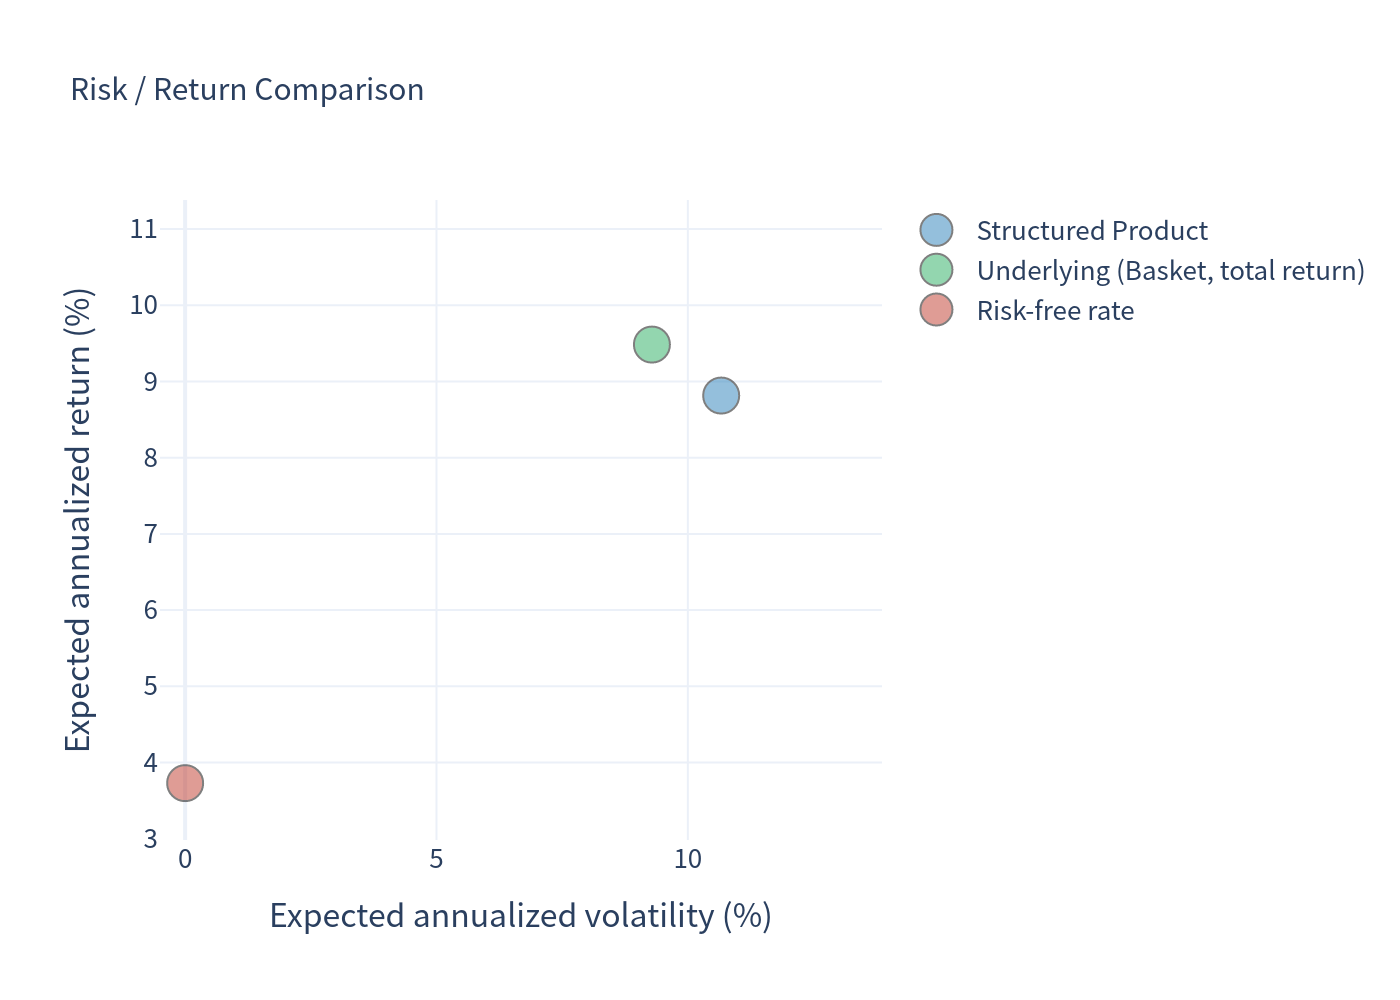
| Expected annualized return | 8.82% | 9.48% |
| Expected annualized volatility | 10.66% | 9.29% |
| Probability of loss | 9.17% | 17.09% |
| 99% confidence VaR (1-year) | -18.19% | -13.97% |
The underlying benchmark is an equal-weight buy-and-hold basket of the two indices, with dividends included (basket dividend yield ≈ 0.94%) and no volatility scaling.
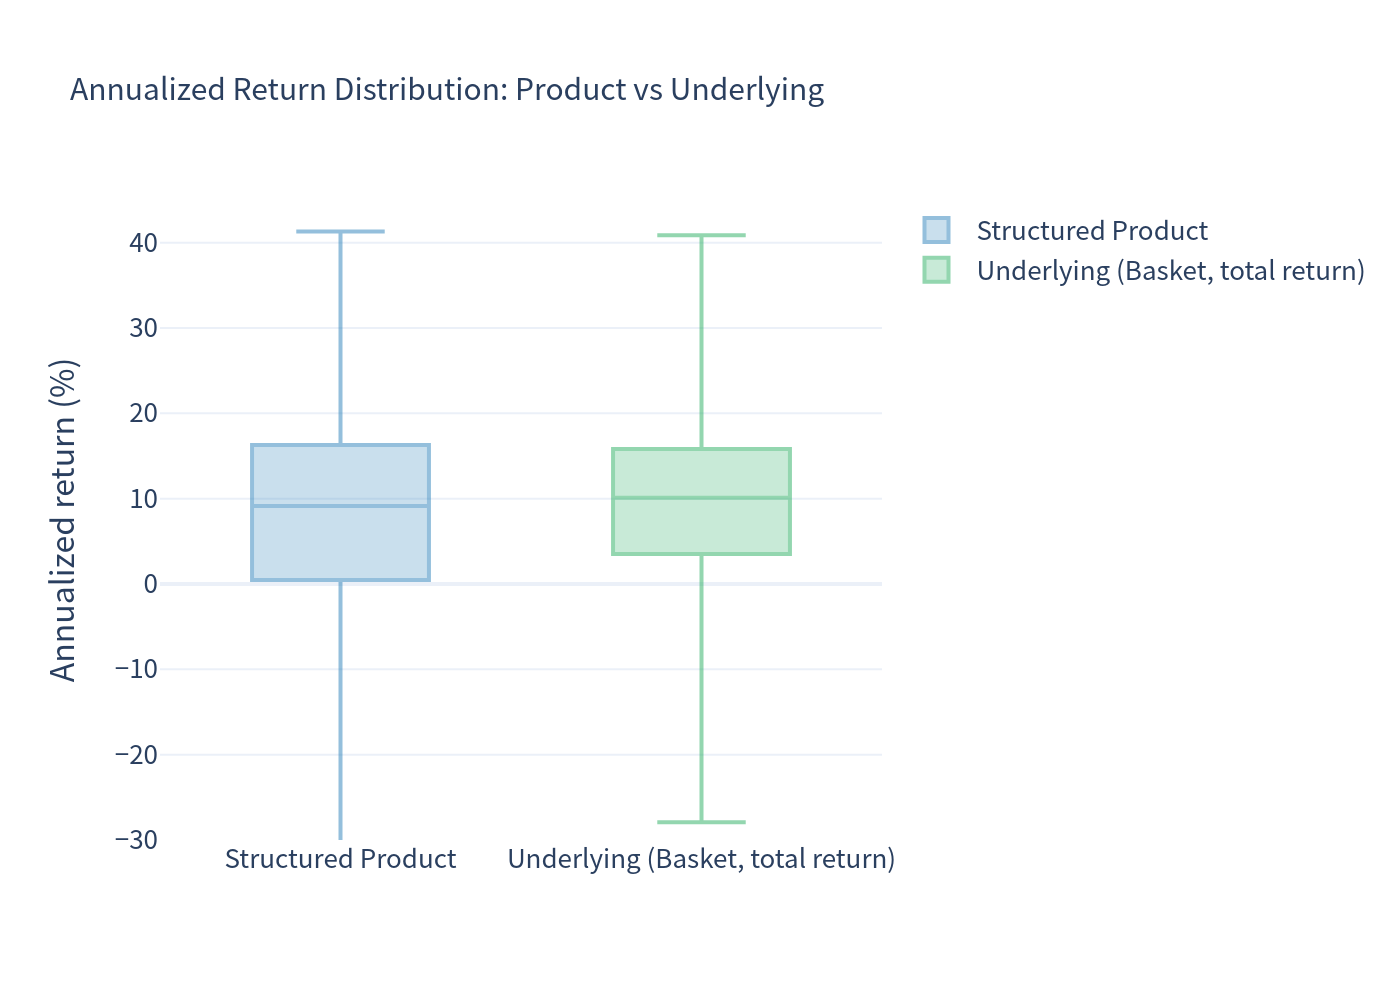
Interpretation. The notes trade a lower expected return (8.82% vs 9.48%) for a lower day-to-day probability of loss (9.17% vs 17.09%), thanks to the 25% buffer. However, the buffer is illusory in the tail: the 1%-for-1% downside beyond the barrier makes the 99% VaR worse than the underlying (-18.19% vs -13.97%), and the worst simulated outcome was a -76.4% total loss. Volatility is also higher than the basket (10.66% vs 9.29%) because of the worst-of construction plus leverage.
Outcome branch frequencies (10,000 simulations)
| Scenario | Probability |
|---|---|
| Leveraged upside (both indices above initial) | 75.88% |
| Par (buffer zone, -25% to 0% on the worse index) | 14.95% |
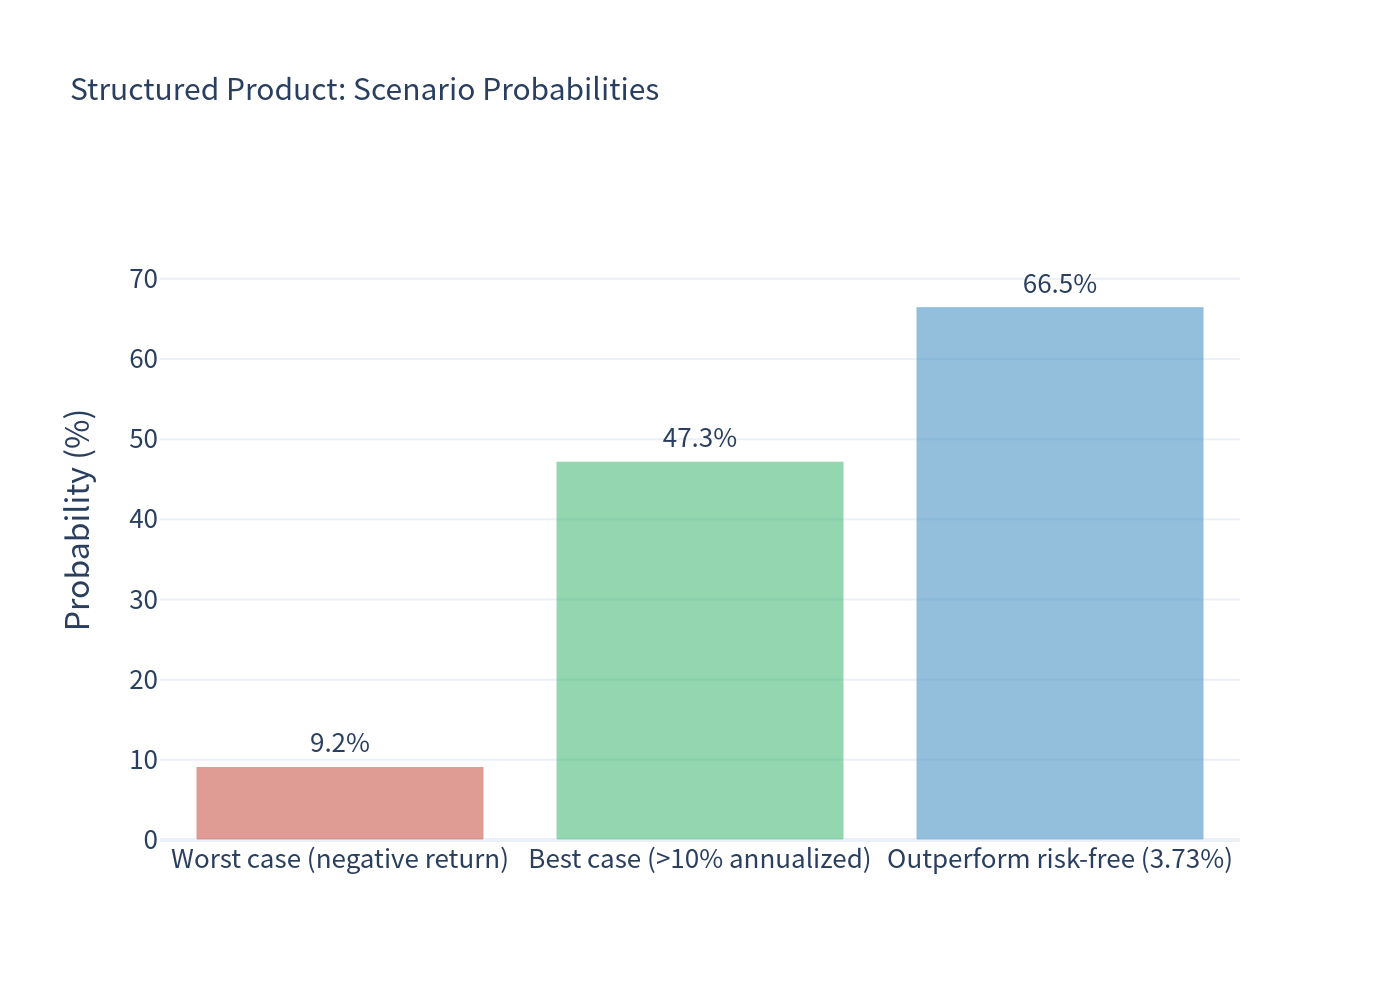
| Loss (barrier breached, worse index < 75% of initial) | 9.17% |
Charts
Simulated product outcome vs underlying outcome
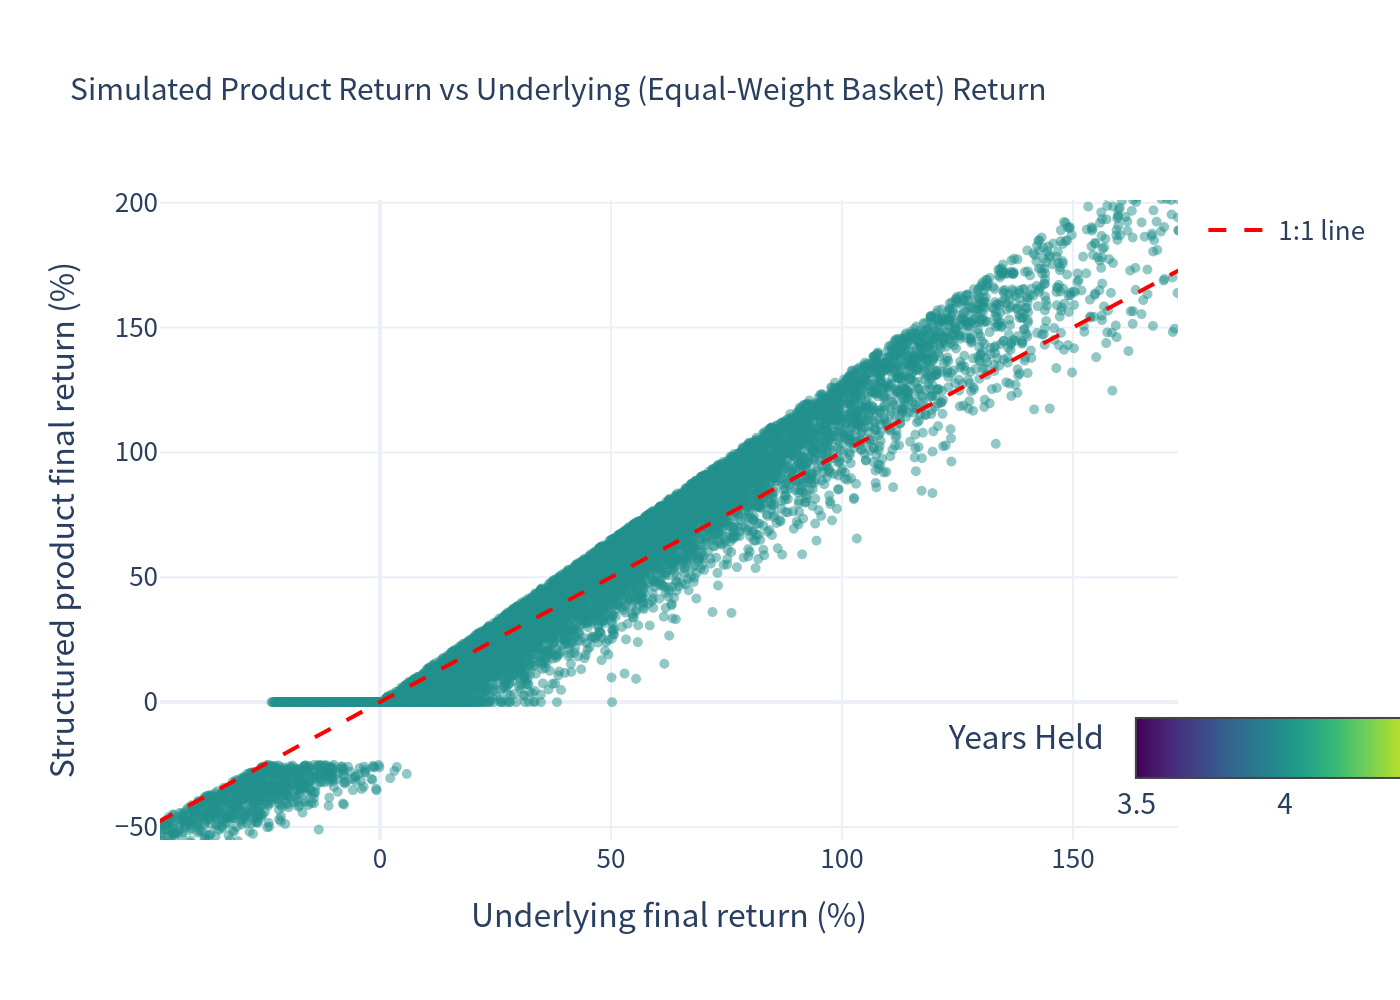
Points below the 1:1 line cluster where the product's leverage and buffer interact; deep in the lower-left, the loss branch drags results well below a direct basket holding.
Distribution of underlying annualized returns
Distribution of structured product annualized returns
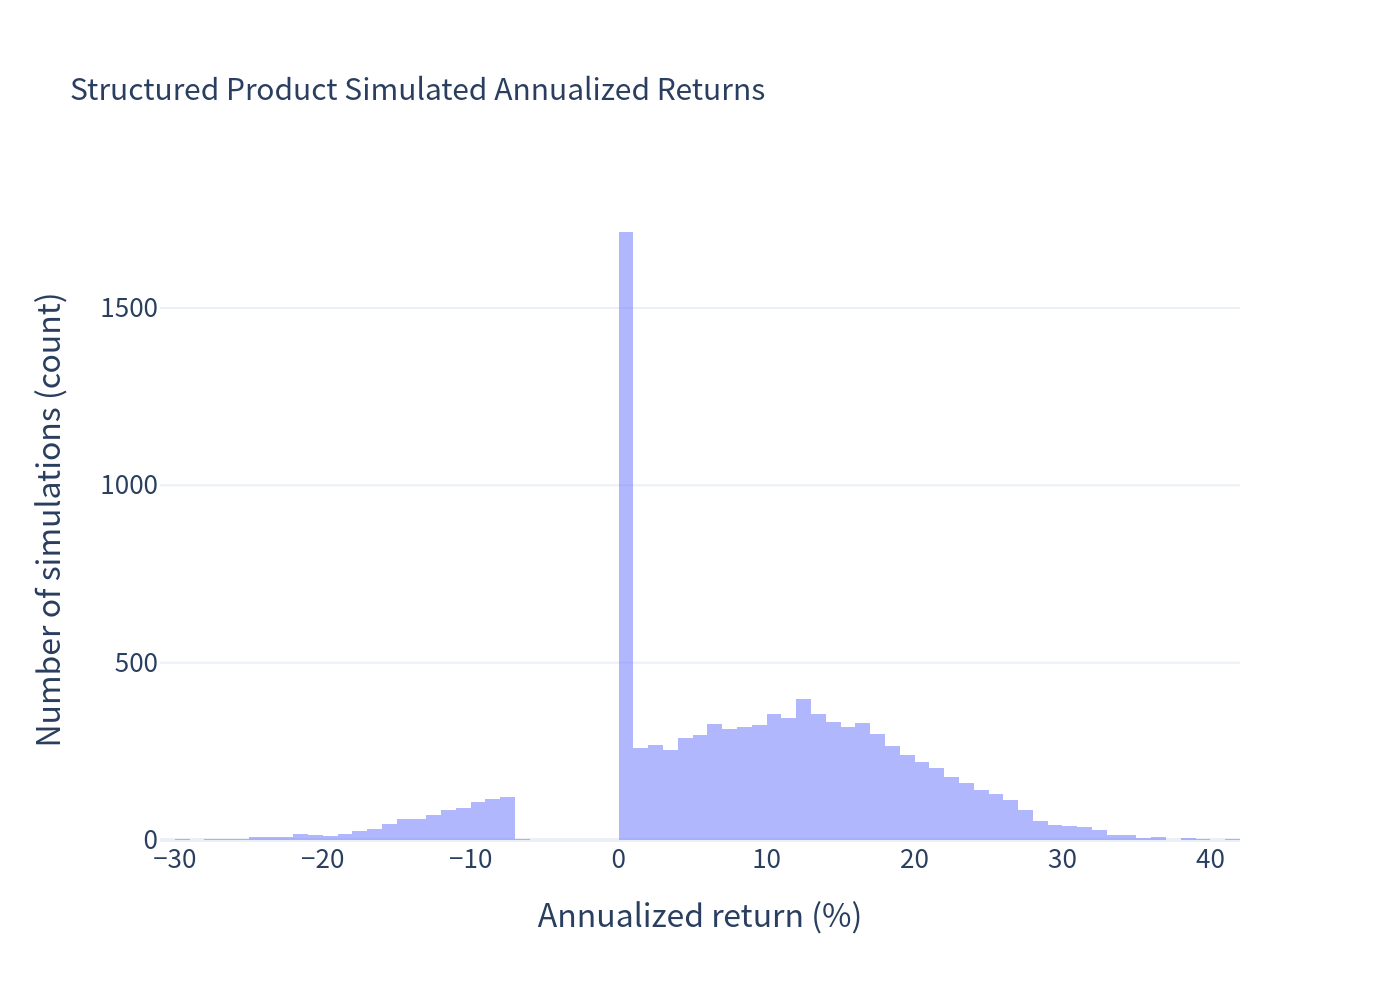
The product's histogram shows a spike at 0% (the par/buffer zone) alongside a heavy left tail from the barrier-breach branch — a shape that is very different from the smoother underlying distribution.
Scenario probabilities
Risk / return comparison
Annualized return box plot
Investment Commentary
Potential positives
- Uncapped, leveraged upside: participation in the worse-performing index is scaled up 1.30× (up to 1.35×), which is attractive if both indices rise together.
- 25% buffer zone: declines of up to 25% in the worse index still return principal at maturity — a meaningful cushion in mild pullbacks.
- Favorable probability of beating cash: roughly two-thirds of simulated paths (66.53%) annualized above the ~3.73% risk-free rate.
Points of caution
- Worst-of drag: the payoff is only as good as the weaker index; one lagging index erases the benefit of the other, so expected return is below the equal-weight basket.
- Discontinuous payoff / tail risk: the 99% VaR (-18.19%) and worst-case (-76.4%) are worse than a direct holding, because below the 75% barrier the note takes the full 1%-for-1% loss with no floor.
- No income and full principal risk: there are no coupons, and principal can be lost entirely; the term-sheet estimated value (~$938.30) already reflects upfront costs.
Simulation-based analysis; figures are model estimates, not guarantees. This material is for information only and is not investment advice.
Note on annualization: the "expected total return" (48.19%) is the average of the per-path 4-year total returns, while the "expected annualized return" (8.82%) is the average of the per-path annualized (CAGR) figures. Because annualizing is a concave transformation, the average CAGR is legitimately below the CAGR of the average total return; both figures are correct.