
Structured Product Analysis Report
Headline Simulation Results
Basic Product Information
Product Type
This is a Multi Barrier Reverse Convertible (SSPA Type 1230) issued in CHF, linked to three Swiss stocks:
- Banque Cantonale Vaudoise (BCVN)
- Partners Group Holding AG (PGHN)
- UBS Group AG (UBSG)
How It Works
- The product pays a fixed 9.20% p.a. coupon in quarterly installments (2.30% per payment), regardless of underlying performance.
- The Issuer has the right to call the product quarterly from month 6 onwards, returning the full denomination plus the coupon for that period.
- If held to maturity (18 months), redemption depends on two conditions:
- No Barrier Event (all underlyings stayed above 55% of initial): Investor receives full denomination.
- Barrier Event occurred (at least one underlying touched 55% or below):
- If the worst-performing underlying at maturity is below strike (100%): Investor receives physical shares worth less than the initial investment.
- If the worst performer is at or above strike: Investor receives full denomination.
- The payoff depends on the worst performance among the three underlyings.
Key Terms
| Parameter | Value |
|---|---|
| Currency | CHF |
| Denomination | CHF 1,000 per product |
| Coupon Rate | 9.20% p.a. (quarterly) |
| Barrier Level | 55% of Initial Fixing |
| Strike Level | 100% of Initial Fixing |
| Maturity | 18 months (28 Jan 2028) |
| Issuer Callable | Yes (quarterly from month 6) |
Key Statistics
Structured Product vs. Benchmark (Equal-Weight Basket of 3 Stocks with Dividends)
| Metric | Structured Product | Benchmark (Basket) |
|---|---|---|
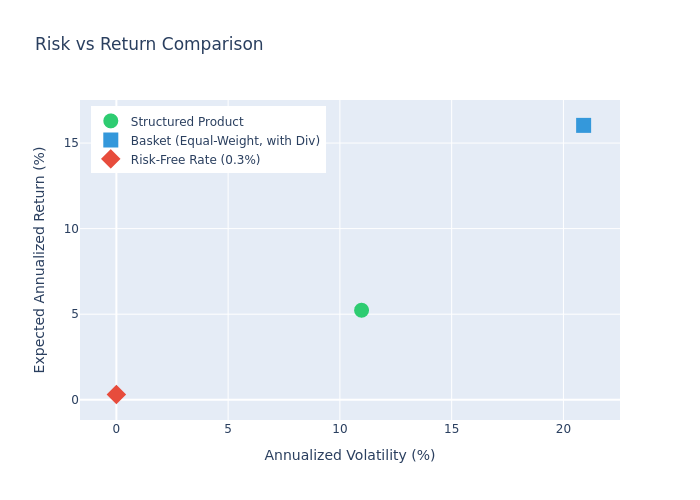
| Expected Annualized Return | 5.23% | 16.03% |
| Expected Annualized Volatility | 10.97% | 20.90% |
| Probability of Loss | 11.65% | 23.50% |
| 99% Confidence VaR (1 year) | -34.34% | -21.22% |
Holding Period Distribution
| Outcome | Probability |
|---|---|
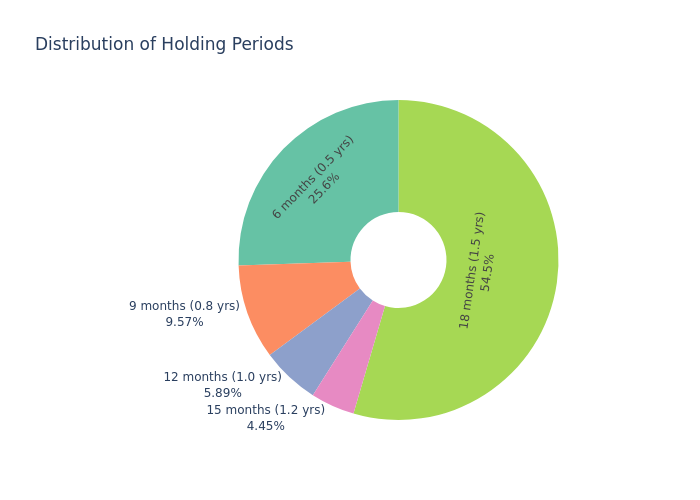
| Called at Month 6 | 25.6% |
| Called at Month 9 | 9.6% |
| Called at Month 12 | 5.9% |
| Called at Month 15 | 4.5% |
| Held to Maturity (Month 18) | 54.5% |
| Expected Holding Period | 13.6 months |
Maturity Redemption Breakdown (for 54.5% held to maturity)
| Scenario | Probability | Description |
|---|---|---|
| No Barrier Event | 42.8% | Receive full denomination |
| Barrier Event + Worst < Strike | 11.7% | Receive physical shares (avg value ~52.87) |
| Barrier Event + Worst >= Strike | 0.0% | Receive full denomination |
Coupon Statistics
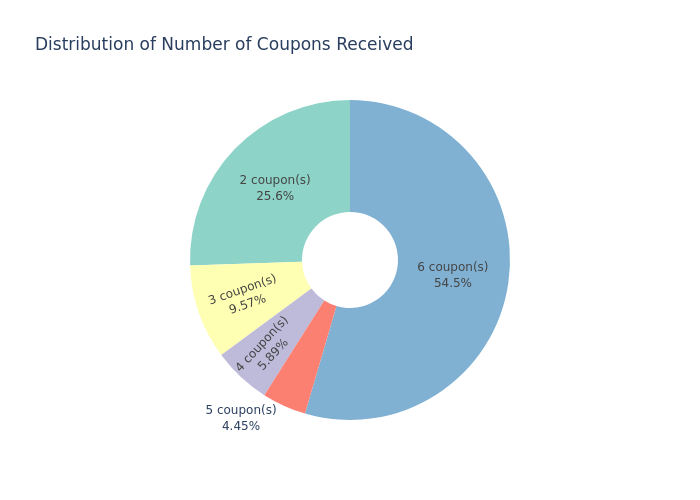
- Expected Number of Coupons Received: 4.5 out of 6 possible
- Expected Total Coupons: 10.42 index points (on 100 notional)
Charts
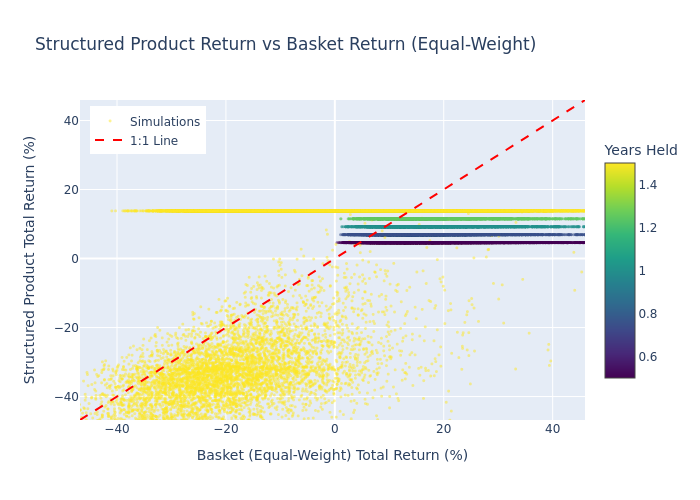
Scatter Plot: Structured Product vs. Basket Return
Each point represents one simulation. The 1:1 line shows where product return equals benchmark return. Color indicates holding period.
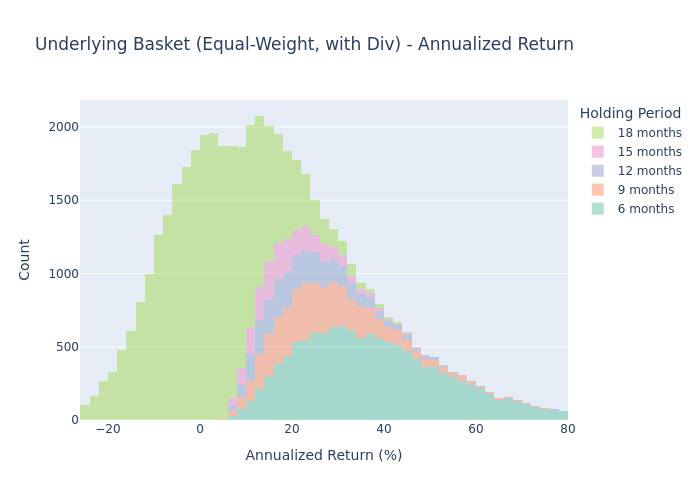
Histogram: Underlying Basket Annualized Returns
Distribution of annualized returns for the equal-weight basket of the three underlyings.
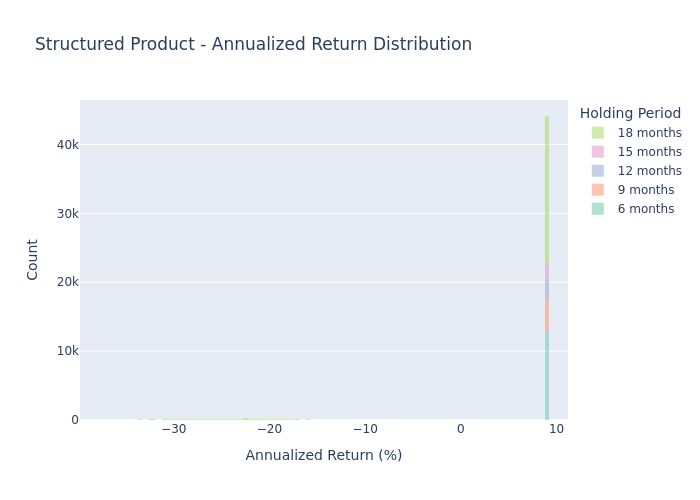
Histogram: Structured Product Annualized Returns
Distribution of annualized returns for the structured product across all simulated paths.
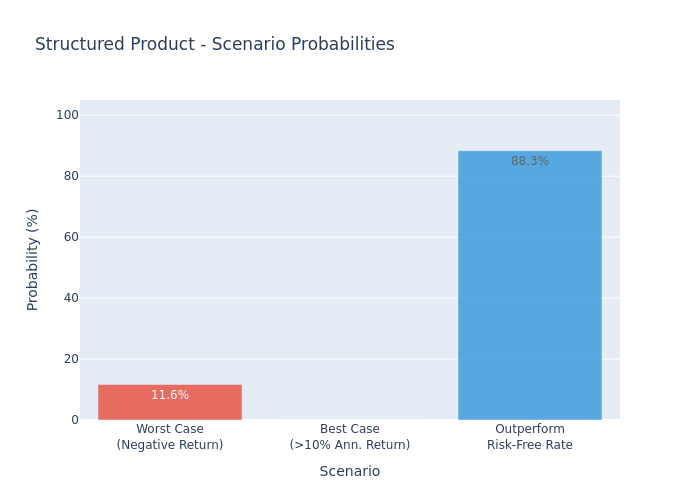
Scenario Probabilities
Breakdown of key outcome scenarios across all simulations.
Risk/Return Comparison
Risk (volatility) vs. return (annualized) comparison between the structured product and the benchmark basket.
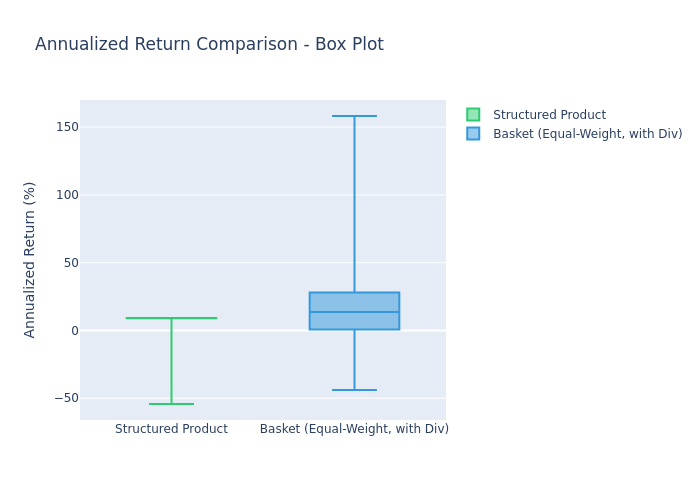
Box Plot Comparison
Distribution comparison of annualized returns for the structured product and the benchmark basket.
Holding Period Distribution
Proportion of simulations resulting in each call date or maturity.
Coupons Received Distribution
Distribution of the number of coupon payments received across all simulations.
Investment Commentary
Key Strengths
- High coupon income: 9.20% p.a. paid quarterly, significantly above the risk-free rate (~0.3%).
- Downside protection: Capital is protected down to the 55% barrier level as long as no underlying breaches it.
- Low probability of loss: Only ~11.7% chance of negative annualized return.
- High probability of positive outcome: ~88.4% of simulations result in outperformance of the risk-free rate.
Key Risks
- Issuer call risk: The issuer can call the product early (25.6% called at month 6), potentially limiting total coupon income.
- Barrier risk: If any underlying falls below 55%, the capital protection is lost. At maturity, ~11.7% of simulations resulted in physical delivery of shares worth substantially less than the initial investment (average value of 52.87 on 100 notional).
- Worst-of structure: The payoff depends on the worst-performing underlying, making it significantly riskier than investing in a single stock or an equal-weight basket.
- Capped upside: Returns are capped at the coupon rate, so the product does not participate in strong market rallies.
- Credit risk: The product is an unsecured debt obligation of the issuer (Leonteq Securities AG, rated BBB-).
Important Notes
- The analysis is based on 50,000 Monte Carlo simulation paths using GJR-GARCH(1,1) with Student's t distribution.
- The risk-free rate used is 0.30% p.a. (based on Swiss government bond yields).
- Dividend yields used for the benchmark basket: BCVN 3.47%, Partners Group 6.80%, UBS 2.05%.
- All returns are in CHF; no currency hedging is considered.
- Fees and commissions are excluded from the analysis.
- Past performance and historical volatility are not guarantees of future results.