
MSAMP5 Step-Up Jump Notes with Auto-Callable Feature — Investment Analysis
Headline Results
| Indicator | Value |
|---|---|
| Expected annualized return | 13.89% |
| Probability of a negative return | 0.00% |
| 99% confidence VaR (1-year, annualized) | +1.00% |
| Expected holding period | 1.31 years (16 months) |
| Expected total return over realized holding period | 17.44% |
| Auto-called within the first year | 84.70% of scenarios |
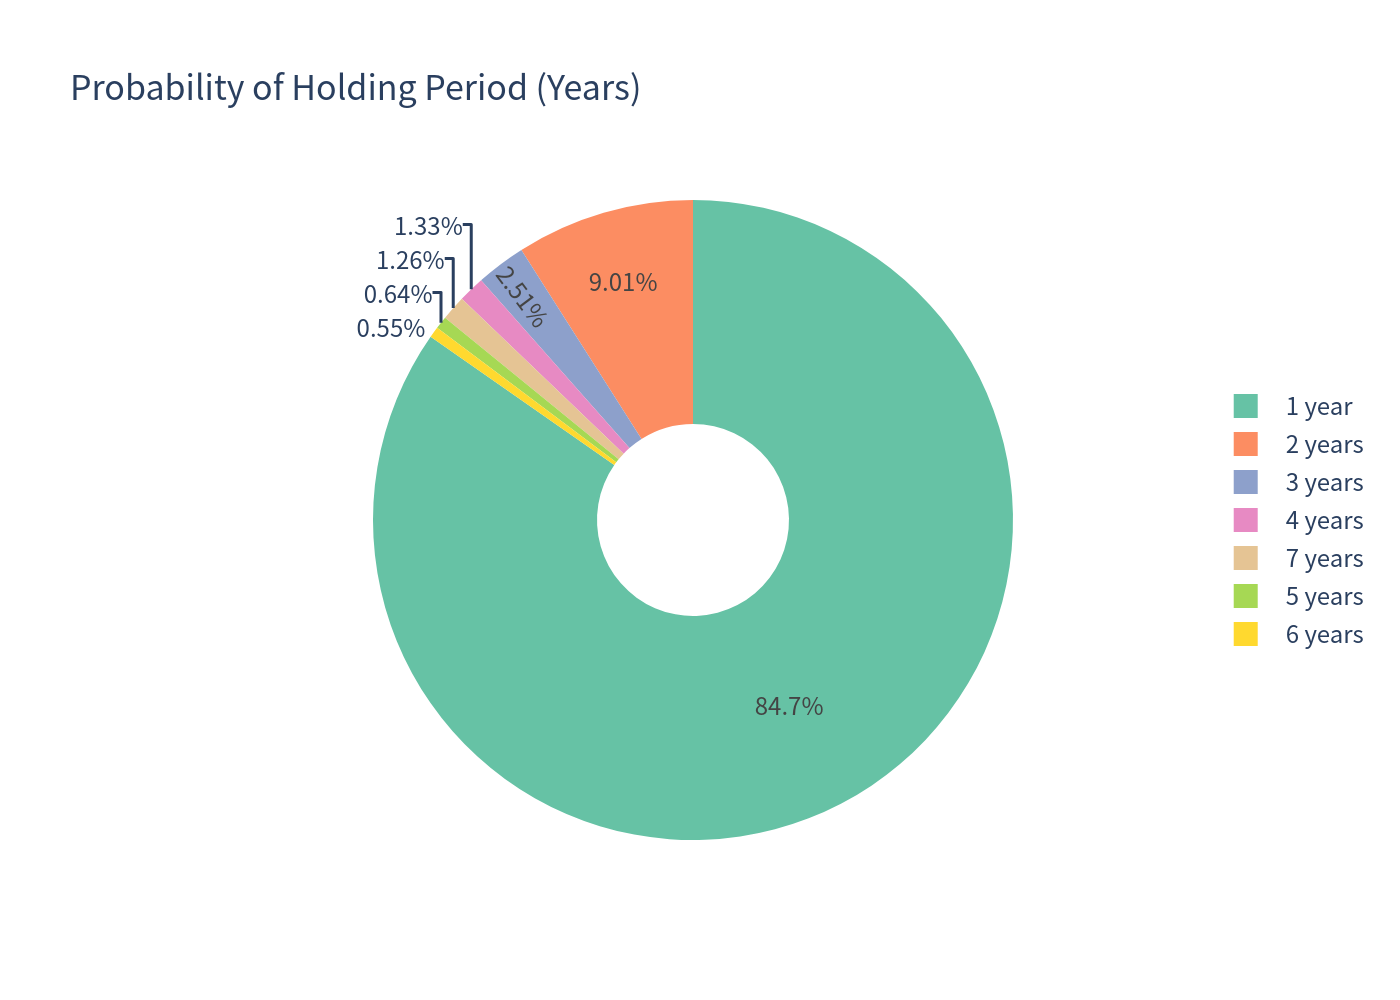
the note is an auto-callable structure — 84.70% of simulated paths redeem after just 1 year at the fixed step-up return of 14.25%, and a further 9.01% redeem after 2 years. The expected annualized return of 13.89% should therefore be read together with the short expected holding period (~1.31 years) and the expected total return of 17.44% over that holding period. Because a large majority of outcomes are one-year redemptions, the annualized figure is close to the headline 14.25% per-annum call return rather than an extreme extrapolation.
Basic Product Information
Product: Morgan Stanley Finance "MSAMP5 Step-Up Jump Notes with Auto-Callable Feature" due September 29, 2033 (CUSIP 61781DK80). Principal $1,000 per note, USD. Issuer credit risk applies (Morgan Stanley guarantee).
Underlier: Morgan Stanley Amplitude Index™ (MSAMP5) — a proprietary rules-based multi-asset index targeting ~5% volatility (established January 2026; no public trading history). For analysis purposes the index was approximated by a conservative, low-volatility multi-asset benchmark with comparable risk characteristics.
How it works (layman explanation)
- The note pays no periodic interest. Instead it is checked once a year: if the underlier closes at or above a slowly rising "call" level (100.75% of its starting level in year 1, rising to 104.50% by year 6), the note auto-calls and pays back your principal plus a step-up return of 14.25% per year held (e.g., $1,142.50 after 1 year, $1,285.00 after 2 years).
- If it is never auto-called during the 7-year term, the note matures and pays principal plus 100% of any underlier gain, and never less than principal — i.e., principal is protected at maturity in every simulated scenario (subject to issuer credit risk). Gains are participation in the underlier's price performance (uncapped in the base-case reading of the term sheet).
Payoff profile in one line: high early-call coupon (14.25% p.a., non-compounded) with principal protection at maturity; the trade-off is capped upside if called early and potential "lock-up" to a 0% total return over 7 years if the underlier stagnates.
Key Statistics — Structured Product vs. Underlying Benchmark (total return)
| Metric | Structured Product | Underlying / Benchmark (total return) |
|---|---|---|
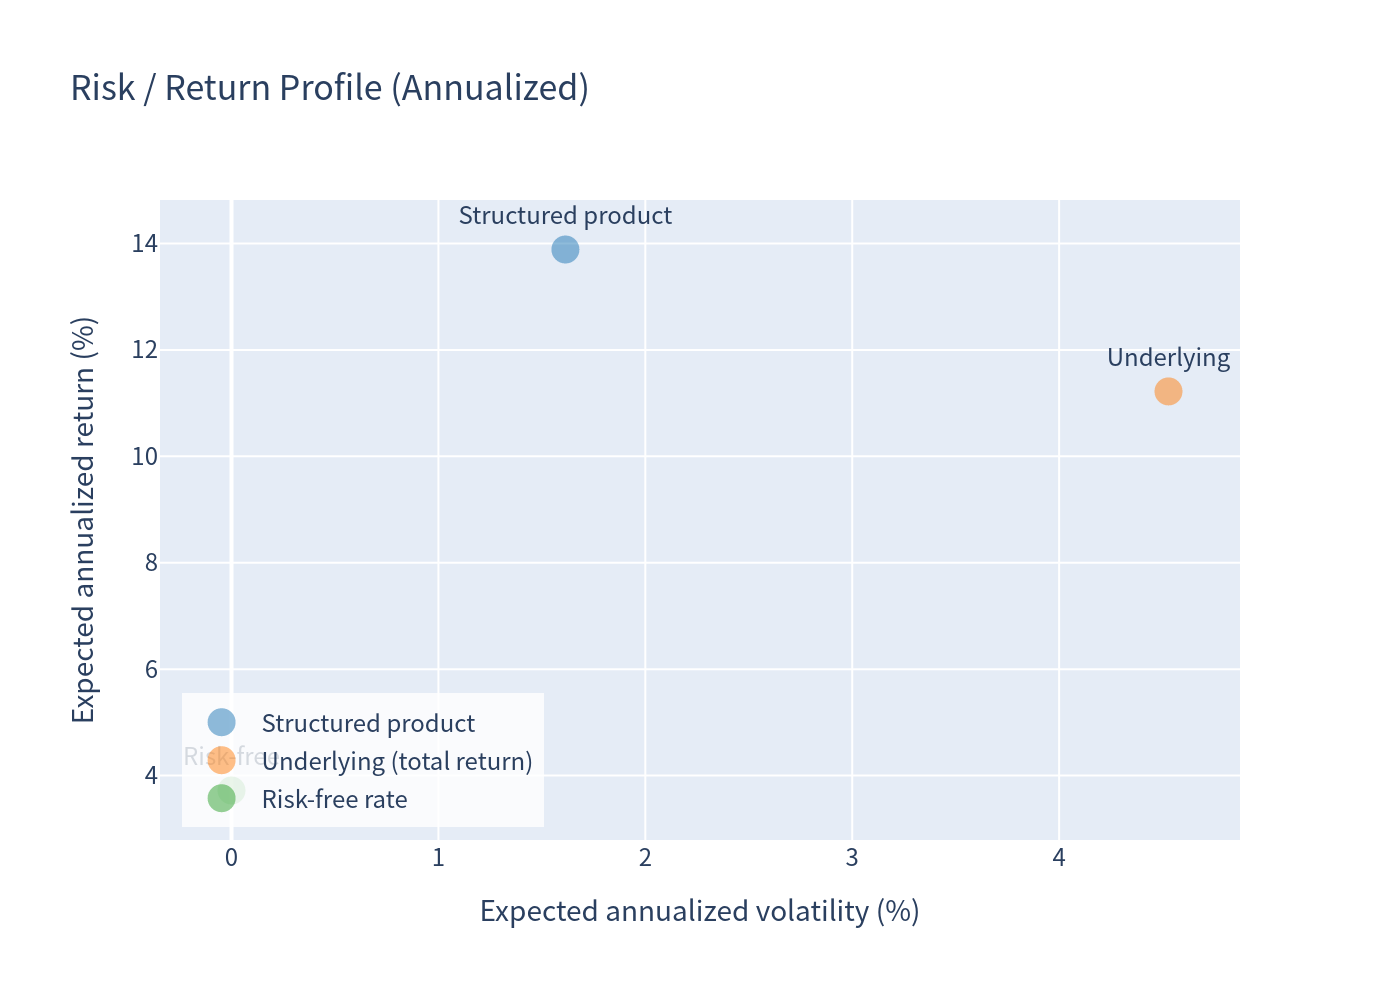
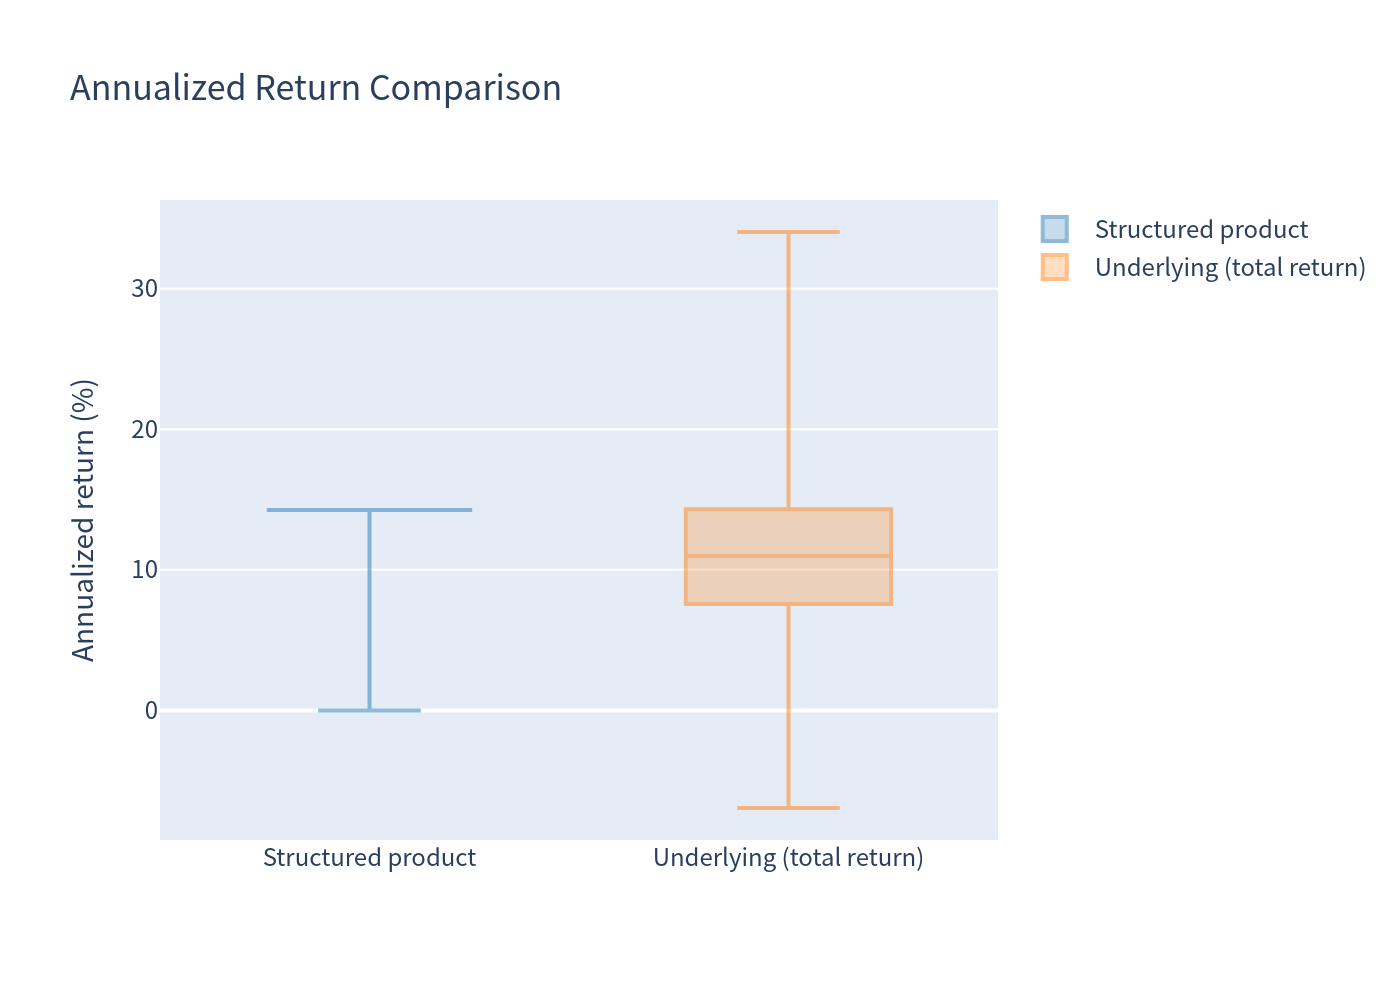
| Expected annualized return | 13.89% | 11.22% |
| Expected annualized volatility | 1.61% | 4.53% |
| Probability of loss | 0.00% | 0.16% |
| 99% confidence VaR (1-yr annualized, 1st percentile) | +1.00% | +4.15% |
Benchmark statistics are measured over the same realized holding periods as the product in each simulation. The benchmark's high VaR percentile reflects that, by construction, early product redemptions occur only when the underlier has cleared its (positive) call thresholds. The product's VaR of +1.00% indicates that even the worst 1% of simulated outcomes remains positive on an annualized basis.
Distribution of Outcomes
- 84.70% of scenarios: auto-called at year 1 → total return 14.25%
- 9.01% of scenarios: auto-called at year 2 → total return 28.50% (13.36% annualized)
- 1.26% of scenarios: held to maturity (7 years)
- Worst simulated total return: 0.00%; best simulated total return: 85.50%
- Annualized return spread (5th–95th percentile): 12.60% to 14.25%
Charts
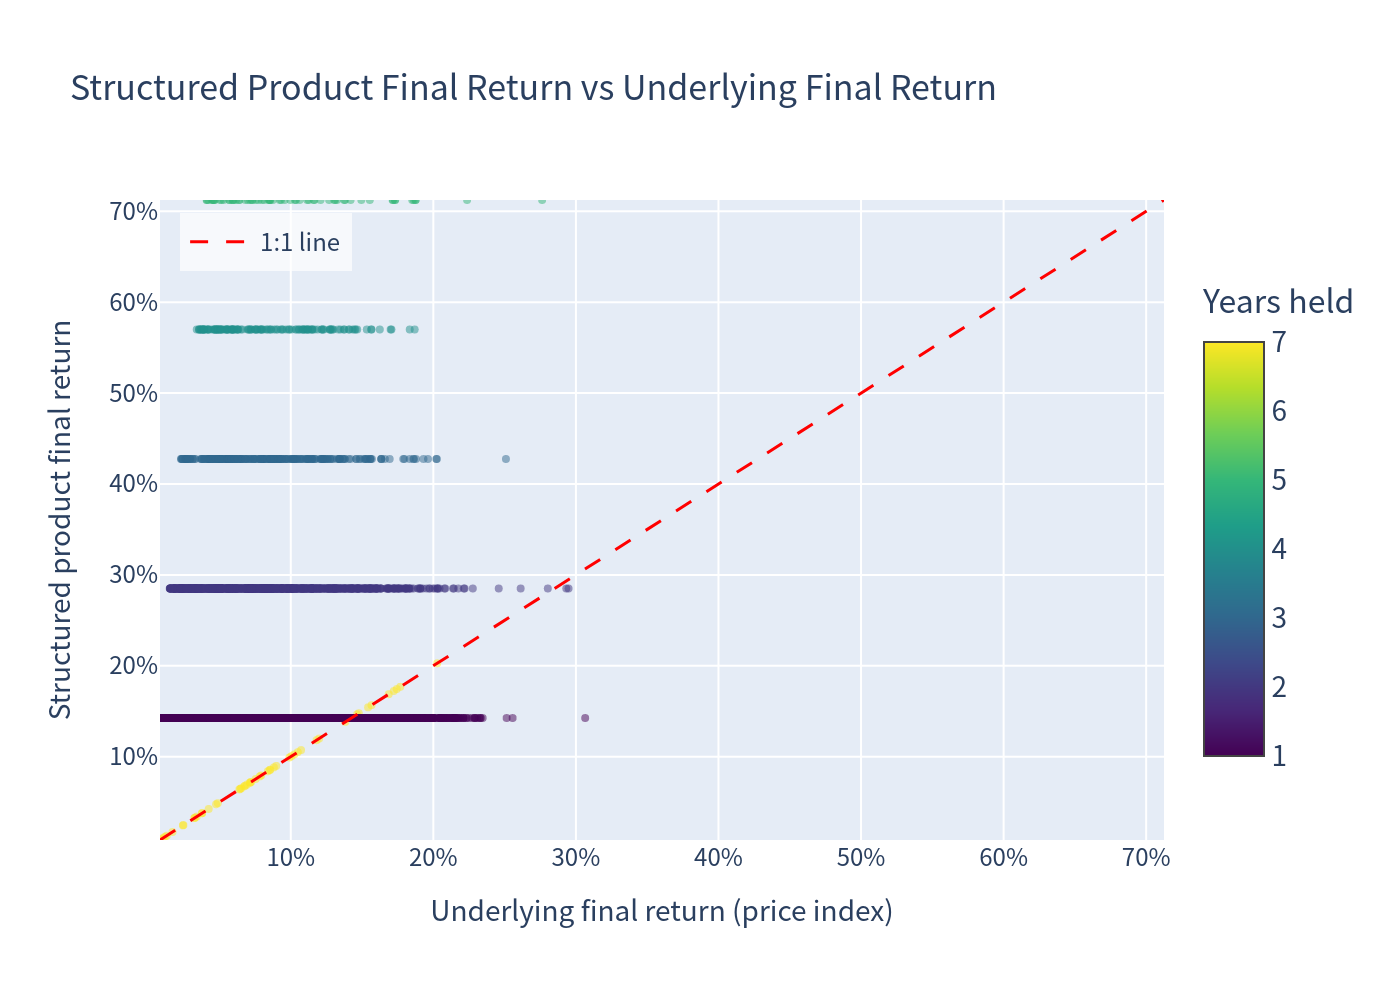
Simulation Outcomes — Product Return vs. Underlying Return
Each dot is one simulation; color shows how many years the note was held. The dashed line is the 1:1 reference.
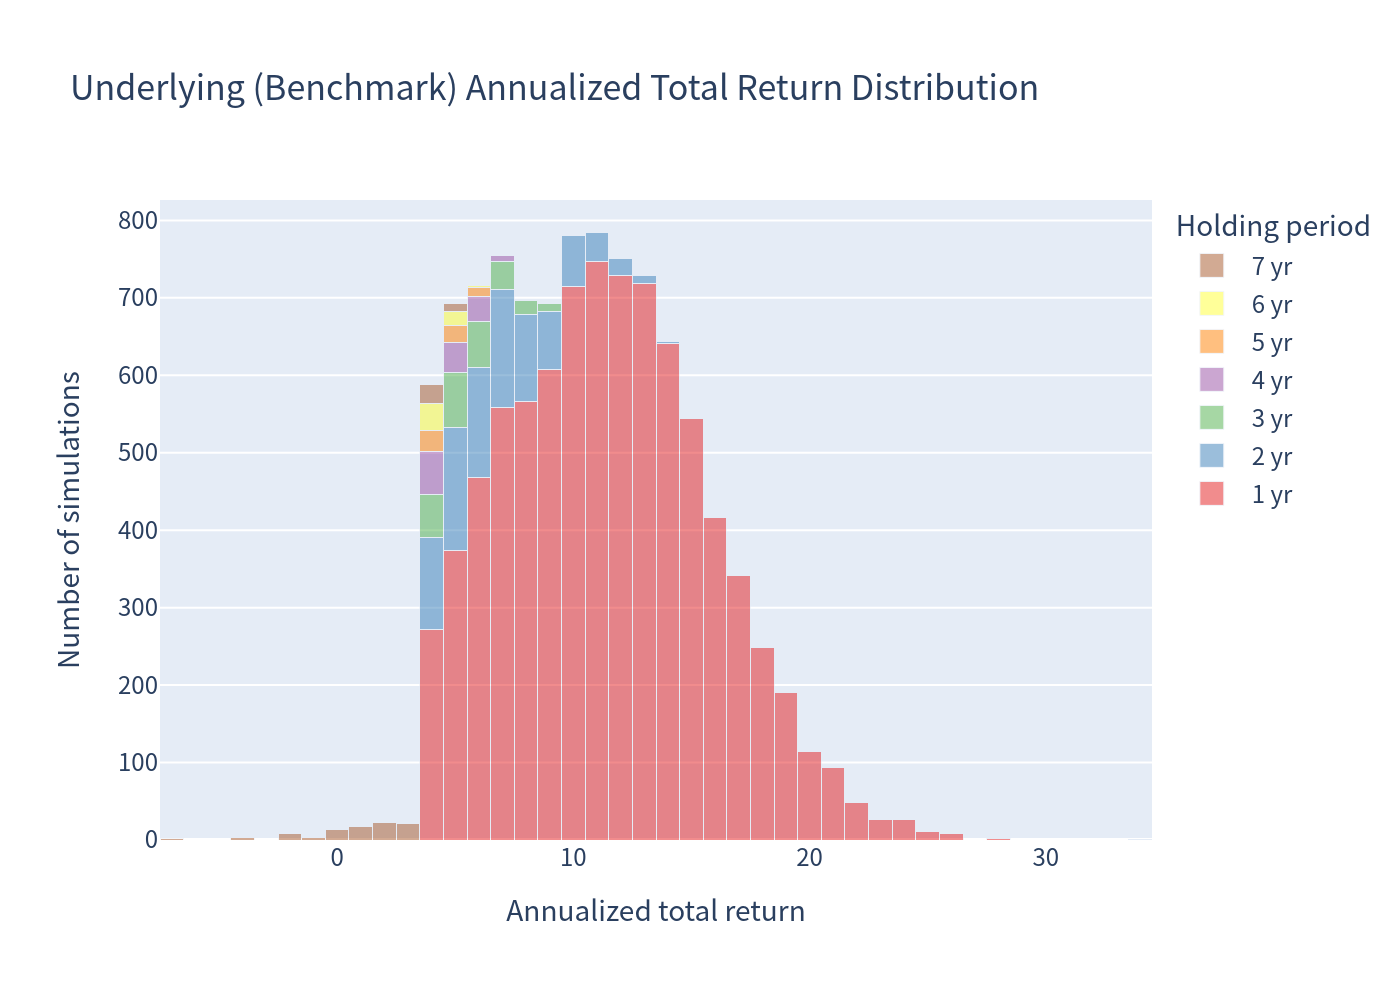
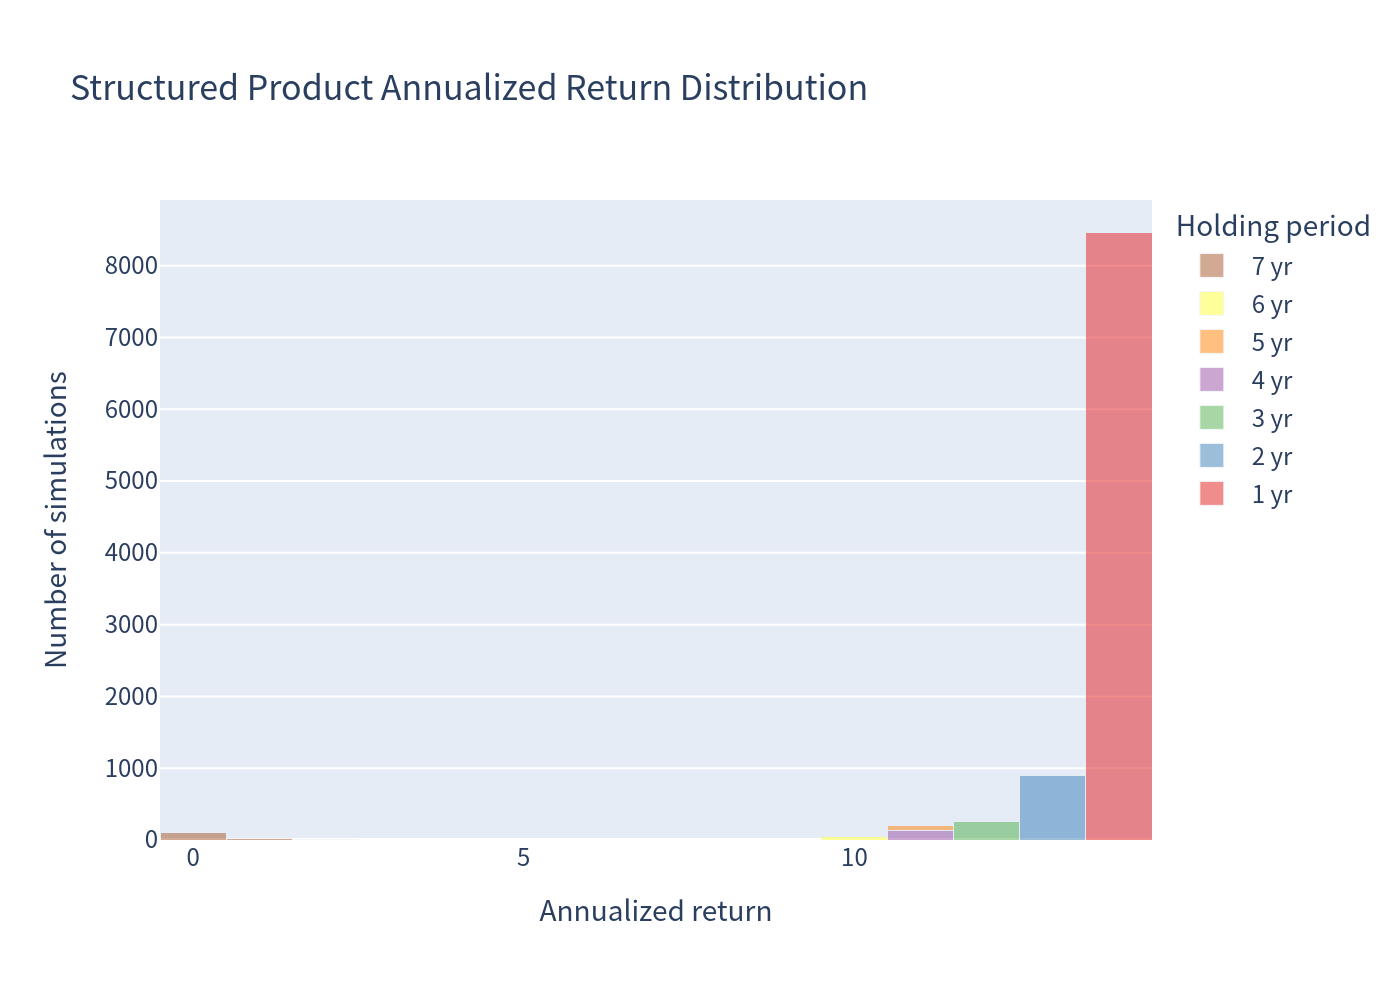
Annualized Return Distributions
Distribution of the underlier benchmark's annualized total return (1% bins; color = holding period in years).
Distribution of the structured product's annualized return (1% bins; color = holding period in years).
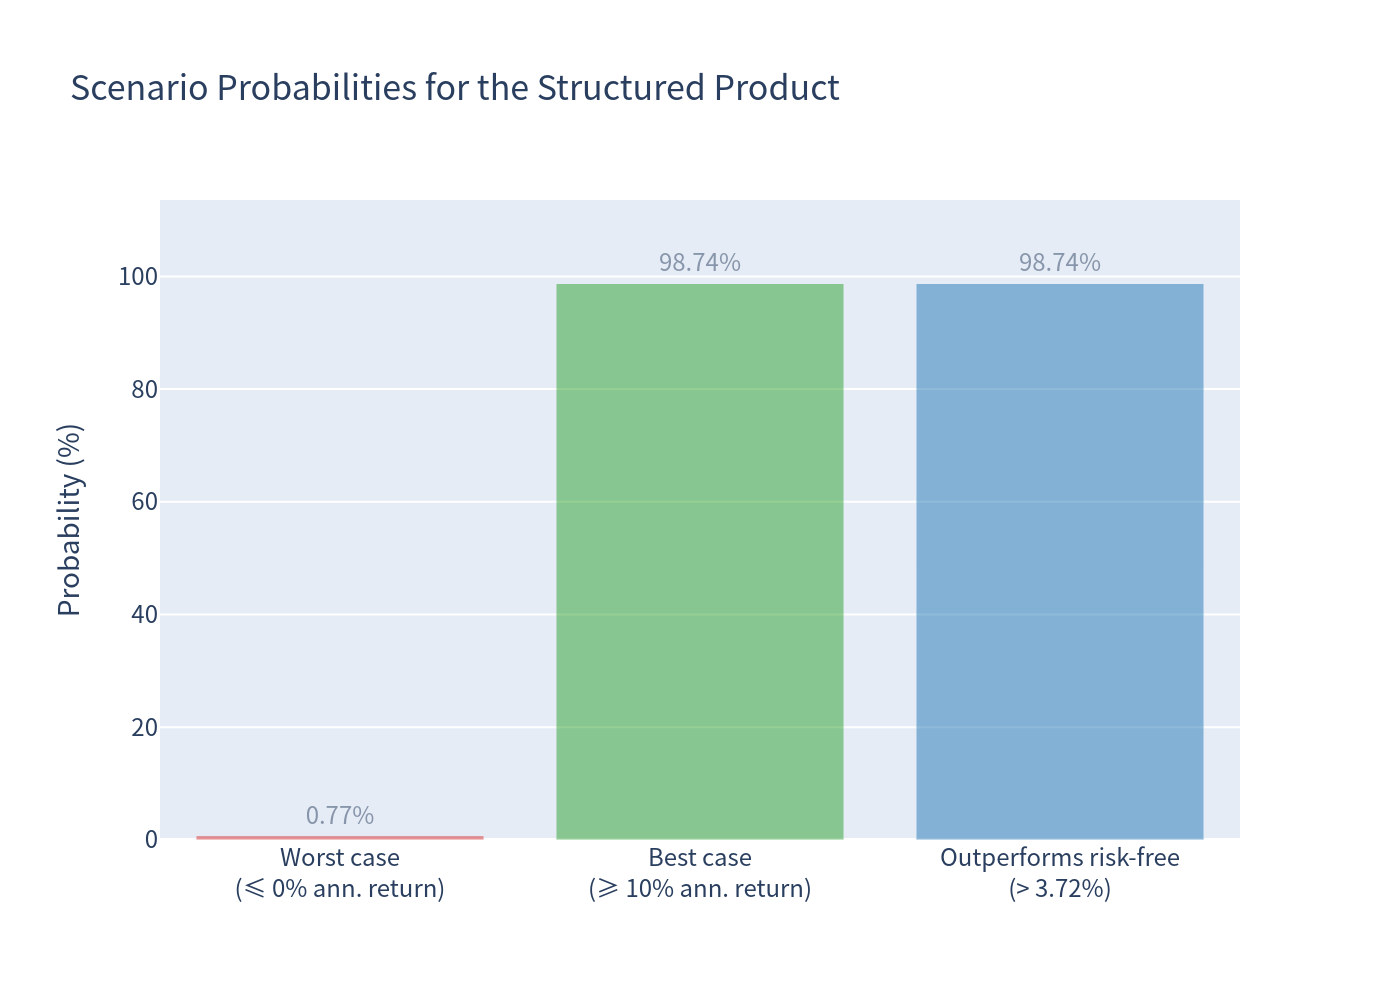
Scenario Probabilities
Chance of a worst case (≈0% annualized), a best case (≥10% annualized) and outperforming the risk-free rate (3.72%).
Risk / Return Profile
Expected annualized return vs. expected annualized volatility for the product, the underlying benchmark (total return) and the risk-free rate.
Annualized Return Comparison (Box Plot)
Holding Period Distribution
Investment Commentary
Attractive features (pros)
- Principal protection at maturity: the note returned no less than par in 100% of simulated scenarios (subject to Morgan Stanley credit risk); probability of a negative annualized return is 0.00%.
- High, early step-up returns: a 14.25% p.a. return is locked in when the note auto-calls, which happens within one year in 84.70% of scenarios and within two years in 93.71%.
- Low volatility of returns: annualized volatility of only 1.61%, versus 4.53% for the underlying benchmark.
- Attractive expected return for the risk borne: expected annualized return of 13.89% against a risk-free rate of 3.72%, and an expected total return of 17.44% over the ~1.31-year expected holding period.
- Maturity upside kicker: if the underlier never triggers a call, investors still receive 100% participation in any underlier gain at maturity.
Points to weigh (cons / risks)
- Capped upside on early redemption: if the underlier rallies strongly (e.g., +20% in a year) the note still pays only the fixed step-up amount (14.25% in year 1), forfeiting gains above that level.
- Lock-up / low-return tail: in scenarios where the underlier never clears the rising call thresholds (stagnating index), the note runs to maturity and can return only par (0% total over up to 7 years) — a meaningful opportunity cost versus the 3.72% risk-free rate, and far below the benchmark in those same paths.
- Underlier characteristics: MSAMP5 is a new proprietary index (established 2026) with embedded costs, leverage/deleveraging rules and a very short track record; outcomes are model-driven and sensitive to the assumed index return/volatility profile.
- Issuer credit risk: all payments depend on Morgan Stanley Finance LLC / Morgan Stanley.
This analysis is for information only and does not constitute investment advice or a suitability assessment.
Notes: The proprietary MSAMP5 index has no public price history; a conservative multi-asset benchmark proxy was used for the simulation. Figures are rounded to two decimal places.