
Dual Directional Trigger PLUS — Investment Analysis
Headline Simulation Results
| Metric | Result |
|---|---|
| Expected annualized return | 8.72% |
| Probability of a negative annualized return | 4.27% |
| 99% confidence VaR (1-year) | -15.65% |
| Expected total return over the 5-year term | 61.61% |
| Probability of outperforming the risk-free rate (3.73%) | 65.95% |
Over 10,000 simulated 5-year scenarios, the security delivered a positive outcome in the large majority of cases, primarily because of the built-in downside buffer (the 60% threshold combined with the "dual directional" feature that still pays a positive return when the worst performer falls modestly).
Note on return measures. "Expected annualized return" is the average of the per-simulation compound annual growth rates (8.72%). "Expected total return over the term" is the average of the per-simulation 5-year total returns (61.61%). Because of the dispersion of outcomes (volatility drag), the latter does not compound back to the former; both measures are correct and are reported side by side.
Basic Product Information
- Issuer / Guarantor: Morgan Stanley Finance LLC / Morgan Stanley
- Stated principal amount: $1,000 per security
- Term: ~5 years (issue May 29, 2026 → maturity May 30, 2031)
- Underlyings: Dow Jones Industrial Average, Russell 2000 Index, S&P 500 Index
- Coupon: None — the securities pay no interest
- CUSIP: 61781FJN4
How it works (plain English)
This is a 5-year, principal-at-risk note that makes a single payment at maturity based on the performance of the worst performing of three equity indices. There are no periodic coupons and no early-redemption feature, so the investor is locked in for the full five years.
At maturity, the investor receives one of three outcomes, driven by the worst performer's percentage change (W):
- All three indices finish up: You get your principal back plus a leveraged upside of 134% × W. (The leverage factor will be set between 134% and 149% on the pricing date.)
- At least one index finishes down, but none falls more than 40%: You get your principal back plus a positive return equal to 50% of the worst performer's decline. This is the "dual directional" feature — a modest decline still produces a gain, capped at +20%.
- Any index finishes down more than 40% (below its 60% downside threshold): Principal protection is lost. You lose 1% for every 1% decline in the worst performer, and the payment could be zero.
Because the payoff is tied to the worst of the three indices, the investor gains no diversification benefit: a single index breaching its threshold drives the entire outcome.
Key Statistics
| Metric (annualized) | Structured Product | Benchmark (Equal-Weight Basket, Total Return) |
|---|---|---|
| Expected annualized return | 8.72% | 9.54% |
| Expected annualized volatility | 8.72% | 7.77% |
| Probability of loss | 4.27% | 11.09% |
| 99% confidence VaR (1-year) | -15.65% | -9.83% |
Reading the numbers
- The security's expected annualized return (8.72%) is modestly below the diversified basket's total return (9.54%), reflecting the cost of the protection/dual-directional features and the effect of linking to the worst performer.
- Its probability of loss is far lower (4.27% vs 11.09%): in the "modest decline" zone the structure still pays a positive return, and losses appear only once an index breaches the 60% threshold.
- However, its tail risk is worse (-15.65% vs -9.83% VaR) and its overall volatility is higher. This is the defining trade-off of a worst-of structure: the buffer lifts the whole body of the distribution (the 5th-percentile outcome is about +0.1% versus -3.7% for the basket), but when the barrier is breached the investor bears the full, undiversified decline of the single worst index, fattening the extreme left tail.
- The equal expected return and expected volatility figures (both 8.72%) are a genuine numerical coincidence in this simulation, not a data error.
Charts
Simulation Outcomes vs Benchmark
Scatter of product vs benchmark final returns. Each point is one simulated scenario.
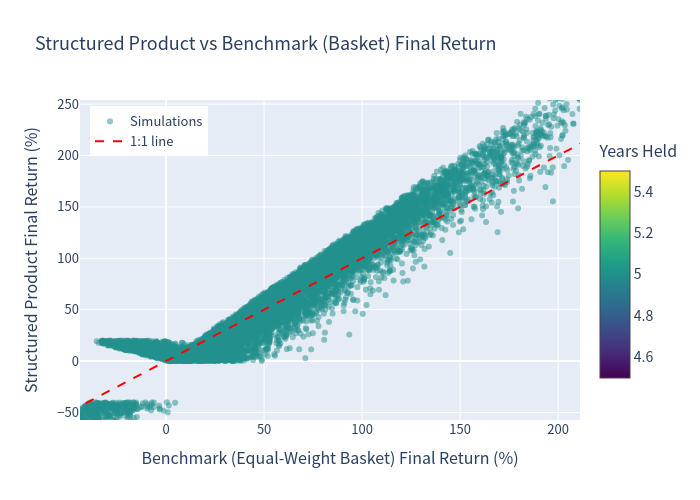
Each point is one simulated scenario. Points above the red 1:1 line represent scenarios where the security beat the basket. The cluster of points sitting above the line at mildly negative basket returns illustrates the dual-directional buffer, while points below the line in the lower-left reflect barrier breaches where the worst-of effect bites hardest.
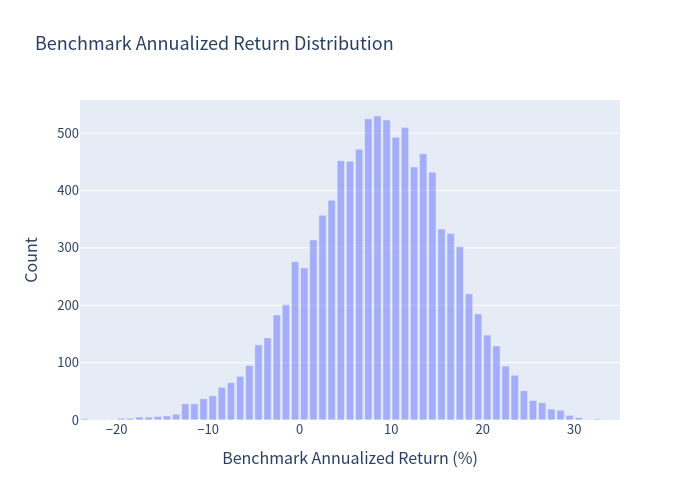
Annualized Return Distribution — Benchmark
Benchmark annualized return histogram.
Annualized Return Distribution — Structured Product
Structured product annualized return histogram.
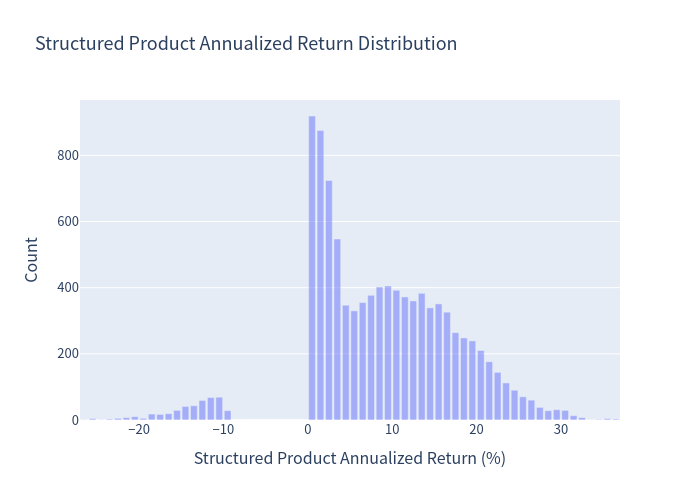
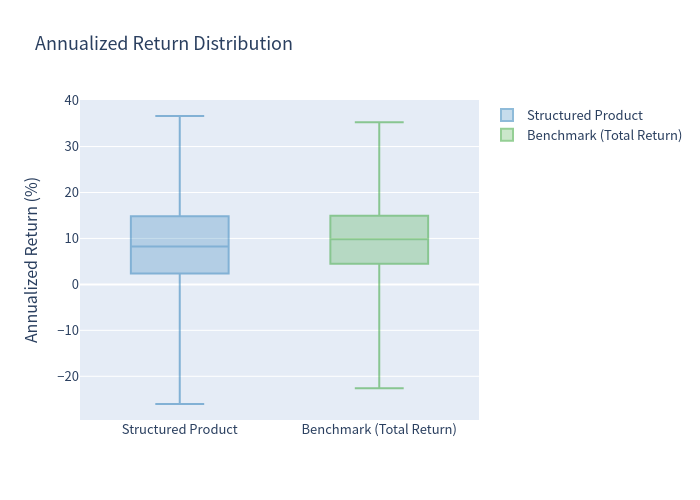
The product's distribution has a higher density of positive outcomes and a materially smaller probability of loss than the basket; its 5th-percentile outcome stays positive. The trade-off is a fatter extreme left tail once the 60% barrier is breached.
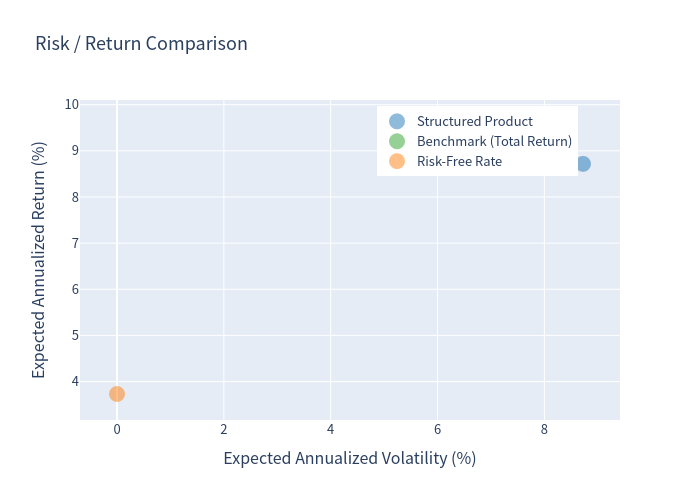
Risk / Return Comparison
Risk return scatter.
Annualized Return Box Plot
Box plot comparison.
Scenario Probabilities
Scenario probability bar chart.
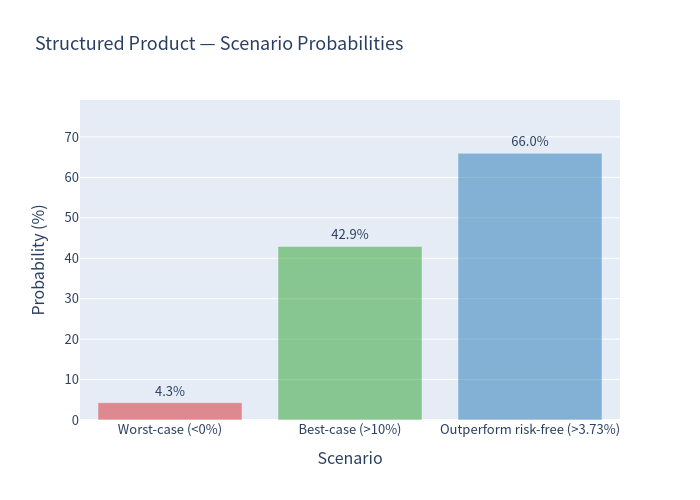
- Worst case (negative annualized return): 4.27%
- Best case (>10% annualized return): 42.92%
- Outperform the risk-free rate (3.73%): 65.95%
Investment Commentary
Potential merits
- Substantial downside buffer: Losses only occur if an index falls more than 40% over five years, and the 4.27% simulated probability of any loss is materially below the diversified basket's 11.09%.
- Dual-directional feature: Even when the worst index declines (by up to 40%), the structure still pays a positive return of 50% of that decline — a genuinely useful feature in flat-to-mildly-negative markets.
- Leveraged upside: If all three indices rise, the 134% leverage amplifies the worst performer's gain, and the upside is uncapped.
Considerations
- Worst-of concentration: The payoff ignores the better-performing indices entirely. In scenarios where one index (historically, the small-cap Russell 2000 is the most volatile) lags, the outcome is dragged down even if the S&P 500 and Dow perform well.
- Worse tail risk: Despite the lower probability of loss, the 99% VaR (-15.65%) is worse than the basket's (-9.83%), and in a severe breach the investor can lose the entire principal.
- No income: The security pays no coupon, so any return depends entirely on the terminal outcome.
- Full-term lock-up: There is no early redemption, so capital is committed for the entire five years.