
Structured Product Analysis
21.00% p.a. Multi Barrier Reverse Convertible on ams-OSRAM, Sika & VAT Group — Callable (ISIN CH1593789501)
Headline Simulation Results
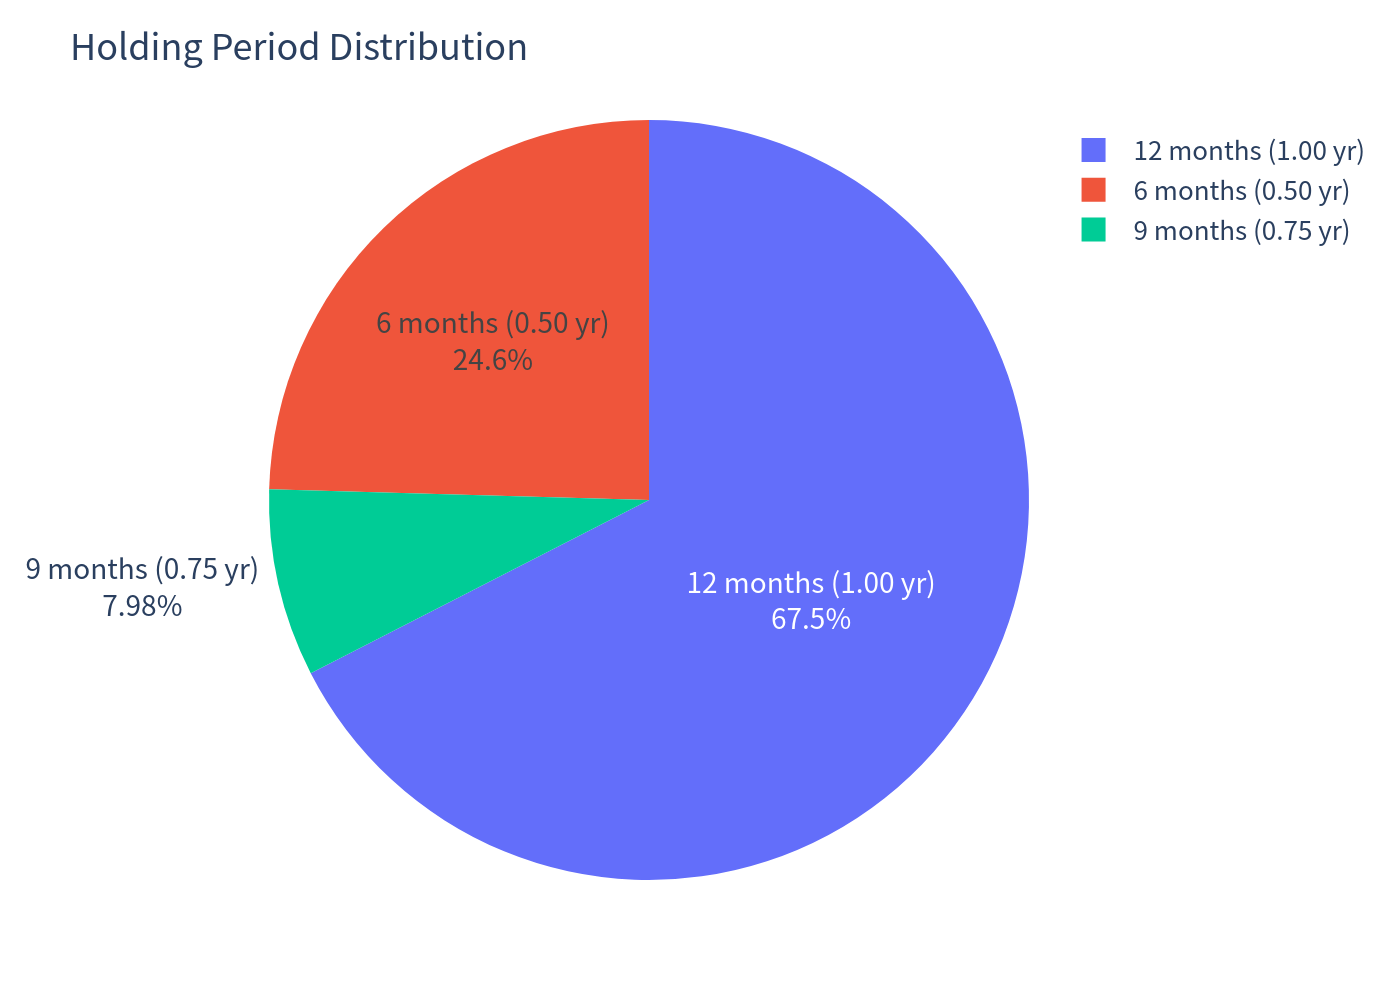
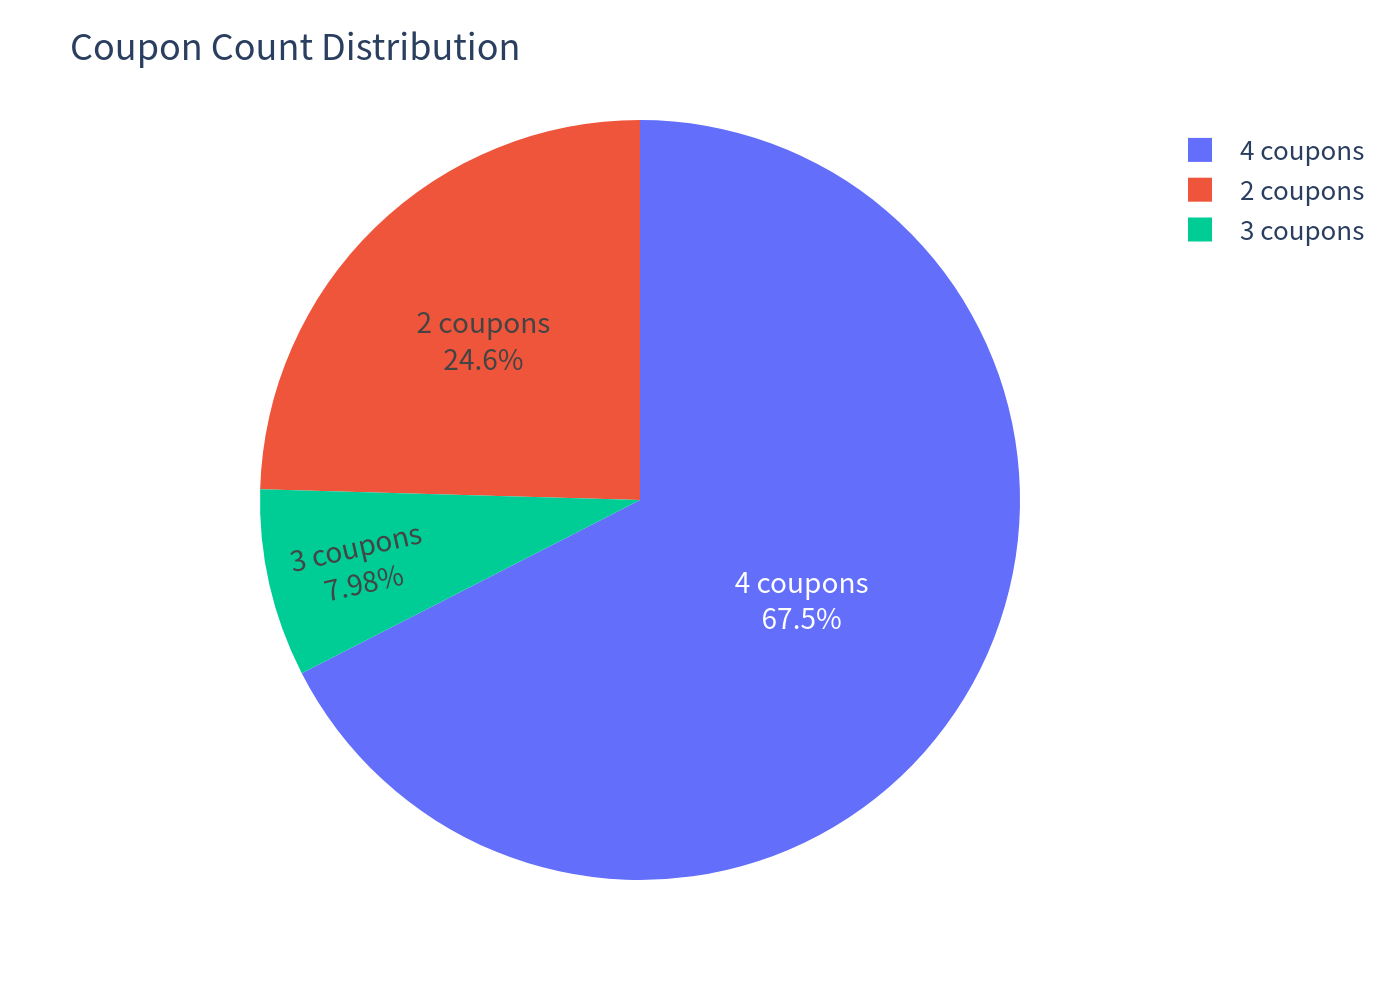
The simulated paths split into three outcomes: (i) the product is called early (≈24.55% at month 6 and ≈7.98% at month 9), returning par plus the coupons due up to the call date; (ii) it runs to maturity with no capital loss, returning par plus all four coupons; or (iii) it runs to maturity with a capital loss after a barrier breach.
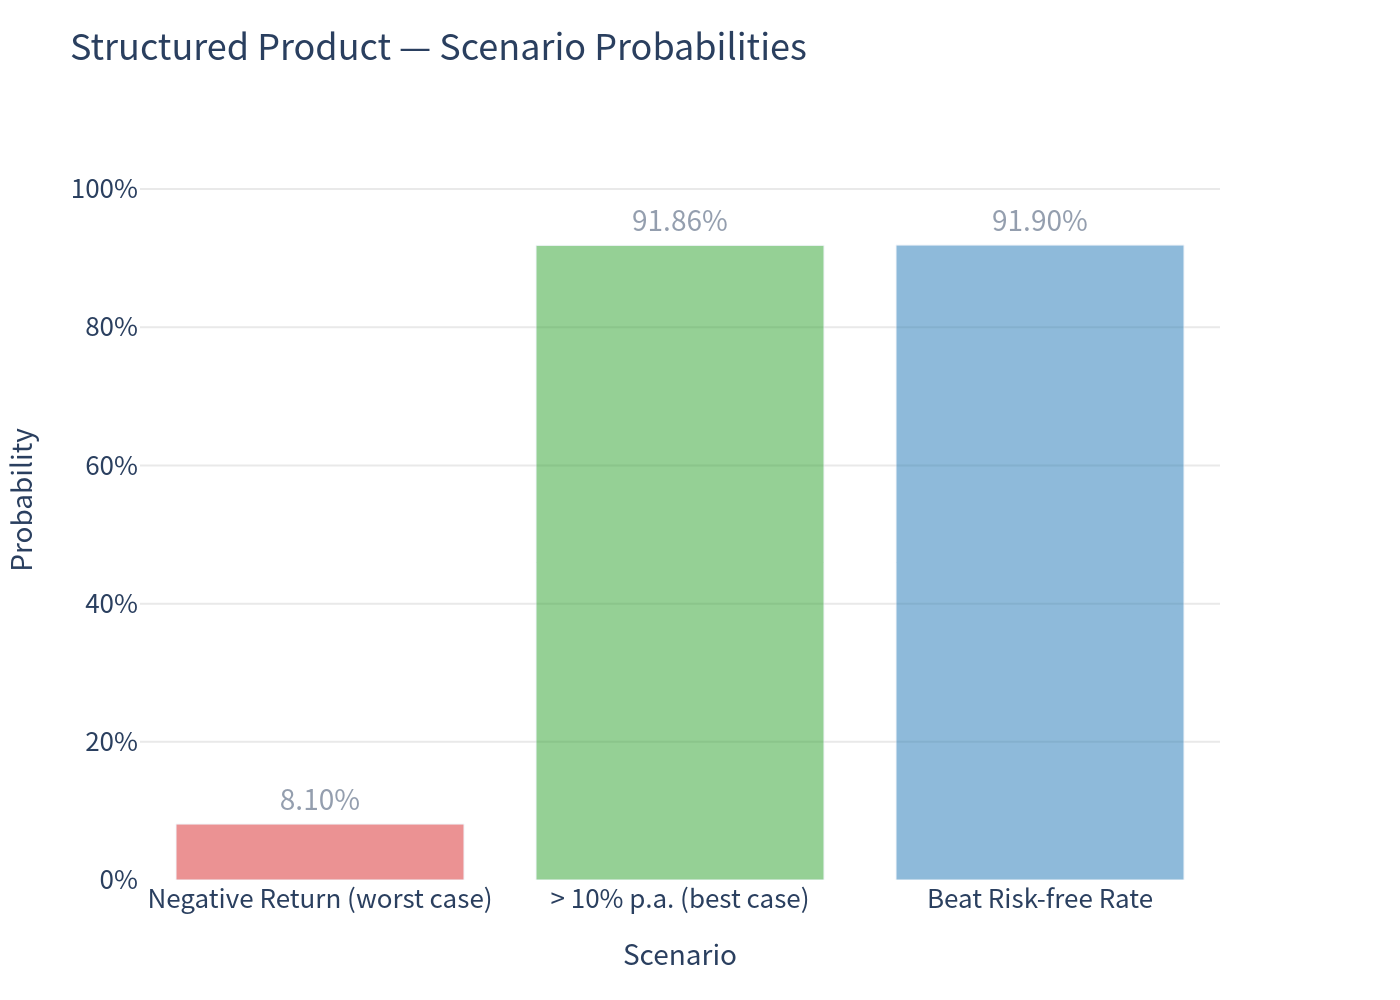
About 92% of paths earn the maximum capped annualized return of 21.00% p.a. (par redemption plus the coupon stream accrued up to the exit date — including the often-early-called paths), giving an expected annualized return of 16.85% with a 8.10% chance of a loss. The rare but severe tail — when the worst-of the three stocks breaches its 49% barrier and finishes below its strike — produces a 99% VaR of -38.33%.
Product Overview
| Item | Detail |
|---|---|
| Product type | Multi Barrier Reverse Convertible (Yield Enhancement), Issuer-callable |
| Underlyings | ams-OSRAM AG, Sika AG, VAT Group AG (worst-of) |
| Currency | CHF (no FX/quanto feature) |
| Denomination | CHF 1,000 |
| Coupon | 21.00% p.a. paid quarterly (CHF 52.50 per quarter, 5.25 index points) |
| Barrier | 49.00% of initial (continuous observation, entire term) |
| Strike | 100.00% of initial |
| Upside cap | Yes — maximum redemption is par (100%) |
| Issuer early call | Possible at month 6 and month 9 |
| Term | 1 year (issue 30/09/2026, maturity 30/09/2027) |
How it works (in plain terms)
- You invest CHF 1,000 and, in exchange, you are promised 21% per year, paid in four quarterly instalments of CHF 52.50, regardless of how the shares move — as long as the product is still running.
- In return, you accept downside exposure to the worst performer of the three stocks if the market crashes hard.
- Protection: as long as none of the three stocks ever trades at or below 49% of its starting level (i.e. never loses ~51%) at any time during the year, you get your CHF 1,000 back at maturity.
- If the barrier is breached and the worst-of the three finishes below its starting level, you receive that worst-performing stock (or its cash equivalent) and you bear the full loss of that stock. You keep all the coupons already paid.
- Early call: the issuer may redeem the product after 6 or 9 months. If it does, you get par plus the coupon due at that date, and no further coupons.
- Upside is capped: you never receive more than your CHF 1,000 back plus the coupons — you do not participate in any share price gains.
Key Statistics
| Metric | Structured Product | Benchmark (Equal-Weight Basket + Dividends) |
|---|---|---|
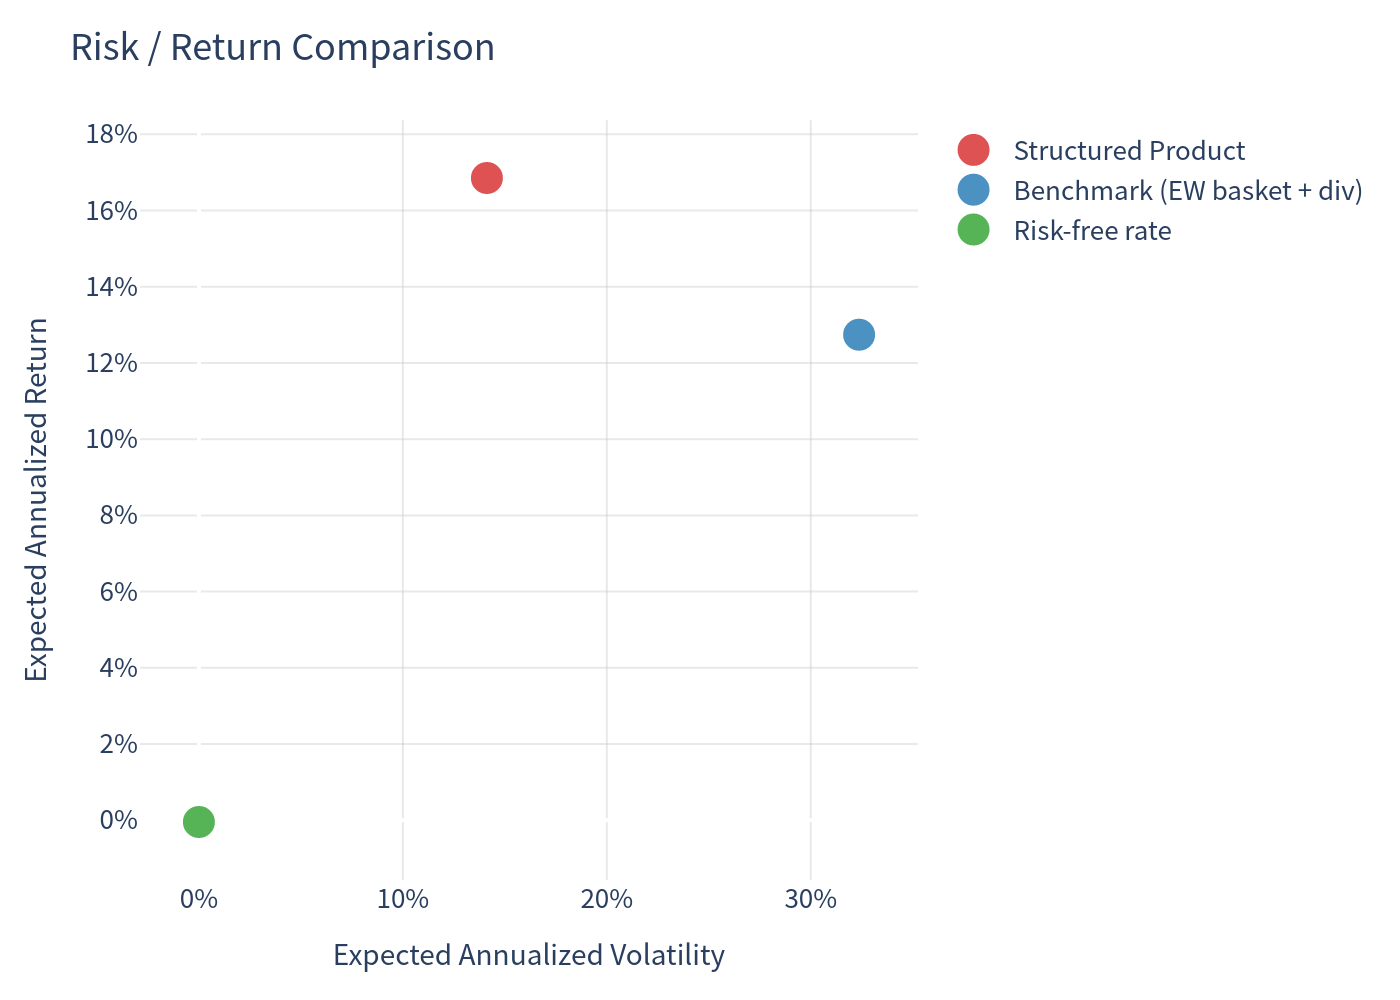
| Expected annualized return | 16.85% | 12.74% |
| Expected annualized volatility | 14.12% | 32.37% |
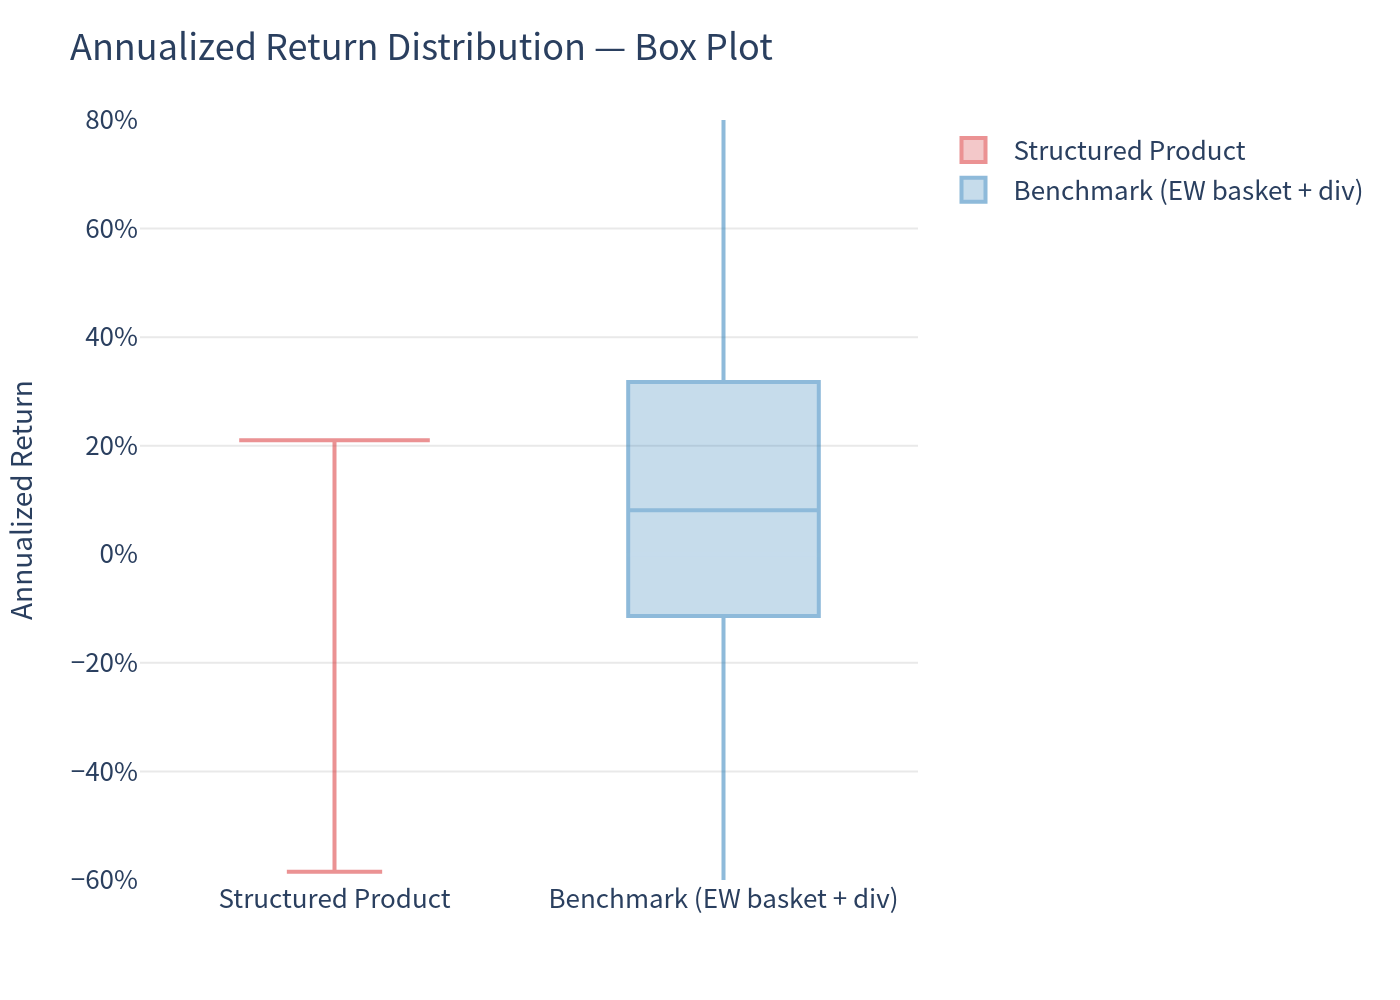
| Probability of loss | 8.10% | 40.26% |
| 99% confidence VaR (1 year) | -38.33% | -41.50% |
| Median annualized return | 21.00% | 8.12% |
Risk-free rate (1-year average CHF money-market rate): -0.05%. Benchmark = equally-weighted basket of the three underlyings, including an average dividend yield of 1.01%.
Charts
4.1 Simulation outcomes — Product return vs Worst-of Underlying return
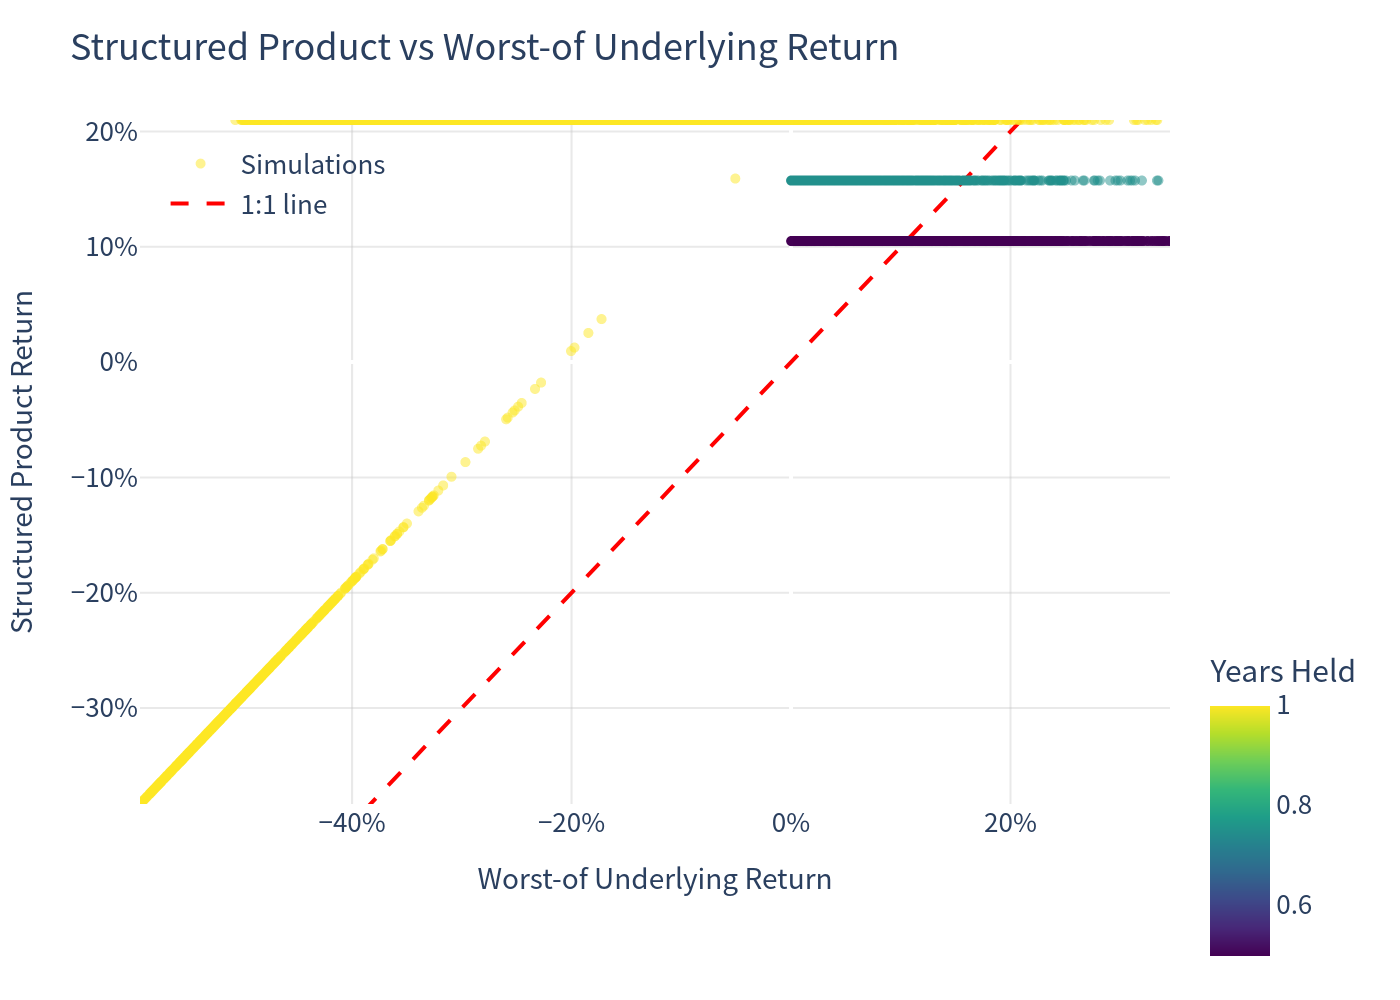
The scatter shows the capped, capital-protected-shaped payoff: when the worst-of rises, the product return flattens at the capped coupon level (~21.00% annualized), while a cluster of paths to the lower-left shows losses where the worst-of fell sharply.
4.2 Benchmark — Simulated annualized returns
4.3 Structured product — Simulated annualized returns
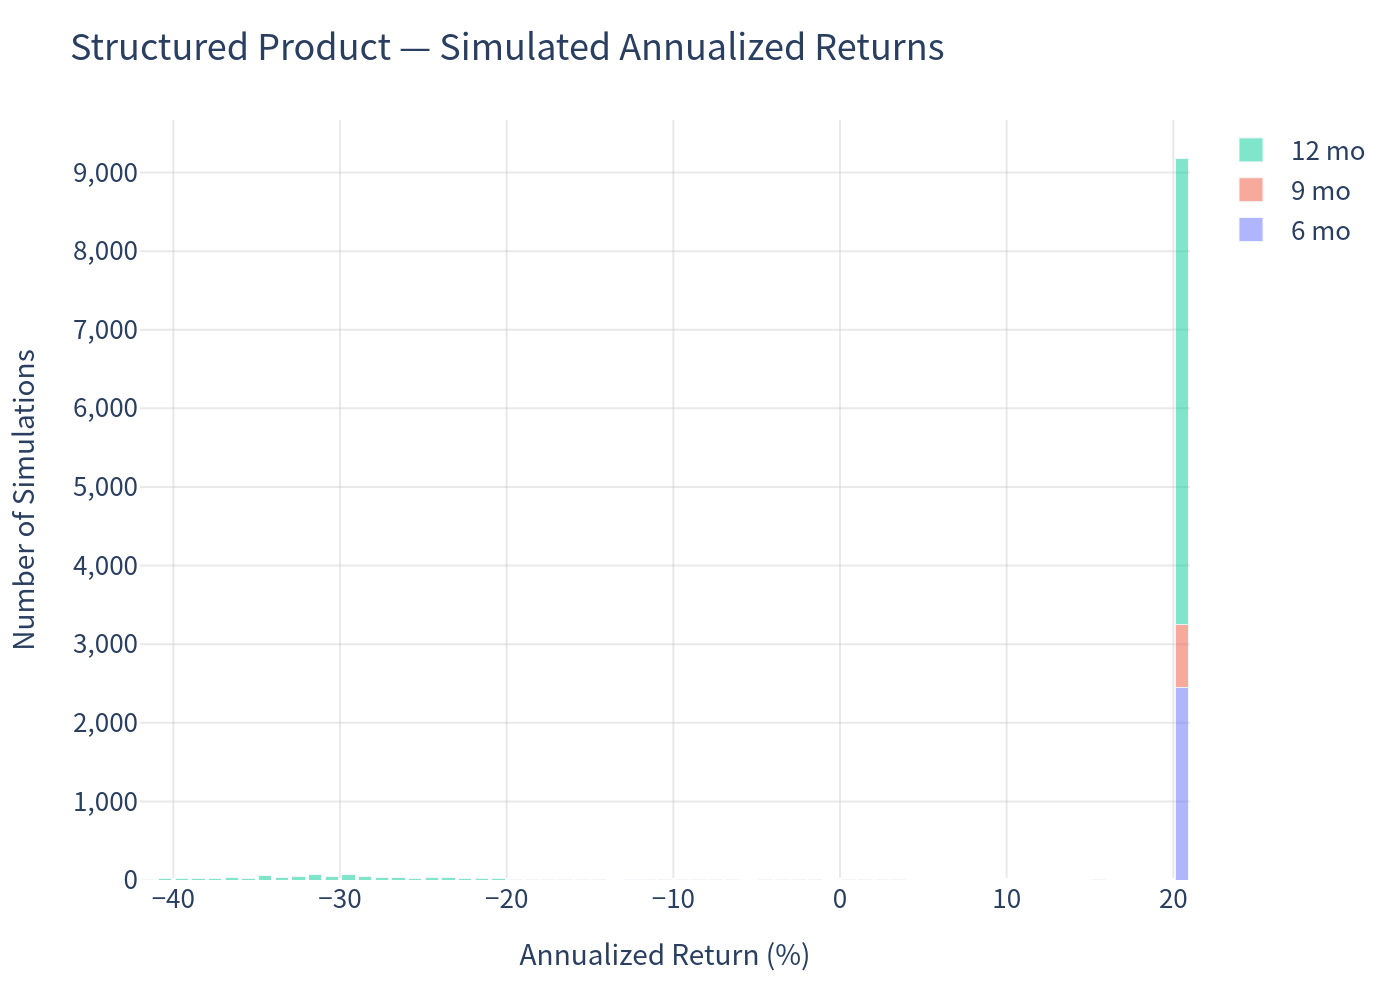
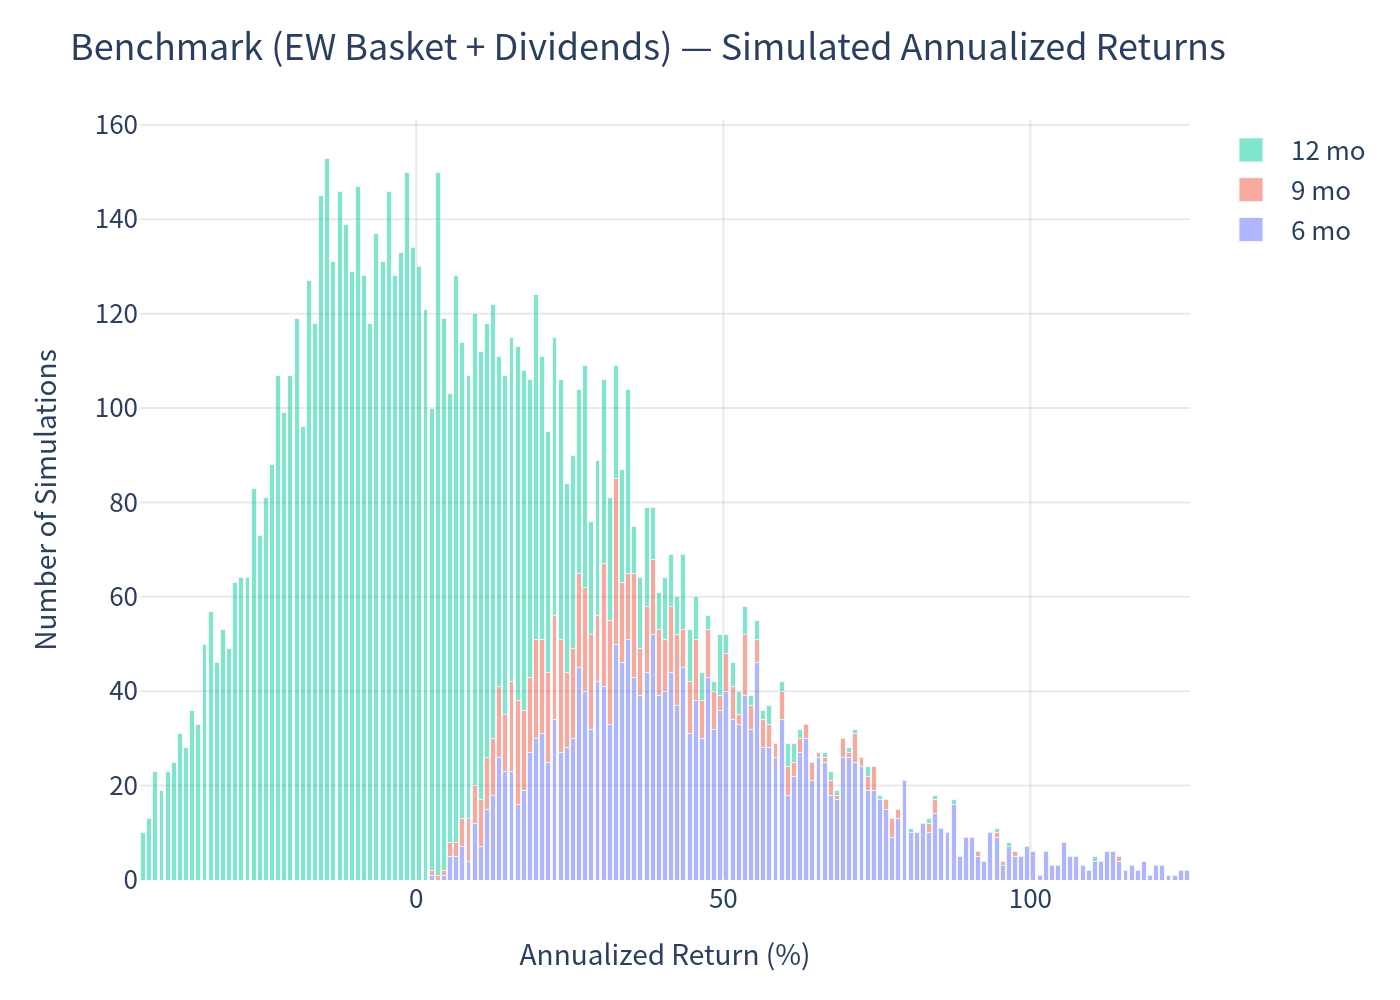
The product's return distribution is highly concentrated at +21% (the capped coupon outcome) with a small left tail of losses — a very different shape from the benchmark's wide, symmetric distribution.
4.4 Scenario probabilities
4.5 Risk / return comparison
4.6 Annualized return distribution — Box plot
4.7 Holding period and coupon count
Investment Commentary
Good points
- High headline carry: 21.00% p.a. coupon paid quarterly, independent of share performance and paid even on an early call.
- Deep protective barrier: the 49% continuous barrier is set well below the strike, so the worst-of can fall almost half before the investor's capital is at risk. In the simulation only ~8.24% of paths breached it.
- Short, defined tenor: maximum one year, with the possibility of an early call at 6 or 9 months returning par plus accrued coupon.
- Attractive simulated risk-adjusted profile vs. holding the shares: the coupon stream produces a materially higher and far less volatile return than the underlying basket (expected annualized return 16.85% vs 12.74%, volatility 14.12% vs 32.37%), because the coupon is earned in the large majority of scenarios.
Risks to be aware of
- Capped upside, downside to the worst performer: the investor never participates in share gains, but suffers the full loss of the worst performer once the barrier is breached and the worst-of ends below its strike.
- Worst-of exposure: the barrier is monitored against the worst of three names — including the highly volatile ams-OSRAM — so the effective risk is that the weakest single stock breaches 49%.
- Severe left tail: the 99% VaR is -38.33%; in the worst simulated paths investors lost more than half of their capital even after collecting coupons.
- Reinvestment / early-call risk: the issuer is likely to call precisely when the trade is performing well, capping the total coupon stream (expected holding period ≈ 0.86 years).
- Issuer credit risk: the note is an unsecured obligation of the issuer (Leonteq Securities AG, Guernsey Branch).
- Physical delivery: on the downside scenario the investor may receive shares (of the worst performer) rather than cash, and further price moves and costs may apply.
All figures are simulated results and are provided for illustration only. This document is not investment advice or a suitability assessment.